1 Introduction
Since the textual entailment paradigm of modeling semantic inference was first introduced (Dagan and Glickman, Reference Dagan and Glickman2004), it has become a notable concept in the field. Yet, although entailment has been successfully utilized in various natural language processing systems, until recently it has been applied only in a pairwise manner, to recognize the entailment relation between single pairs of elements.
Recently, researchers started utilizing entailment to construct entailment graphs, where nodes represent language expressions and directed edges represent entailment between nodes. Berant, Dagan and Goldberger (Reference Berant, Dagan and Goldberger2012) proposed a global algorithm over entailment graphs with predicates at nodes, in order to improve acquisition of entailment rules between predicates, such as X marry Y → Y is X’s spouse. Following this line of work, Adler, Berant and Dagan (Reference Adler, Berant and Dagan2012) demonstrated an application that provides a hierarchical summary for a set of propositions that focus on a target concept. Mehdad et al. (Reference Mehdad, Giuseppe, Ng and Joty2013) built an entailment graph of token n-grams for topic labeling. Recently Levy, Dagan and Goldberger (Reference Levy, Dagan and Goldberger2014) suggested an approach for organizing and consolidating open IE propositions, such as ‘cure(aspirin, headache)’, using the notion of proposition entailment graphs.
In this work, we suggest a novel type of graphs, namely TEGs, where nodes represent complete natural language texts rather than single concepts (like in concept hierarchies), n-grams or reductive structures such as predicates and open-IE propositions.
We continue this paper by depicting the textual entailment paradigm, describing in more detail the related work in the field of entailment graphs and in the field of text exploration, which is our motivating scenario (Section 2). Then, we elaborate on the notion of TEGs (Section 3.1) and describe the methodology we developed for their generation (Section 3.2), which consists of two steps: (i) construction of an individual entailment graph for each input text, and (ii) merging of the individual graphs into a single entailment graph. We also introduce the dataset created for the task of constructing TEGs (Section 3.3). Further, we discuss evaluation issues and provide a baseline for merging individual graphs by using off-the-shelf textual entailment engines (Section 4). Finally, we demonstrate the potential of TEGs for text exploration (Section 5) and discuss additional NLP tasks for which, in our opinion, using TEGs can be beneficial (Section 6).
2 Background
2.1 Textual entailment
Textual entailment (TE) recognition (Dagan and Glickman, Reference Dagan and Glickman2004) is the task of deciding, given two text fragments, whether the meaning of one text fragment (termed the hypothesis) is entailed (can be inferred) from the other (termed the text). For example, the text ‘23 factories inspected were found to be illegally dumping waste into the Yangtze’ entails the hypothesis ‘The Yangtze is polluted’, since the second sentence can be inferred from the first. The textual entailment relationship between a text t and a hypothesis h is defined in terms of truth values: t entails h (denoted t → h) if, typically, a human reading t would infer that h is most likely true (Dagan, Glickman and Magnini, Reference Dagan, Glickman and Magnini2006).
The entailment relation differs from traditional text similarity, which does not capture the implication effect (Mihalcea, Corley and Strapparava, Reference Mihalcea, Corley and Strapparava2006). For example, the two texts ‘Swedish cuisine has a huge variety of breads of different shapes and sizes’ and ‘French cuisine has a huge variety of breads of different shapes and sizes’ are highly similar, yet there is no entailment relation between them. On the contrary, the two texts in the above Yangtze example are not quite similar, while the meaning of one can be inferred from the other. In this sense, the task of recognizing textual entailment is different from tasks which traditionally rely on the text similarity notion, such as text clustering, categorization, etc.
Since it has been introduced, the notion of textual entailment has expanded from entailment between texts to entailment between a variety of textual units, such as single terms (pet → animal), predicates (X marry Y → Y is X’s spouse) and propositions (cure(aspirin, headache) → eliminate(painkiller, headache)).
We note that, as argued in Dagan et al. (Reference Dagan, Dolan, Magnini and Roth2010), textual entailment is defined from an applied empirical perspective to allow recognizing meaning-entailing variability in different application settings, while reflecting the somewhat uncertain inferences that are typically expected from text-based applications. Hence, being a general relation, textual entailment subsumes several different semantic relations, including a number of ‘probabilistic’ cause–effect and problem–solution patterns. For example, the text ‘Medications for Alzheimer’s disease exact an enormous financial drain on the medical system, while being of limited effectiveness for most patients’ entails the hypothesis ‘For treatment of Alzheimer cheaper and more effective drugs should be developed’, since a human reading the text would infer that the hypothesis is most likely true.Footnote 1 In addition, entailment has contextual effects, since in different contexts people assign truth values differently. At the lexical level ‘kill’ and ‘cure’ are not entailing, yet ‘kill cancer cells’ entails ‘cure cancer’. The same is true for the textual level, e.g. a student answering a reading comprehension test would assume that the text ‘The witness saw John level a handgun toward the victim moments before gunshots were fired’ entails the hypothesis ‘The victim was shot by John’, while a judge reading the same text in court records might disagree with this entailment decision. Thus, different application scenarios, contexts, and domains might require specific pragmatic rules and assumptions in judging textual entailment.
Along the years, textual entailment has become a prominent paradigm for modeling semantic inference, since it captures the inference needs of a broad range of text understanding applications. Entailment has been successfully used in various NLP systems for different applications, such as open-domain question answering (Harabagiu and Hickl, Reference Harabagiu and Hickl2006), (multi-document) summarization (Harabagiu, Hickl and Lacatusu, Reference Harabagiu, Andrew and Lacatusu2007; Lloret et al., Reference Lloret, Ferràndez, Muñoz, Palomar, Sharp and Zock2008), machine translation (Mirkin et al., Reference Mirkin, Specia, Cancedda, Dagan, Dymetman and Szpektor2009), content synchronization (Negri et al., Reference Negri, Marchetti, Mehdad, Bentivogli and Giampiccolo2012), intelligent tutoring systems (Nielsen, Ward and Martin, Reference Nielsen, Ward and Martin2009), redundancy detection in Twitter (Zanzotto, Pennacchiotti and Tsioutsiouliklis, Reference Zanzotto, Pennacchiotti and Tsioutsiouliklis2011) and evaluating tests (Miyao et al., Reference Miyao, Shima, Kanayama and Mitamura2012).
2.1.1 Textual entailment engines
Textual entailment engines are tools for identifying entailment relationships between texts. Given a pair of a text and a hypothesis, a TE engine decides whether the text entails the hypothesis. TE engines usually exploit knowledge resources, such as WordNet (Fellbaum, Reference Fellbaum1998) or VerbOcean (Chklovski and Pantel, Reference Chklovski and Pantel2004), to recognize synonyms, hyponyms, and other semantically related words and thus better identify entailment between texts. Typically, entailment engines use training examples of entailing and non-entailing text-hypothesis pairs in order to learn a model for classifying unseen examples.
Various entailment engines have been developed and evaluated within the recognizing textual entailment (RTE) challenge (Bentivogli et al., Reference Bentivogli, Clark, Dagan and Giampiccolo2010, Reference Bentivogli, Clark, Dagan, Dang and Giampiccolo2011). In this work, we will be using two state-of-the-art open-source engines available as part of the Excitement Open Platform for textual entailment (Magnini et al., Reference Magnini, Zanoli, Dagan, Eichler, Neumann, Noh, Pado, Stern and Levy2014):Footnote 2
• BIUTEE (Stern and Dagan, Reference Stern and Dagan2013)—a transformation-based TE engine, which aims at validating the entailment relation between a text and a hypothesis by finding a sequence of linguistically-motivated transformations to turn the text into the hypothesis.
• TIE (Wang and Neumann, Reference Wang and Neumann2008)—a multi-level classification TE engine, which addresses the task of recognizing textual entailment via three independent classification problems: (1) whether the text and the hypothesis are related; (2) whether they are mutually consistent; (3) whether there is an inherent directionality from the text to the hypothesis.
2.2 Entailment graphs
Although entailment has been successfully utilized in various NLP systems, until recently it had been applied only in a pairwise manner, to recognize the entailment relation between single pairs of elements. Recently, researchers started using entailment to construct entailment graphs.
Indeed, it is natural to describe entailment relations by a graph, where nodes represent language expressions and directed edges represent entailment between nodes. The graph should respect the constraint that entailment is a transitive relation, i.e. if the edges (u, v) and (v, w) are in the graph, so is the edge (u, w). Transitivity implies that in each strong connectivity component of the graph, all of the nodes entail all of the other nodes and therefore have the same meaning. Moreover, if every strong connectivity component is merged into a single node, the graph becomes a Directed Acyclic Graph (DAG), and the graph nodes can be sorted and presented hierarchically (Berant et al. 2012).
Berant et al. (2012) explored the aforesaid properties of entailment graphs. They defined a graph structure over predicates, representing entailment relations as directed edges, and used a global transitivity constraint on the graph to learn the optimal set of edges, by formulating the optimization problem as an Integer Linear Program. As a result, they improved the performance for the task of automatically learning entailment rules between predicates by more than ten percent over baseline algorithms, which produced local pairwise decisions. We note that the algorithm was applied in a setting where, given a target concept, the algorithm learns all entailment rules between predicates that co-occur with this concept, i.e. rules where one of the predicate’s arguments is instantiated, e.g. X reduce nausea → X affect nausea. In an additional study, Berant, Dagan and Goldberger (Reference Berant, Dagan and Goldberger2011) suggested scaling techniques to extend their global algorithm to entailment graphs over typed predicates, i.e. predicates where the argument types such as ‘city’ or ‘drug’ are specified.
Mehdad et al. (2013) applied the ideas above to construct entailment graphs for token n-grams (n = 1,. . .,5) in order to improve topic labeling. They identified pairwise entailment relations between all n-grams extracted from a set of texts and applied heuristic rules over the resulting graph to detect most relevant n-grams to be further aggregated for generation of topic labels.
Levy et al. (2014) extended the work of Berant et al. (2012) from predicates to open-IE propositions, which are essentially predicates instantiated with arguments. They advocate the use of proposition entailment graphs for consolidation and organization of open-IE predicates in general, and suggest methods for constructing such graphs in a setting similar to that of Berant et al. (2012), where (1) the propositions are instantiated as binary predicates, i.e. contain exactly two arguments, and (2) propositions are assumed to be retrieved by querying for a particular concept, i.e. out of the two arguments one argument is common to all the propositions in a single graph.
We note that the aforesaid entailment graphs are useful in those settings where the original texts are viewed solely as a source of information for knowledge acquisition (like learning entailment rules), knowledge representation (open-IE propositions), inducing what the given texts are about (topic labeling) etc. However, there are settings in which we are interested to preserve the original texts, such as the text exploration setting, which motivated our work. To address such settings, in this work we present a novel type of graphs, namely textual entailment graphs.
We note that graphs proved to be useful for TE engines (Androutsopoulos and Malakasiotis, Reference Androutsopoulos and Prodromos2010) and for different knowledge representation tasks (Snow, Jurafsky and Ng, Reference Snow, Jurafsky and Ng2006; Suchanek, Kasneci and Weikum, Reference Suchanek, Kasneci and Weikum2008; Nakashole, Weikum and Suchanek, Reference Nakashole, Weikum and Suchanek2012). We suggest that our textual entailment graphs are a natural extension of earlier variants of entailment graphs for nodes with more complex semantics, and a reasonable application of the textual entailment paradigm.
2.3 Text exploration
One of the NLP tasks where the original texts are of particular interest is text exploration, which aims at a systematical investigation of the contents of a target text collection in order to discover and quantify the information expressed in the texts. Traditional approaches used for text exploration, such as Text Categorization and Faceted Search, allow browsing through the main concepts (or categories) of a target collection, organized according to ontological or taxonomic relations between them. Such hierarchies are helpful in understanding what the collection is about, but provide quite limited exploration of what it says about the concepts. In addition, the concepts of interest are assumed to be known, while detecting interesting concepts is one of the exploration goals. This goal can be achieved by Document Clustering, which is one of the most popular techniques for unsupervised document organization. Yet, while clustering can help in analyzing the topics of a text collection, it is not sufficient for exploration of their detailed content.
The detailed content of the texts in a collection can be explored via multi-document summarization. Presenting the data in form of a natural linear text, brief summaries not only familiarize the user with what a given text collection is about, but also expose what the texts actually say. On the other hand, such unstructured representation does not allow for easy browsing. Moreover, for the summaries to be reasonably short only the most prominent information is shown, while other interesting information cannot be feasibly exposed to the user.
Berant et al. (2012) motivated their predicate entailment graph with an exploration-oriented application that would provide a hierarchical summary for a set of propositions that focus on a target concept. This hypothesized application was implemented in the text exploration demo of Adler et al. (2012), which instantiated manually-annotated predicate entailment graphs with arguments, and used a taxonomy of concepts to determine argument entailment. The combined graphs of predicate and argument entailments induced a proposition entailment graph, which could then be explored in a faceted-browsing scheme. Indeed, such a representation allows for easy exploration of information related to a specific target concept, but it is less suitable when the task is to analyze the contents of a text collection mentioning dozens, if not hundreds, of concepts.
Thus, none of the above approaches is handy for easy browsing through the texts, exploration of their detailed content, and quantitative analysis of that data. In this work, we suggest an alternative approach, which extends the prior art by representing the texts in a target collection through a hierarchical entailment graph. This approach maintains the advantages of summarization, since free text representation is preserved, while allowing for structured organization, browsing, and analysis of the texts. Moreover, it can be applied to clustering or categorization output to simplify the exploration of the contents of each cluster (category).
3 Textual entailment graphs
In this section, we give a formal definition of textual entailment graphs and present the methodology we developed for constructing such graphs. Then we describe the dataset, which we created for the task of constructing TEGs.
3.1 Definitions
A TEG is a directed graph where each node is a textual fragment fi and each edge (fi, fj) represents an entailment relation from fi to fj. A textual entailment (fi, fj) holds if the meaning of fi implies the meaning of fj, according to the definition of textual entailment (see Section 2.1). Given a set of textual fragments (graph nodes), the task of constructing a textual entailment graph is to recognize all the entailments among the fragments, i.e. deciding which directional edges connect which pairs of nodes.
The main difference between this task and the RTE task is that the text pairs are not independent. The nodes in the graph are inter-connected via entailment edges, which should not represent contradicting decisions. For example, if the following two edges are present in the graph:
‘No vegetarian snacks in the dining car’ → ‘There’s not enough food selection on train’
‘There’s not enough food selection on train’ → ‘Offer a wider variety of dishes’ then the edge ‘No vegetarian snacks in the dining car’ → ‘Offer a wider variety of dishes’ should be implied by transitivity. A decision that the text ‘No vegetarian snacks in the dining car’ does not entail the text ‘Offer a wider variety of dishes’ would be a violation of transitivity and thus would make the graph inconsistent.
We note that this work was motivated by collaboration with industrial partners from the field of analyzing customer interactions. The gold-standard dataset presented later on in Section 3.3 is based on customers’ negative feedback to a railway company, for which reason we will be using examples from this domain further in the paper. It can be observed from the examples above that the contextual TE effects mentioned in Section 2.1 also happen in our data, and therefore entailment judgements depend on the pragmatic interpretation of texts by the users of the domain. For example, we consider the judgement ‘There’s not enough food selection on train’ → ‘Offer a wider variety of dishes’ valid, since in the given domain a person complaining on insufficient food selection and a person requiring a wider variety of dishes actually articulate the same intended meaning. In the application scenario of analyzing customer dissatisfaction ‘There is no X’ → ‘There should be X’ is typically a valid entailment, since the meanings of the left-hand side and the right-hand side statements concur, while in other domains such a pattern might not be applicable (compare e.g. ‘There is no Ebola in the North Pole’ → ‘There should be Ebola in the North Pole’).
3.1.1 Textual fragments
We define the nodes of a TEG to be textual fragments, implying any textual units for which textual entailment in terms of truth values can be attributed. Yet, in order to fully exploit the power of entailment for structural organization of information, we suggest constraining the textual fragments and formally define them as follows: a textual fragment is a content unit that conveys a single complete proposition and can be made up of a continuous or discontinuous sequence of words from an original text.
We assume that given a set of texts and a target application, there should be a subset of texts which are of interest to the given application. Thus, in application-oriented scenarios only the relevant parts of the original texts can be identified and extracted, allowing to focus on the information of interest. For example, given the text ‘I would not recommend Quasigo as I had to change at Moonport instead of Belville Europe on the return journey, the food is terribly expensive and not good, and there was a fight for luggage space’, the following textual fragments can be detected for the exploration of reasons of customer dissatisfaction:
F1= ‘I had to change at Moonport instead of Belville Europe on the return journey’
F2= ‘the food is terribly expensive’
F3= ‘the food is not good’
F4= ‘there was a fight for luggage space’.
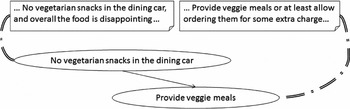
We note that the original texts are likely to express multiple propositions and thus do not allow directly recognizing the entailment connection between them. For example, as shown in Figure 1, the two texts ‘No vegetarian snacks in the dining car, and overall the food is disappointing’ and ‘Provide veggie meals or at least allow ordering them for some extra charge’ are not entailing as is, however extracting valid textual fragments ensures detecting entailment relations between their parts. Although we suggest decomposing the original texts into fragments, the fragments remain as rich semantically as the corresponding source texts, as illustrated by the examples.
Example of textual fragments and entailment relations between them. Fragments can be linked to the original texts from which they were extracted, as denoted by the dotted lines.

3.2 Proposed methodology for constructing TEGs
Given a set of textual fragments of interest, we suggest addressing the task of constructing a textual entailment graph over these fragments as a pipeline of two separate subtasks: (1) further decomposing each input fragment and constructing its individual textual entailment graph, which we term fragment graph, and (2) merging the fragment graphs into a single integrated TEG.
3.2.1 Construction of fragment graphs
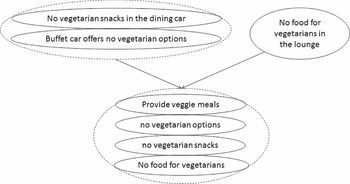
Textual fragments can be further simplified to provide a higher generalization ability, thus increasing the probability of recognizing entailing texts in the collection, and provide a richer hierarchical structure. In the example given in Figure 2, one can see that the fragment ‘No vegetarian snacks in the dining car’ is generalized in its subfragment ‘no vegetarian snacks’, the fragment ‘Buffet car offers no vegetarian options’—in its subfragment ‘no vegetarian options’, and the fragment ‘No food for vegetarians in the lounge’—in its subfragment ‘No food for vegetarians’. Note that this generalization would allow revealing the connection between the three fragments even if the fragment ‘Provide veggie meals’ would not be present in the data.
Example of a TEG with fragment generalization. Dotted nodes unify mutually entailing (paraphrasing) texts, i.e. texts inside such nodes form a clique.

Such generalization prior to directly identifying entailments between the fragments of interest can be useful in different application settings, such as e.g. (multi) document summarization and question answering. For instance, a sentence ‘The Ebola outbreak has rapidly evolved from the forested areas in south-eastern Guinea’ could be generalized in its subfragment ‘The Ebola outbreak has evolved from Guinea’, which in turn could be utilized for generating a short summary about the decease or answering questions about the origins of its outbreak after accumulating evidence from different sources in a TEG.
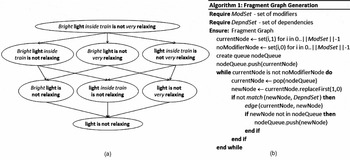
We suggest that such generalization can be effectively performed automatically, if grammatical modifiers, i.e. tokens that can be removed from a fragment without affecting its comprehension, as well as the dependences between them are specified. Given a textual fragment as defined in Section 3.1.1, its corresponding subfragments are created by incrementally removing its modifiers until no modifiers are left. In addition, entailment relations are automatically induced following the principle that a more specific text (i.e. containing more modifiers) entails a more generic one (i.e. containing less modifiers). As a result, an entailment graph of the corresponding fragment, fragment graph, is constructed (see Figure 3(a) for an example).
(a) Example of a fragment graph of the text ‘Bright light inside train is not very relaxing’, with modifiers given in italics. Here and throughout the paper edges that can be obtained by transitivity are omitted from the graphs for simplicity. (b) Fragment graph generation pseudocode.

We note that such generalization can be performed under the assumption that the texts have an existential interpretation, meaning that the entities mentioned in a text are implicitly existentially quantified. For the example in Figure 3(a), the text ‘light is not relaxing’ can be interpreted as ‘(some kind of) light (in a particular place/situation) is not relaxing’, allowing for the entailment ‘Bright light inside train is not very relaxing’ → ‘light is not relaxing’. Similarly, for the example in Figure 2: while the text ‘No vegetarian snacks in the dining car’ forces a universal quantification over ‘vegetarian snacks’, the text ‘no vegetarian snacks’ can be interpreted as ‘(There are) no vegetarian snacks (in a particular place/situation)’ thus yielding the entailment ‘No vegetarian snacks in the dining car’ → ‘no vegetarian snacks’. An interpretation of ‘no vegetarian snacks’ as ‘no vegetarian snacks (exist in the world)’ would make the entailment ‘No vegetarian snacks in the dining car’ → ‘no vegetarian snacks’ invalid, since in this case the entailment should be directed the other way around: ‘No vegetarian snacks (exist in the world)’ → ‘no vegetarian snacks (exist) in the dining car’. In our domain the default interpretation is existential, since a customer complaining on ‘no vegetarian snacks’ is very improbable to refer to all the vegetarian snacks in the world, but rather to the snacks that were missing in a particular situation. We suggest that such interpretation would be the default one for various other settings, as exemplified in the beginning of this section. For application settings and domains where the second, universally-quantified interpretation is the correct one, the phrase ‘in the dining car’ should not be considered a modifier. We thus note that modifiers should be specified with entailment in mind, taking into consideration the pragmatic contextual effects discussed above in Sections 2.1 and 3.1.
For our suggested automatic procedure, we define modifiers as single tokens, and use dependences between them to avoid generation of invalid subfragments, such as e.g. ‘Bright light train is not very relaxing’. More formally, we represent a fragment f as a set of binary attributes, each corresponding to a token in f (see Figure 4), and annotate the dependences between the tokens. As an example, Figure 4 shows that the token train-4 has a dependence with respect to tokens inside-3 and light-2. Tokens for which dependences are specified denote modifiers. Tokens without any dependence (e.g. light-2) denote tokens which cannot be removed from the fragment. Dependence of a modifier m1 on another modifier m2 means that m1 can only be removed from the text after m2 is removed. Reciprocal dependence between two modifiers, like in case of inside-3 and train-4 in our example, means that one token cannot occur without the other, i.e. they should be removed together. Violating these conditions would lead to generation of an invalid subfragment.
Representation of a fragment ‘Bright light inside train is not very relaxing’.

The procedure (see algorithm description in Figure 3(b)) is recursive: starting from the initial fragment, it generates its minimally different subfragments removing one modifier at a time, and then applies the same procedure to all the generated subfragments, till there are no more modifiers to be removed. ModSet is the set of modifiers in a fragment, indexed from 0 to ||ModSet|| − 1. The algorithm outputs a DAG with nodes presented as indexed arrays of size ||ModSet|| having as values either 0 or 1. If node[i] is 1, then the subfragment associated with this node contains the ith modifier. Dependences are represented as a mask DepndSet. This mask is a set of binary arrays, each representing a single modifier combination corresponding to an invalid subfragment as defined above. If the mask matches the subfragment associated with a node, then the node is not included in the generated graph. Method edge(sourceNode, targetNode) adds the source and the target nodes to the graph, if not yet there, and creates the corresponding edge. It is worth noticing that the maximal number of subfragments that can be obtained from a certain fragment is given by 2n, where n is the number of the modifiers of the fragment.
We note that detecting relevant subfragments and organizing them into a fragment graph is a novel task for NLP, which is interesting research wise and is related to other tasks, such as text simplification.
3.2.2 Merging fragment graphs into a single TEG
To obtain the final textual entailment graph, individual fragment graphs are to be merged by means of identifying entailment relations between them. The simplest approach, exponential in the number of nodes in the graphs, would be to obtain an entailment decision for each possible pair of nodes.
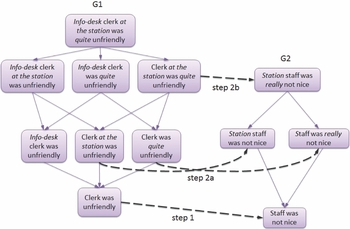
We developed the following more efficient procedure for merging two fragment graphs, G1 and G2, as illustrated in Figure 5:
Illustration of the procedure of merging two fragment graphs.

STEP 1. Obtain entailment decision in either direction between the minimal subfragments (subfragments with no modifiers) of the two graphs. If there is no entailment relation, the graphs should not be connected.
STEP 2. If there is entailment in the direction G1 minimal subfragment → G2 minimal subfragment
(a) Obtain entailment decision between all the pairs G1 node 1 → G2 node 1, where node 1 of a graph denote 1-modifier subfragments, which directly entail the minimal subfragment of the corresponding graph.
(b) Induce entailment for upper-level (i = 2. . .n) nodes in the direction G1 nodei → G2 nodei, if each of the nodes G1 node i − 1 directly entailed by G1 nodei, entails a node G2 node i − 1 directly entailed by G2 nodei.
STEP 3. If there is entailment in the direction G2 minimal fragment → G1 minimal fragment, perform step 2 in this direction.
In order to merge more than 2 fragment graphs, the procedure should be applied between all the pairs of fragment graphs. The final consistent graph is obtained by adding all transitive closure edges. Provided correct pairwise entailment decisions, this merged graph will be the same as the graph obtained by performing all possible pairwise comparisons.
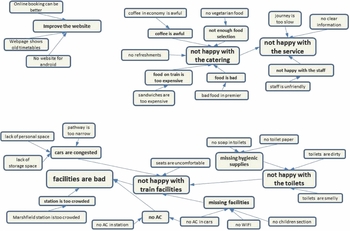
As a result of fragment graph merging, a TEG over the input fragments is constructed. An example of such a graph is given in Figure 6. As illustrated by this example, TEGs are supposed to contain a number of disconnected components, each representing a (sub)topic in the target collection. In order to further reduce the number of node pairs compared during the merging procedure, clustering (or categorization) of input textual fragments can be performed prior to merging, with further generation of a separate TEG per cluster (topic, category). For the example in Figure 6, three clusters could be created and all pairwise comparisons of nodes from different clusters could be saved. We note that depending on clustering granularity such per cluster TEGs might still contain disconnected components, e.g. a cluster about food might contain separate components on the quality and the quantity of food.
Example of a merged textual entailment graph. Size of the nodes reflects their prominence, i.e. the number of original texts entailing each node.

We note that while the task of merging fragment graphs is novel, it can be approached, at least naively, using existing textual entailment engines (see Section 2.1.1) and global optimization algorithms (see Berant et al. (2012) in Section 2.2). In Section 4, we provide a baseline for this task based on these available technologies, while suggesting that obtaining improved results is an interesting task for the future research.
3.3 Dataset
In this section, we describe the first gold-standard dataset of TEGs, which we constructed in order to introduce the task of automatic TEG generation to the community, as well as to ascertain that textual fragments indeed can be practically organized into a TEG structure.Footnote 3 We note that the dataset was designed with text exploration in mind and is further used in Section 5 to assess the usefulness of TEGs for this setting, thus input textual fragments were extracted targeting our motivating scenario of analyzing customer dissatisfaction.
The dataset was constructed for a text collection of 244 English emails sent by customers of a railway company. Textual fragments were manually extracted in such a way that each fragment contains a single proposition where a customer states a reason for dissatisfaction with the company, like illustrated by the example in Section 3.1.1. To reduce the annotation complexity, as well as to allow evaluation of TEG generation for particular subtopics (clusters) of the target collection, fragments were manually clustered into 29 subtopics such as ‘legroom’, ‘internet’, ‘food choice’, as suggested in Section 3.2.2. Then, given the textual fragments within each cluster as input, a TEG was built for each of the clusters as follows:
Construction of fragment graphs. To construct the fragment graphs of the input textual fragments, modifiers were manually specified and fragment graphs were then created using the automatic procedure described in Section 3.2.1. For each cluster, the dataset provides the set of input textual fragments, their annotated modifiers, and the corresponding resulting fragment graphs.
Merging fragment graphs into integrated TEGs. The fragment graphs within each cluster were manually merged by annotators experienced in the field of textual entailment. During the annotation process, transitivity control was performed in order to detect violations and resolve them. As a result, the dataset contains 29 consistent TEGs.
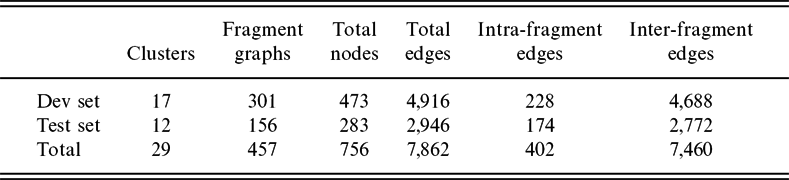
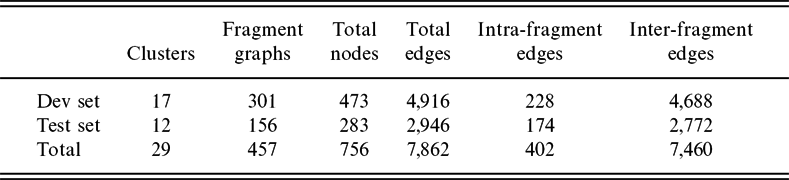
Table 1 presents statistics about the gold-standard dataset for the modifiers’ annotation task, whereas Table 2 presents statistics describing the TEG dataset, which was divided into development and test sets for evaluation purposes (see Section 4.2).Footnote 4 In Table 2, intra-fragment edges denote edges connecting the nodes within fragment graphs, i.e. edges generated during fragment graph construction. Inter-fragment edges are edges generated during the merge phase. Transitive closure edges are included.
Statistics describing the modifiers’ annotation dataset

Statistics describing the TEG dataset
Inter-annotator agreement between two coders was calculated for both phases of TEG creation. Agreement on modifiers’ annotation was carried out on 130 fragments and the metric used was F-measure calculated by treating one annotator as gold-standard and the other as predictions. If we consider as agreement only exact matches of the modifiers’ spans (perfect overlap), the resulting F1 value is 0.85. If we compute F1 on the single tokens composing the modifiers (partial overlap), then F1 increases to 0.91.
Agreement on fragment graphs’ merging was calculated for a subset of 2,500 entailment decisions over pairs of nodes from different fragment graphs. The metric used was the kappa coefficient (Cohen, Reference Cohen1960), which is computed as P(A) − P(E)/1 − P(E), where P(A) is the observed agreement, i.e. the proportion of items on which the two annotators agree, and P(E) is the estimated agreement due to chance, calculated empirically on the basis of the observed distributions of judgments by the two coders. The resulting kappa value is 0.74, corresponding to a substantial agreement (Landis and Koch, Reference Landis and Koch1977).
4 Evaluation of automatic TEG construction
Evaluation of TEGs automatically constructed over a given set of textual fragments is not a trivial issue. Starting from the same set of fragments, different automatic approaches would extract different subfragments and thus build different fragment graphs, resulting in TEGs over unequal sets of nodes and thus making comparison of such TEGs to a gold-standard TEG a difficult task.
Moreover, the resulting TEGs would include two different types of errors: (1) identifying wrong subfragments in the process of fragment graph generation, and (2) incorrectly recognizing textual entailment between the given texts during the merge phase. It remains an open question whether a unified measure for combining the two together can and should be defined.
Given the above, we suggest evaluating automatic TEG construction by separately evaluating its two subtasks, namely fragment graph construction and fragment graph merging. Below we discuss the evaluation methodology for each of the tasks. As explained in Section 3.2, the task of fragment graph construction is a novel task and there is no available technology for its full automation, while the task of fragment graph merging can be addressed, at least initially, based on available TE engines. Accordingly, we supplement the evaluation methodology for this task with actual evaluations of baseline off-the-shelf approaches.
An alternative approach to evaluating fully automatic TEGs would be to perform application-oriented evaluations, as soon as TEGs are constructed to assist in a specific application scenario. In this case, the actual utility of TEGs would be measured examining the effect of their employment within a specific application, instead of directly assessing their correctness intrinsically. Further, in Section 5 we present a small-scale user study aimed at illustrating the potential utility of TEG representation for exploration purposes.
4.1 Evaluation of fragment graph construction
For this task the input is a set of textual fragments, for each of which a fragment graph should be constructed. For evaluation, the output fragment graphs should be compared with gold-standard fragment graphs constructed for the same textual fragments.
We suggest evaluating the resulting fragment graphs in terms of Recall, Precision and F1 over the detected subfragments as compared to subfragments in the gold-standard fragment graphs. The evaluation would thus be agnostic to the concrete methodology of subfragment generation. Automatic methods can output confidence scores for detected subfragments, expressing the confidence of the algorithm that a specific subfragment is valid. In this case, a Recall-Precision tradeoff can be controlled by setting a threshold for these confidence values. To obtain a single-figure measure of quality across recall levels Mean Average Precision (MAP) can be calculated over lists of evaluated subfragments ranked in descending order by their confidence score.
Alternatively, when following the methodology we suggested in Section 3.2.1, fragment graphs can be evaluated in terms of Recall, Precision and F1 over the detected grammatical modifiers. A Recall-Precision tradeoff can be controlled and MAP measure can be calculated similarly to the subfragment evaluation explained above.
The evaluation measures can be calculated separately for each fragment graph and further averaged (macro-averaging) or can be calculated over the set of all subfragments or modifiers across the fragment graphs (micro-averaging). Macro-averaging assigns equal importance to fragment graphs of different sizes, while in micro-averaging larger fragment graphs have more influence on the performance assessment.
4.2 Evaluation of fragment graph merging
For the evaluation of this task, gold-standard fragment graphs should be provided as input and further merged into a single TEG following an automatic merging procedure. Then, the resulting TEG should be compared with a gold-standard TEG obtained by merging the same input fragment graphs.
We suggest evaluating the resulting merged TEG in terms of Recall, Precision and F1 over the directed graph edges, while excluding intra-fragment edges from the evaluation, since they are given as input.
We note that a merging procedure might not only connect nodes with edges, but also supplement the edges with scores expressing the confidence of the algorithm when adding the corresponding edge to the graph. In this case, a Recall-Precision tradeoff can be controlled by setting a threshold for these confidence values. To obtain a single-figure measure of quality across recall levels Mean Average Precision can be calculated over lists of evaluated edges ranked in descending order by their confidence score.
In addition, TEGs can be evaluated in terms of Accuracy of pairwise entailment decisions, i.e. the proportion of correct decisions among all the decisions made by an algorithm. Decisions in our case include both positive (edge) and negative (no edge) decisions.
We note that when separate TEGs are generated for different subtopics (clusters) of the domain, like in our dataset in Section 3.3, the evaluation measures can be calculated separately for each cluster and further averaged (macro-averaging), or can be calculated over the set of all edges or decisions across the clusters (micro-averaging). Macro-averaging assigns equal importance to TEGs of different sizes, while in micro-averaging larger TEGs have more influence on the performance assessment.
4.2.1 Merging fragment graphs with automatic TE engines
As explained above, it is natural to apply textual entailment engines, which produce pairwise entailment decisions, for fragment graph merging. Below we provide several baselines for this task by evaluating off-the-shelf TE engines. We use two open-source engines, TIE and BIUTEE (see Section 2.1.1), both supplied with the WordNet and VerbOcean resources and trained on the development part of our TEG dataset (Section 3.3). To construct the training set, we used all the inter-fragment edges in the development set as positive (entailing) examples, and a similar amount of randomly selected node pairs for which there was no edge in the dataset as negative (non-entailing) examples. Such ‘balanced’ training set construction showed better results than using all available positive (edge) and negative (no edge) examples in our preliminary experiments over the development set.
Following the evaluation methodology described above, we use gold-standard fragment graphs from our dataset as input and apply the entailment engines to construct a separate TEG for each of the clusters in the test part of the dataset. As suggested above, we exclude intra-fragment edges from all the evaluations. In addition, we exclude redundant edges present in the dataset due to the fact that different fragment graphs sometimes have nodes with exactly the same text.
In order to construct entailment graphs, we apply the TE engines according to the following procedures described in Section 3.2.2:
• All-pairs procedure, where pairwise comparisons are performed for all possible pairs of nodes.
• Structure-based procedure, where minimal subfragments of the fragment graphs are first compared, and upper-level nodes are further compared depending on the obtained decision.
We note that, as explained in Section 3.2.2, the Structure-based procedure produces a consistent transitive graph, while the All-pairs procedure only records the pairwise entailment decisions and is not forced to consider the dependences among these individual judgements.
In both methods, beyond considering the positive (edge) or negative (no edge) classification output of the TE engines, we also record the classification score produced by the engine for each edge. In addition, for edges added through transitivity in our Structure-based procedure, we assign the minimal score within the corresponding transitivity chain.
We evaluate two types of resulting graphs:
• Local denote the graphs produced based on pairwise (local) entailment decisions as a result of a merging procedure, either All-pairs or Structure-based.
• Global denote local graphs, which were further globally optimized using the procedure of Berant et al. (2012), while using edge scores assigned as above as initial classification scores for the Integer Linear Program.
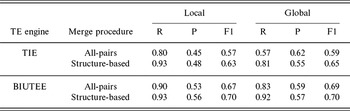
Table 3 shows micro-averaged Recall, Precision and F1 of the evaluated graphs. In the table, we report the values obtained for confidence thresholds tuned over the development set, namely θ = 0.5 for TIE and θ = 0.95 for BIUTEE. We can see that local graphs produced by means of the Structure-based merging procedure outperform both local and global graphs produced via the All-pairs procedure in terms of F1. This result is statistically significant with p < 0.05 according to McNemar’s test (McNemar, Reference McNemar1947). We thus conclude that our suggested Structure-based merging procedure is applicable for automatic TE engines, despite of the fact that their pairwise decisions are not always correct.
Evaluation results of TE engines for merging fragment graphs in terms of micro-averaged Recall (R), Precision (P) and F1

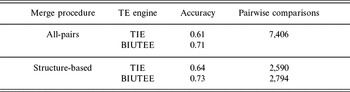
Similar behaviors can be seen in Table 4, which evaluates the local graphs in terms of Accuracy. The table also shows that the Structure-based merging procedure indeed considerably reduces the number of pairwise comparisons required to construct the TEGs.
Evaluation of local merging procedures in terms of accuracy (micro-averaged) and the number of pairwise comparisons made by TE engines

From Table 3, we also see that global optimization increased the precision of the corresponding local graphs, yielding improved F1 values in most of the cases. The difference in performance between the local and global graphs is statistically significant (McNemar’s test, p < 0.05).
Our evaluation results thus suggest that enforcing transitivity, either via our structure-based merging procedure or via optimization techniques, overall improves the results. This confirms the validity for TEGs of the main conclusion of Berant et al. (2012) that enforcing transitivity can improve individual pairwise decisions.
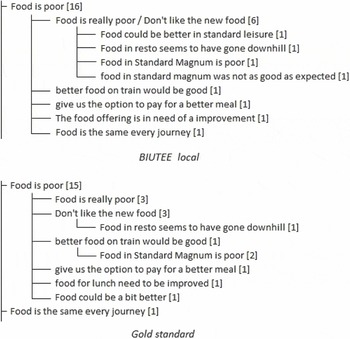
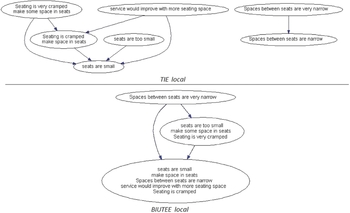
In Figures 7 and 8, we present examples of resulting graphs for two randomly selected clusters. Since the size of the graphs in Figure 7 does not allow for their effective visualization, we present them as hierarchical structures, as suggested in Section 2.2.
Example of BIUTEE local TEG automatically created via the Structure-based merging as compared to the gold-standard TEG of a randomly selected cluster. The graphs are organized as hierarchies and some subtrees are pruned for easier comparison. Representative texts from each node are used as node labels. The ‘Food is really poor/Don’t like the new food’ label means that the corresponding node mixes texts from two different gold-standard nodes. The numbers at the nodes mean that the corresponding node is a clique of X texts.

Example of TIE local and BIUTEE local TEGs automatically created via the Structure-based merging for a randomly selected cluster. The nodes with multiple textual fragments represent cliques.

5 Textual entailment graphs for text exploration
In this section, we demonstrate the usefulness of TEGs to facilitate text exploration, which was our motivating scenario. Further, in Section 6, we mention other settings that could potentially benefit from using TEGs.
Exploration of the contents of a target set of texts introduces the following needs and aspirations: (1) quickly identify the important pieces of information in the set, (2) generalize and/or delve into the information, and (3) analyze the prominence of different information pieces. Our motivating intuition was that organizing texts into a traversable structure would allow us to achieve the aforesaid objectives. As explained above, the entailment relation can be viewed as a relation from specific to general meanings, therefore we suggest that entailment is a natural framework for such hierarchical organization of information.
As soon as a TEG of a target text collection is constructed, it can be used to assist text exploration by providing the following main capabilities:
Generalization. One of the important features of textual entailment is the ability to generalize information. For example, in Figure 6 we see that utilizing entailment as described above in Section 3.2 allowed to recognize that many customers are not happy with the catering, though each of them expressed his/her dissatisfaction with different words.
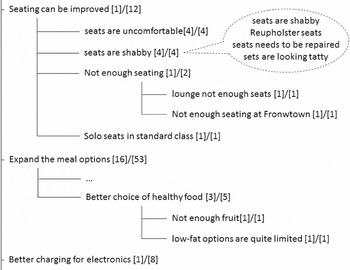
Browsing and drill-down. Already in Figure 6, one can see that TEGs provide browsing and drill-down capability, enabling an analyst to easily explore the information at the desired level of granularity. As mentioned in Section 2.2, entailment graph becomes a DAG as soon as its mutually entailing nodes (cliques) are merged into single nodes, and thus the graph can be presented in a traditional hierarchical structure, as shown earlier in Figure 7. The most general nodes in the graph, not entailing any other texts, become the roots of the hierarchy. More specific texts, which entail a given node, are placed under this parent node. If a node entails more than one parent, the corresponding subtree can be placed under each of the parents, e.g. a node ‘Provide more child-friendly meals’ with all of its sub-nodes can be placed under the node ‘Expand the meal options’, as well as under the node ‘Improve the experience of traveling with kids’. The entries can be sorted by prominence to allow easier detection of the most interesting information pieces and to simplify quantitative analysis. Another example of such hierarchy is presented in Figure 9. Here an analyst will quickly define that customers complain about insufficient food selection, seating, and charging for electronics. A more fine-grained analysis is readily provided to detect that, for example, almost 10% of customers dissatisfied with meal options would like healthier food to be available, in particular fruits and low-fat meals.
Quantitative analysis.Figure 9 illustrates how simple quantitative analysis can be with entailment graphs. The figure shows that 12 customers are not happy with the seating and that 4 of them complain on seating being uncomfortable, another 4 would like the seats renovated, and 1 requests solo seats in standard class.
Querying the graph. Any relevant metadata as well as quantitative data can be stored at the nodes of the graph and obtained on-the-fly during the exploration process.
Excerpt from a TEG organized as a hierarchy. The numbers [X]/[Y] at the nodes mean that the corresponding node is a clique of X paraphrasing nodes and its subtree contains (sub)fragments from Y different original texts. The dotted callout lists the 4 elements of the clique merged into the node ‘seats are shabby’.

In order to illustrate the potential utility of TEG representation for exploration purposes we conducted a small-scale user study, simulating the work of an analyst. In this study, participants were presented with customer complaints from the dataset described above and were asked to identify different dissatisfaction reasons and quantify their prominence. We note that in industrial settings, analysts most commonly employ automatic clustering to group the texts into (sub)topics, and then manually analyze the detailed content of each cluster. Therefore, in our study participants worked in two modes: (1) cluster mode, where they were presented with the contents of a relatively small cluster, and (2) TEG mode, where they analyzed the same texts organized in a TEG. At the end, participants were asked to compare their experiences with the two modes.
We used 3 gold-standard clusters of 33, 35, and 46 text fragments in each, and presented them to 43 participants. The clusters were randomly selected among clusters with less than 50 fragments from the dataset presented in Section 3.3. We limited the number of the fragments to make the work in the cluster mode more feasible for the participants. Each participant worked with a single cluster in both modes, thus on average 14 participants performed the tasks of the study over each cluster.
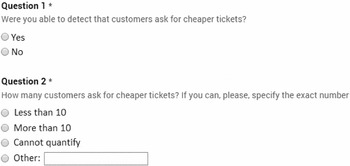
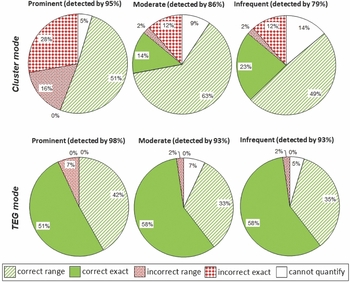
An example of user study questions is given in Figure 10, where Question 1 aims at verifying if participants were able to identify different dissatisfaction reasons, and Question 2 aims at verifying if they were able to quantify their prominence. As for prominence, we distinguish between 3 types of dissatisfaction reasons: prominent reasons (expressed by more than 25% of the customers), reasons of moderate prominence (expressed by 10%–15% of customers), and infrequent reasons (expressed by 1–2 customers).
Example of the user study questions.

The performance of the participants is summarized in Figure 11. The caption of each chart shows how many participants succeeded in identifying the reasons of the corresponding type (Question 1 in Figure 10). The charts show how well participants managed to quantify the prominence of each reason type in each of the two modes. In order to express their assessment of prominence, the participants could choose one of the two options: specify a range of values (less than X, more than X) or provide an exact number (Question 2 in Figure 10). In Figure 11, the parts of the charts refer to these options as ‘range’ and ‘exact’, and show whether the assessment of the participant was ‘correct’ or ‘incorrect’. The ‘range’ assessments were judged as correct if the gold-standard prominence value indeed belonged to the specified interval. In addition, participants could report inability to provide an assessment, corresponding to ‘cannot quantify’ chart parts.
Performance of the participants for accomplishing text exploration tasks.

We can see that overall TEG mode allowed participants to better identify different dissatisfaction reasons, especially those of moderate and low prominence, as well as to provide much more exact prominence assessments. In particular, we see that in TEG mode participants produced much less incorrect assessments and more often felt confident enough to provide an exact number rather than a range.
When comparing their experiences with cluster mode versus TEG mode, most of the participants reported that TEG helped them in detecting different dissatisfaction reasons (91% of participants), showed them reasons which they did not identify in the cluster mode (63%), helped in detecting most prominent reasons (91%) and in ‘hearing every customer’ even if their dissatisfaction reason is not frequent (84%), allowed faster orientation in the texts (100%), enabled better quantitative analysis (95%), and is overall comfortable for analysis and exploration (98%). Thus, we conclude that TEGs indeed have high potential in facilitating text exploration tasks.
6 Conclusions
In this paper, we suggested a novel type of graphs for NLP, namely TEGs, and described a complete methodology for their construction. We presented a dataset for this task and evaluated relevant off-the-shelf technology.
We demonstrated the potential of TEGs for text exploration, and we suggest that additional NLP applications can benefit from using TEGs. As suggested by the results in Section 4.2, organizing texts into an entailment graph improves entailment decisions between them. Thus, applications that currently use entailment engines in a pairwise manner can benefit from constructing TEGs. For example, multi-document summarization could benefit from organizing the original sentences in a graph structure to better detect redundant texts, as well as to produce shorter information pieces. Question answering could benefit from constructing entailment graphs over answer candidates in order to select the most prominent and focused answer. Search engines could construct TEGs to organize snippets, etc.
We thus suggest that TEGs can have different usages and that automatic creation of such graphs is an interesting task for the NLP community.
Acknowledgments
This work has been supported by the European Community’s Seventh Framework Programme (FP7/2007-2013) under grant agreement no. 287923 (EXCITEMENT). We would like to thank Octavian Popescu, Kathrin Eichler, Tae-Gil Noh, Meni Adler and all the colleagues and industrial partners within the EXCITEMENT project for fruitful discussions, joint work on preparing the dataset and establishing the code infrastructure used in this research. Finally, we thank the anonymous reviewers for their useful comments and suggestions.