Introduction
Imaging genetics, also referred to as neuroimaging genetics/genomics or genetic neuroimaging/imaging, is a specialized field of research that combines neuroimaging and genetic (genomic) data to improve the prediction of behavior. Nearly 30 years ago, imaging genetics emerged as an experimental strategy for exploring the genetic effect on brain structure and function, particularly as these components are involved in developmental psychopathology (Viding et al., Reference Viding, Williamson and Hariri2006; Wassink et al., Reference Wassink, Nelson, Crowe and Andreasen1999). Broadly, the goal of imaging genetic models is to find associations between genetic and brain imaging measurements, with the assumption that both are linked to a behavioral phenotype of interest. Studies using these models commonly employ clinical diagnoses to determine participants’ disease/disorder status. These clinical diagnoses are often used to form case-control samples, and genetic and brain imaging indicators of case and control participants are then directly juxtaposed. Rapid progress in molecular genetics and human neuroimaging techniques has provided new opportunities for exploring individual differences in complex cognitive and socio-emotional traits, as well as their potential links to neurodevelopmental disorders. Now, imaging genetics is a vibrant field of research that capitalizes on this progress and combines genetic analytics with brain imaging methods to investigate the complex interactions between the genome and brain structure and function (Bigos & Weinberger, Reference Bigos and Weinberger2010).
A brief overview of the trajectory of imaging genetics
The trajectory of imaging genetics as a field of science, as that of any field, indicates increased sophistication of tools, analytics, and models. Early studies are exemplified by association analyses between brain morphology (see Box 1) and single nucleotide polymorphisms (SNP, see Box 2) whose function was well characterized. These are referred to as classical imaging genetics approaches or reverse (from gene to phenotype, where a gene-of-interest is characterized through its impact on brain structure and/or function) genetics (Nickl-Jockschat & Wassink, Reference Nickl-Jockschat and Wassink2021). Reverse genetics typically involves the inclusion of two or more distinct groups of participants (e.g., patient cohort and healthy participants) and the corresponding between-group comparison of neuroimaging data based on their clinical status and genotypes. Among the most fashionable polymorphisms in the late 1990s and early 2000s were the Val158Met SNP of the catechol-O-methyltransferase COMT gene (Cerasa et al., Reference Cerasa, Gioia, Labate, Liguori, Lanza and Quattrone2008; Egan et al., Reference Egan, Goldberg, Kolachana, Callicott, Mazzanti, Straub, Goldman and Weinberger2001; Landi et al., Reference Landi, Frost, Mencl, Preston, Jacobsen, Lee, Yrigollen, Pugh and Grigorenko2013), the Val66Met SNP of brain-derived neurotrophic factor, BDNF, gene (Egan et al., Reference Egan, Kojima, Callicott, Goldberg, Kolachana, Bertolino, Zaitsev, Gold, Goldman, Dean, Lu and Weinberger2003; Harrisberger et al., Reference Harrisberger, Spalek, Smieskova, Schmidt, Coynel, Milnik, Fastenrath, Freytag, Gschwind, Walter, Vogel, Bendfeldt, de Quervain, Papassotiropoulos and Borgwardt2014; Mandelman & Grigorenko, Reference Mandelman and Grigorenko2012), and the Ser704Cys SNP of disrupted-in-schizophrenia 1, DISC1, gene (Chubb et al., Reference Chubb, Bradshaw, Soares, Porteous and Millar2008; Di Giorgio et al., Reference Di Giorgio, Blasi, Sambataro, Rampino, Papazacharias, Gambi, Romano, Caforio, Rizzo, Latorre, Popolizio, Kolachana, Callicott, Nardini, Weinberger and Bertolino2008; Duff et al., Reference Duff, Macritchie, Moorhead, Lawrie and Blackwood2013) among numerous other genes (e.g., ACAA1, AKT1, APOE, AQP7, ARVCF, BICC1, CACNA1C, CSNK1A1, CSNK1A1L, DAOA, DLG4, DTNBP1, ERBB4, ERK, ESR1, FADS2, FBXW11, FXR1, IGFBP7, ITGA6, LHPP, KTN1, KL, ME1, MAPK10, NEUROG3, NLK, NRG1, NFATC4, OXTR, PLIN1, PLCB2, PPARG, PSMF1, PTPR, RORA, SMAD3, SIRT1, SLC27A1, SLC6A4, SLC6A15, TOMM40, TPH1, VMAT1, WNT2B, WNT5A). Multiple reviews have been written about this stage of imaging genetics (Alex et al., Reference Alex, Buss, Davis, Campos, Donald, Fair, Gaab, Gao, Gilmore, Girault, Grewen, Groenewold, Hankin, Ipser, Kapoor, Kim, Lin, Luo, Norton and Knickmeyer2023; W. Gao et al., Reference Gao, Grewen, Knickmeyer, Qiu, Salzwedel, Lin and Gilmore2019; Hashimoto et al., Reference Hashimoto, Ohi, Yamamori, Yasuda, Fujimoto, Umeda-Yano, Watanabe, Fukunaga and Takeda2015; Jindal et al., Reference Jindal, Chhetri, Ludhiadch, Singh, Peer, Singh, Brar and Munshi2024; Nickl-Jockschat & Wassink, Reference Nickl-Jockschat and Wassink2021). Therefore, the corresponding findings will not be reviewed in detail here. The general conclusion from this period of imaging genetics was that, although seemingly well-justified at conception, numerous in realization, and engaging in interpretation, these studies, in mass, did not generate consistent and convincing findings. As stated in an illustrative example (Nickl-Jockschat & Wassink, Reference Nickl-Jockschat and Wassink2021, p. 418), “…a modulation of DLPFCFootnote 1 activation associated with COMT genotype became one of the most popular hypotheses in imaging genetics, and it was claimed to have been repeatedly replicated by various subsequent studies. A recent coordinate-based meta-analysis capitalized on the comparative wealth of the literature on this subject and tested whether the reported results of COMT-related activation changes indeed spatially converged over a distinct brain region, namely, the DLPFC. However, neither the main contrast pooling over all studies nor multiple sub-analyses with regard to diagnostic status, age, and paradigm yielded significant or even suggestive results (Nickl-Jockschat et al., Reference Nickl-Jockschat, Janouschek, Eickhoff and Eickhoff2015).”
Although with a staggered initiation, the candidate-gene approach was joined by genome-wide association studies (GWAS). These GWAS typically rely on common polymorphisms microarrayed to a chip. To build such a chip, the reliance is made on about nine million SNP that exert variation, as compared to the rest of the DNA nucleotides that do not distinguish individuals (The 1000 Genomes Project Consortium, 2012). Since the human genome is organized in chromosomes and chromosomes are linear continuous structures built from adjacent nucleotides, some of these SNP are organized into haplotypes (i.e., they do not segregate independently but covary with each other); such SNP interdependence was shown to be sufficient to genotype approximately one million SNP to capture the entire variation across an individual genome. Current SNP-based microarrays are affordable and permit the simultaneous genotyping of hundreds of thousands or a couple of millions of SNP. Although the majority of GWAS have been carried out with clinical binary phenotypes, there is a huge body of work engaging continuous phenotypes, such as the volume of a particular brain region, to establish which SNP covary with such a phenotype or such multiple phenotypes across a particular brain area of the whole brain. The central issue for such analyses is that in the multidimensional space of numerous SNP and numerous brain phenotypes, two things are necessary: (1) a rigorous correction for multiple comparisons and (2) large samples. The very first imaging genetics GWAS studies recruited relatively small samples (Glahn et al., Reference Glahn, Winkler, Kochunov, Almasy, Duggirala, Carless, Curran, Olvera, Laird, Smith, Beckmann, Fox and Blangero2010), but it was quickly realized that consortia-based approaches are needed. Once again, multiple reviews cover numerous relevant GWAS (Alex et al., Reference Alex, Buss, Davis, Campos, Donald, Fair, Gaab, Gao, Gilmore, Girault, Grewen, Groenewold, Hankin, Ipser, Kapoor, Kim, Lin, Luo, Norton and Knickmeyer2023; W. Gao et al., Reference Gao, Grewen, Knickmeyer, Qiu, Salzwedel, Lin and Gilmore2019; Hashimoto et al., Reference Hashimoto, Ohi, Yamamori, Yasuda, Fujimoto, Umeda-Yano, Watanabe, Fukunaga and Takeda2015; Nickl-Jockschat & Wassink, Reference Nickl-Jockschat and Wassink2021).
The establishment of the ENIGMA (Enhancing Neuroimaging Genetics through Meta-Analysis) Consortium started the next important stage in the field of imaging genetics (Medland et al., Reference Medland, Grasby, Jahanshad, Painter, Colodro‐Conde, Bralten, Hibar, Lind, Pizzagalli, Thomopoulos, Stein, Franke, Martin and Thompson2022; Thompson et al., Reference Thompson, Stein, Medland, Hibar, Vasquez, Renteria, Toro, Jahanshad, Schumann and Franke2014). The ENIGMA Consortium established the precedence and the procedure for gathering, harmonizing, and combining multiple samples containing neuroimaging and genetic information from multiple sites and triggering multiple collaborations (Thompson et al., Reference Thompson, Jahanshad, Ching, Salminen, Thomopoulos, Bright, Baune, Bertolín, Bralten, Bruin, Bülow, Chen, Chye, Dannlowski, de Kovel, Donohoe, Eyler, Faraone and Favre2020). Now, there are multiple large-scale studies and collaborative platforms (see Box 3) that substantiate adequately statistically-powered imaging genetics studies. To illustrate, the ENIGMA Major Depressive Disorder (MDD) Consortium includes data from 45 MDD study cohorts from 14 countries across six continents (9788 healthy individuals and 4372 individuals with MDD) and attempts to identify structural and functional brain alterations associated with MDD that can be reliably detected and replicated across cohorts worldwide (Schmaal et al., Reference Schmaal, Pozzi, C. Ho, van Velzen, Veer, Opel, Van Someren, Han, Aftanas, Aleman, Baune, Berger, Blanken, Capitão, Couvy-Duchesne, R. Cullen, Dannlowski, Davey, Erwin-Grabner and Veltman2020).
Thus, the technological development of genetic and neuroimaging approaches, the accumulation of data, and the availability of collaborative platforms characterize the present status of imaging genetics. A typical imaging genetic dataset today consists of three parts (Cheek et al., Reference Cheek, Lindner and Grigorenko2024): (a) one or more genetic components (e.g., microarrays of structural polymorphisms of different types), (b) one or more components that capture brain imaging phenotypes (e.g., indicators of functional or structural MRI, EEG, and/or fNIRS recordings), and (c) characteristics of a behavioral trait to be modeled (e.g., behavioral assessments or clinical diagnostic status). The next section briefly describes the imaging and genetic components.
The imaging data in imaging genetics
Whereas Magnetic Resonance Imaging (MRI) has dominated the field of imaging genetics, it is not the only relevant approach. In fact, in developmental studies especially, imaging and physiological techniques that are more robust to movement or more comfortable for participants may help to increase both sample size and data quality. Despite some limitations with spatial resolution, techniques like electroencephalography (EEG) and functional Near Infrared Spectroscopy (fNIRS) have noted benefits over MRI for developmental and atypical populations, like those with Attention Deficit Hyperactivity Disorder, ADHD, or Autism Spectrum Disorder, ASD, due to their cap-based systems. This allows for EEG and fNIRS to collect neural data with more portability, more robustness to movement, less need for a specialized environment, less noise, and, for many participants, less stress than MRI imaging. Here, we provide a brief overview of the non-invasive methods that have most frequently been used in imaging genetics studies of neurodevelopmental disorders and developmental psychopathology research.
Structural Magnetic Resonance Imaging (sMRI) and diffusion MRI (dMRI) are techniques that provide a detailed representation of the brain’s anatomy, allowing researchers to examine the size, shape, and integrity of gray matter (typically using sMRI) and white matter (typically using dMRI) structures with a high spatial resolution (Backhausen et al., Reference Backhausen, Herting, Tamnes and Vetter2022; Koirala et al., Reference Koirala, Kleinman, Perdue, Su, Villa, Grigorenko and Landi2021; Koirala et al., Reference Koirala, Perdue, Su, Grigorenko and Landi2021). In the realm of imaging genetics, sMRI data help uncover how genetic variations are associated with short-term or long-term structural differences like cortical and subcortical morphometric and microstructural changes, offering insights into the neurobiological substrates of behavior and disease susceptibility and the dynamics of brain development and aging. dMRI complements this by characterizing the microstructural organization of white matter pathways, using measures such as fractional anisotropy, mean diffusivity, and neurite density to assess axonal integrity, myelination, and fiber coherence, thereby linking genetic influences on the architecture and connectivity of brain networks. For example, variations in several genes reported as risk factors for ADHD have been shown to be associated with structural changes in various regions of the brain. Specifically, a specific polymorphism in SLC6A3 has been associated with decreased gray matter volume in the left superior occipital region, cuneus, precuneus, and the right angular areas (Fernandez-Jaen et al., Reference Fernandez-Jaen, Lopez-Martin, Albert, Fernandez-Mayoralas, Fernandez-Perrone, de La Pena, Calleja-Perez, Rodriguez, Lopez-Arribas and Munoz-Jareno2015; Onnink et al., Reference Onnink, Franke, van Hulzen, Zwiers, Mostert, Schene, Heslenfeld, Oosterlaan, Hoekstra, Hartman, Vasquez, Kan, Buitelaar and Hoogman2016; Shang et al., Reference Shang, Lin, Tseng and Gau2018). Variations in the COMT gene were associated with lower gray matter volume in the inferior frontal gyrus (IFG), reduced fractional anisotropy, and increased radial diffusivity (both white matter integrity measures) in the right cingulate gyrus (Hong et al., Reference Hong, Zalesky, Park, Yang, Park, Kim, Song, Sohn, Shin, Kim, Cho and Kim2015; Kabukcu Basay et al., Reference Kabukcu Basay, Buber, Basay, Alacam, Ozturk, Suren, Izci Ay, Acikel, Agladıoglu, Erdal, Ercan and Herken2016; Shimada et al., Reference Shimada, Fujisawa, Takiguchi, Naruse, Kosaka, Okazawa and Tomoda2017; Villemonteix et al., Reference Villemonteix, De Brito, Slama, Kavec, Balériaux, Metens, Baijot, Mary, Ramoz, Septier, Gorwood, Peigneux and Massat2015). The DRD4 gene alterations were associated with lower cortical thickness (CT) in the right orbitofrontal/inferior prefrontal, superior frontal, posterior parietal brain sites, and cerebellum (Monuteaux et al., Reference Monuteaux, Seidman, Faraone, Makris, Spencer, Valera, Brown, Bush, Doyle, Hughes, Helliesen, Mick and Biederman2008; Schweren et al., Reference Schweren, Hartman, Heslenfeld, Groenman, Franke, Oosterlaan, Buitelaar and Hoekstra2016; Takeuchi et al., Reference Takeuchi, Tomita, Taki, Kikuchi, Ono, Yu, Sekiguchi, Nouchi, Kotozaki, Nakagawa, Miyauchi, Iizuka, Yokoyama, Shinada, Yamamoto, Hanawa, Araki, Hashizume, Kunitoki and Kawashima2015). The effects of these COMT variations, which are known to affect dopamine levels in the prefrontal cortex (PFC), have also have also been associated with differences in the structure of brain regions involved in executive function and memory (Diamond, Reference Diamond2007; Egan et al., Reference Egan, Goldberg, Kolachana, Callicott, Mazzanti, Straub, Goldman and Weinberger2001; Malhotra et al., Reference Malhotra, Kestler, Mazzanti, Bates, Goldberg and Goldman2002; Simpson et al., Reference Simpson, Morud, Winiger, Biezonski, Zhu, Bach, Malleret, Polan, Ng-Evans, Phillips, Kellendonk and Kandel2014). Moreover, recent studies revealing the link between the heritability of brain structures (Lemvigh et al., Reference Lemvigh, Brouwer, Johansen, Hilker, Pantelis, Glenthoj and Fagerlund2020; Peper et al., Reference Peper, Brouwer, Boomsma, Kahn and Hulshoff Pol2007; Roshchupkin et al., Reference Roshchupkin, Gutman, Vernooij, Jahanshad, Martin, Hofman, McMahon, van der Lee, van Duijn, de Zubicaray, Uitterlinden, Wright, Niessen, Thompson, Ikram and Adams2016; Thompson et al., Reference Thompson, Cannon, Narr, van Erp, Poutanen, Huttunen, Lönnqvist, Standertskjöld-Nordenstam, Kaprio, Khaledy, Dail, Zoumalan and Toga2001) further underscore the importance of considering genetic contributions to neuroanatomical diversity and their implications for understanding neurodevelopmental disorders and developmental psychopathology.
Functional Magnetic Resonance Imaging (fMRI) offers a dynamic perspective on the brain, capturing changes in blood flow related to neural activity in response to cognitive tasks or at rest (Bandettini, Reference Bandettini2012; Khanna et al., Reference Khanna, Altmeyer, Zhuo and Steven2015; Ogawa et al., Reference Ogawa, Lee, Kay and Tank1990). This modality has been pivotal in imaging genetics for elucidating how genetic variations affect brain function. For example, variations in the BDNF gene, which plays a critical role in neuronal survival and plasticity, have been linked to differences in brain activation patterns during cognitive tasks (Dempster et al., Reference Dempster, Toulopoulou, McDonald, Bramon, Walshe, Filbey, Wickham, Sham, Murray and Collier2005; Egan et al., Reference Egan, Kojima, Callicott, Goldberg, Kolachana, Bertolino, Zaitsev, Gold, Goldman, Dean, Lu and Weinberger2003). Moreover, individuals carrying certain alleles of the BDNF gene exhibit altered activation in the hippocampus and PFC, regions critical for learning and memory (Chiang et al., Reference Chiang, Barysheva, Toga, Medland, Hansel, James, McMahon, de Zubicaray, Martin, Wright and Thompson2011; Miranda et al., Reference Miranda, Morici, Zanoni and Bekinschtein2019; Petryshen et al., Reference Petryshen, Sabeti, Aldinger, Fry, Fan, Schaffner, Waggoner, Tahl and Sklar2010). These findings provide insight into the biological mechanisms through which genetic variants influence cognitive processes and risk for psychiatric conditions. Similarly, resting-state fMRI has been used to explore the impact of genetics on functional connectivity, revealing how specific genetic profiles can predict patterns of connectivity across the brain’s networks. For example, the variation in the gene known as a risk factor for ADHD, DRD4, has been associated with impaired local functional connectivity (J. I. Kim et al., Reference Kim, Yoo, Kim, Jeong and Kim2018; Qian et al., Reference Qian, Wang, Liu, Tao, Zhou, Ye, Li, Yang, Cheng, Zhao and Wang2018). The variation in COMT led to decreased functional connectivity between the cerebellum and left DLPFC (Mizuno et al., Reference Mizuno, Jung, Fujisawa, Takiguchi, Shimada, Saito, Kosaka and Tomoda2017), and variations in SLC6A3 were associated with significant hypoactivation in the left dorsal anterior cingulate cortex (ACC), lateral PFC, and cerebellar vermis (Brown et al., Reference Brown, Biederman, Valera, Doyle, Bush, Spencer, Monuteaux, Mick, Whitfield-Gabrieli, Makris, LaViolette, Oscar-Berman, Faraone and Seidman2010).
Electroencephalography (EEG) measures electrical activity in the brain through electrodes placed on the scalp, offering a direct and real-time index of neuronal activity with high temporal resolution (Deroche et al., Reference Deroche, Wolfe, Neumann, Manning, Towler, Alemi, Bien, Koirala, Hanna, Henry and Gracco2023; Gouveris et al., Reference Gouveris, Koirala, Anwar, Ding, Ludwig, Huppertz, Matthias, Groppa and Muthuraman2022; Koirala et al., Reference Koirala, Deroche, Wolfe, Neumann, Bien, Doan, Goldbeck, Muthuraman and Gracco2023). This imaging modality is useful for studying the influence of genetic variations in brain dynamics through the alterations of electrophysiological activity and the impact on subsequent cognitive functions (Schomer & Lopes da Silva, Reference Schomer and Lopes da Silva2017). Previous studies have registered associations between genetic polymorphisms and EEG patterns, such as event-related potentials (ERPs) and oscillatory activity, which reflect cognitive processes like attention, memory, and emotion regulation. For instance, variations in the 5-HTTLPR and COMT genes have been associated with differences in ERP amplitudes in response to emotional stimuli in infants, providing insights into the genetic basis of emotional processing and susceptibility to mood disorders (Grossmann et al., Reference Grossmann, Johnson, Vaish, Hughes, Quinque, Stoneking and Friederici2011; Herrmann et al., Reference Herrmann, Huter, Müller, Mühlberger, Pauli, Reif, Renner, Canli, Fallgatter and Lesch2007). Similarly, ADHD-related risk alleles of TPH2 have been shown to have a distinct neurophysiological parameter (the NoGo-anteriorization, NGA) for prefrontal brain function during cognitive response control using event-related potentials (Baehne et al., Reference Baehne, Ehlis, Plichta, Conzelmann, Pauli, Jacob, Gutknecht, Lesch and Fallgatter2009). In another example, genetic variation in FOXP2, a gene implicated in a complex neuropsychiatric condition including motor apraxia and speech and language difficulties, was associated with sensorimotor integration for vocal pitch regulation with significantly larger evoked potentials (P2) due to left-lateralized increased activity in the superior, middle and inferior frontal gyri (SFG, MFG, IFG), precentral gyrus, ACC, middle temporal gyrus and insula (Zhang et al., Reference Zhang, Zhao, Guo, Jones, Liu and Liu2018).
Functional Near-Infrared Spectroscopy (fNIRS) is a relatively new neuroimaging technique that measures brain activity by detecting changes in blood oxygenation and volume through the scalp (Almajidy et al., Reference Almajidy, Mankodiya, Abtahi and Hofmann2020; Ferrari et al., Reference Ferrari, Giannini, Sideri and Zanette1985). It offers the advantages of being non-invasive, portable, and less sensitive to movement artifacts than fMRI, making it particularly suitable for studying populations that are difficult to image with other modalities, such as infants and children (Alemi et al., Reference Alemi, Wolfe, Neumann, Manning, Towler, Koirala, Gracco and Deroche2023, Reference Alemi, Wolfe, Neumann, Manning, Hanna, Towler, Wilson, Bien, Miller, Schafer, Gemignani, Koirala, Gracco and Deroche2024). Although it has lower spatial resolution than fMRI, its applicability in naturalistic settings and across diverse populations makes it a valuable tool for imaging genetic research. fNIRS has been previously used to explore the relationship between genetic variants and functional brain responses during cognitive and emotional tasks. For example, studies have reported that polymorphisms in genes NPSR1 and COMT can affect frontal lobe activity as measured by fNIRS, connecting genetic factors to executive function and emotional regulation (Guhn et al., Reference Guhn, Domschke, Müller, Dresler, Eff, Kopf, Deckert, Reif and Herrmann2015; Moriguchi & Shinohara, Reference Moriguchi and Shinohara2018). Another study reported that polymorphisms in the SNAP-25 gene are associated with hemodynamic changes in the PFC using fNIRS during methylphenidate treatment in individuals with ADHD, suggesting that the genetic variations could influence individuals’ neurophysiological response to methylphenidate, potentially affecting treatment efficacy and tolerability for ADHD (Öner et al., Reference Öner, Akin, Herken, Erdal, Çiftçi, Ay, Bicer, Öncü, Bozkurt, Münir and Yazgan2011).
The genetic data in imaging genetics
Genetic data used in imaging genetic analyses are typically generated by whole-genome (Kohshour et al., Reference Kohshour, Papiol, Ching and Schulze2022; Sarnowski et al., Reference Sarnowski, Satizabal, DeCarli, Pitsillides, Cupples, Vasan, Wilson, Bis, Fornage, Beiser, DeStefano, Dupuis and Seshadri2018; van der Meer & Kaufmann, Reference van der Meer and Kaufmann2022), whole-exome (Kohshour et al., Reference Kohshour, Papiol, Ching and Schulze2022; Nho et al., Reference Nho, Corneveaux, Kim, Lin, Risacher, Shen, Swaminathan, Ramanan, Liu, Foroud, Inlow, Siniard, Reiman, Aisen, Petersen, Green, Jack, Weiner and Baldwin2013; van der Meer & Kaufmann, Reference van der Meer and Kaufmann2022) or targeted microarray genotyping (Kohannim et al., Reference Kohannim, Hibar, Stein, Jahansha, Hua, Rajagopalan, Toga, Jack, Weiner, de Zubicaray, McMahon, Hansell, Martin, Wright and Thompson2012; Stein et al., Reference Stein, Hua, Lee, Ho, Leow, Toga, Saykin, Shen, Foroud, Pankratz, Huentelman, Craig, Gerber, Allen, Corneveaux, DeChairo, Potkin, Weiner and Thompson2010; Vounou et al., Reference Vounou, Janousova, Wolz, Stein, Thompson, Rueckert and Montana2012) or sequencing (Oh et al., Reference Oh, Han, Kim, Kang, Tae, Han and Ham2024). Imaging studies are not limited to genomics and exploit other omics data: transcriptome (Arnatkeviciute et al., Reference Arnatkeviciute, Fulcher, Bellgrove and Fornito2022, Reference Arnatkeviciute, Markello, Fulcher, Misic and Fornito2023), epigenome (Lancaster et al., Reference Lancaster, Morris and Connelly2018), proteome (Du et al., Reference Du, Zhang, Liu, Wang, Guo and Han2021; Kang & Chung, Reference Kang and Chung2008), and metabolome (Glaab et al., Reference Glaab, Trezzi, Greuel, Jäger, Hodak, Drzezga, Timmermann, Tittgemeyer, Diederich and Eggers2019). Yet, in this review, we focus on the most common approaches in imaging genetics: whole-genome, whole-exome, and targeted microarray genotyping, whole-genome and whole-exome sequencing, polygenic scores, transcriptomics, and methylomics.
Whole Genome Sequencing (WGS) is a comprehensive method that reads an individual’s entire DNA sequence. It involves sequencing the entire genome, including both coding and non-coding regions. With sufficient coverage, WGS provides a detailed view of an individual’s genetic makeup, enabling the detection of variations such as SNP, copy number variations (CNV, such as insertions and deletions of DNA pieces), and structural rearrangements. This approach generates vast amounts of data, requiring significant computational and analytical tools even for data preprocessing steps. Additionally, analysis of repetitive genome regions (tandem and interspersed repeats, duplicated genes, and large families of paralogous genes) is ambiguous, and interpretation of non-coding regions remains challenging, and the cost of WGS can be relatively high compared to other sequencing techniques. One of the main benefits of the WGS approach is the ability to investigate novel rare genome variants, which are believed to be the major source of missing heritability for complex traits (Kosmicki et al., Reference Kosmicki, Churchhouse, Rivas and Neale2016; Wainschtein et al., Reference Wainschtein, Jain, Zheng, Becker, Bi, Brody, Carlson, Correa, Du, Fernandez-Rhodes, Ferrier, Graff, Guo, He, Heard-Costa, Highland, Hirschhorn, Howard-Claudio, Isasi and Visscher2022). Examples of the utilization of WGS in imaging genetics are presented in studies of various clinical phenotypes, such as Alzheimer’s Disease, AD (Nho et al., Reference Nho, Horgusluoglu, Kim, Risacher, Kim, Foroud, Aisen, Petersen, Jack, Shaw, Trojanowski, Weiner, Green, Toga and Saykin2016), Parkinson’s disease, PD (Sarnowski et al., Reference Sarnowski, Satizabal, DeCarli, Pitsillides, Cupples, Vasan, Wilson, Bis, Fornage, Beiser, DeStefano, Dupuis and Seshadri2018), among other diseases and disorders.
Contrary to WGS, Whole Exome Sequencing (WES) focuses on sequencing the protein-coding regions of the genome, known as exons. These regions constitute only about ∼ 1.5% of the entire genome but contain the majority of disease-causing variants (Ross et al., Reference Ross, Dion and Rouleau2020). WES offers a cost-effective alternative to WGS, as it targets the most functionally relevant portions of the genome (Han et al., Reference Han, Han, Kim, Kang, Kang, Kang, Tae, Cho and Ham2020). However, WES may miss variants located outside of the exome, including regulatory regions and non-coding sequences. Additionally, the interpretation of variants identified in exonic regions requires careful consideration of their functional impact. Examples of the utilization of WES in imaging genetics are presented in studies of various clinical phenotypes, such as AD (Nho et al., Reference Nho, Corneveaux, Kim, Lin, Risacher, Shen, Swaminathan, Ramanan, Liu, Foroud, Inlow, Siniard, Reiman, Aisen, Petersen, Green, Jack, Weiner and Baldwin2013) and Major Depressive Disorder, MDD (Y. Zhang et al., Reference Zhang, Li, Wang, Hsu, Deng, Ma, Ni, Zhao, Tian, Sham and Li2020).
Microarray genotyping can involve the simultaneous analysis of thousands to millions of preselected genetic variants (SNP and CNV) across the genome or can focus on a selected set of polymorphisms previously implicated in a particular disorder (Takahashi et al., Reference Takahashi, Seki, Ishiura, Mitsui, Matsukawa, Kishino, Onodera, Aoki, Shimozawa, Murayama, Itoyama, Suzuki, Sobue, Nishizawa, Goto and Tsuji2008). This technique relies on hybridization between DNA samples and probes immobilized on a solid surface. Microarrays are widely used for genome-wide association studies (GWAS) to identify genetic variants associated with complex traits and diseases (Grant & Hakonarson, Reference Grant and Hakonarson2008). They offer a robust, cost-effective, and high-throughput approach for genotyping large cohorts. However, microarrays are limited to detecting known variants represented on the array, making them less suitable for discovering novel genetic variations. Additionally, microarray-based genotyping may have lower resolution compared to sequencing methods, particularly for detecting structural variants and rare alleles. Examples of the utilization of microarrays in imaging genetics are presented in studies of various clinical phenotypes such as schizophrenia, SCHZ (Potkin et al., Reference Potkin, Turner, Fallon, Lakatos, Keator, Guffanti and Macciardi2009) and AD (Kohannim et al., Reference Kohannim, Hibar, Stein, Jahansha, Hua, Rajagopalan, Toga, Jack, Weiner, de Zubicaray, McMahon, Hansell, Martin, Wright and Thompson2012; Ning et al., Reference Ning, Chen, Sun, Hobel, Zhao, Matloff and Toga2018; H. Wang et al., Reference Wang, Nie, Huang, Kim, Nho, Risacher, Saykin and Shen2012), among others.
Polygenic risk scores (PRS) are scoring tools that aggregate the effects of many genetic variants across the genome to estimate an individual’s genetic predisposition to a particular trait or disease (Choi et al., Reference Choi, Mak and O’Reilly2020). Rather than focusing on single genes, PRS capture the cumulative impact of numerous genetic variants, each with small individual effects. These scores are typically calculated by summing the number of risk alleles an individual carries, weighted by their effect sizes determined from genome-wide association studies (GWAS). Examples that use PRS in their imaging genetics studies may explore, generate, or use previously established PRS for clinical phenotypes to find associations with neuroanatomical differences (e.g., Fernandez-Cabello et al., Reference Fernandez-Cabello, Alnæs, van der Meer, Dahl, Holm, Kjelkenes, Maximov, Norbom, Pedersen, Voldsbekk, Andreassen and Westlye2022) or clinical symptoms (e.g., Suresh et al., Reference Suresh, Ray, Duan, Chen, Schoenmacker, Franke, Buitelaar, Sprooten, Arias-Vasquez, Turner and Liu2021).
Transcriptomics refers to the study of all RNA transcripts (the transcriptome) produced by the genome in specific cells or tissues (Yadav et al., Reference Yadav, Tanveer, Malviya and Yadav2018). In neuroimaging genetics, transcriptomic analyses help researchers understand which genes are actively expressed in different brain regions, identify how genetic variants affect gene expression levels (expression quantitative trait loci or eQTLs), and link genetic associations to specific cell types or developmental periods. Often, one identifies regions of the brain that may be “enriched for (specific) genes,” meaning that specific brain areas show higher expression levels of certain genes compared to other regions or to the brain as a whole. This enrichment suggests that these genes may play important functional roles in those specific brain regions. Examples of imaging genetics studies which incorporate transcriptomics often make use of large-scale databases like the Allen Human Brain Atlas, AHBA (e.g.,González-Peñas et al., Reference González-Peñas, Alloza, Brouwer, Díaz-Caneja, Costas, González-Lois, Gallego, de Hoyos, Gurriarán, Andreu-Bernabeu, Romero-García, Fañanas, Bobes, Pinto, Crespo-Facorro, Martorell, Arrojo, Vilella, Guitiérrez-Zotes and Schnac2024; X. Zhang et al., Reference Zhang, Gao, Cao, Niu, Guo, Cui, Yu, Dou, Jiao, Qiu, Su and Lu2023) or sequence directly from tissue (e.g., Hale et al., Reference Hale, Bastarache, Morales, Wellons, Limbrick and Gamazon2021; Jabbi et al., Reference Jabbi, Arasappan, Eickhoff, Strakowski, Nemeroff and Hofmann2020). Related are studies that focus specifically on microRNAs (miRNAs), which are small non-coding RNA molecules that regulate gene expression by binding to messenger RNAs, typically leading to gene silencing (Yadav et al., Reference Yadav, Tanveer, Malviya and Yadav2018). MicroRNA analysis in neuroimaging genetics examines how genetic variants might influence brain structure or function by altering miRNA expression or function, which in turn affects the expression of multiple target genes involved in brain development and function. Examples of imaging transcriptomics studies include Wang et al. (Reference Wang, Li, Kuo, Chou, Lee, Chou, Tseng, Hsu, Lee and Lin2020).
DNA methylation is an epigenetic mechanism that involves the addition of methyl groups to DNA molecules, typically at cytosine bases in CpG dinucleotides. This process can alter gene expression without changing the underlying DNA sequence. DNA methylation studies in neuroimaging genetics research investigate how methylation patterns correlate with brain structure or function, whether genetic variants influence DNA methylation through methylation quantitative trait loci (meQTLs), and how environmental factors might interact with genetic predisposition through methylation changes. Examples of imaging genetics studies that incorporate the methylome into their analyses include studies of major depressive disorder, MDD (Zheng et al., Reference Zheng, Womer, Tang, Guo, Zhang, Tang and Wang2024), neurodevelopmental delays (Hüls et al., Reference Hüls, Wedderburn, Groenewold, Gladish, Jones, Koen, MacIsaac, Lin, Ramadori, Epstein, Donald, Kobor, Zar and Stein2022), and externalizing and internalizing behaviors (Y. Sun et al., Reference Sun, Huang, Wang, Xu, Zhang, Zhou, Zhu and Qian2023).
In summary, since its inception in the early 1990s, imaging genetics has matured into a popular methodological approach that has penetrated psychiatric research, research on neurodevelopmental disorders, and developmental psychopathology. The presence of advanced data acquisition and data analysis techniques coupled with sufficient sample sizes has the potential to yield replicable and meaningful results. This systematic review aims to provide a recent summary of the field for the current decade of research, when studies have had the opportunity to capitalize on advanced methods and large datasets.
Methods
The systematic review is implemented in accordance with the Preferred Reporting Items for Systematic Reviews and Meta-Analysis (PRISMA) guidelines (Page et al., Reference Page, McKenzie, Bossuyt, Boutron, Hoffmann, Mulrow, Shamseer, Tetzlaff, Akl, Brennan, Chou, Glanville, Grimshaw, Hróbjartsson, Lalu, Li, Loder, Mayo-Wilson, McDonald and Moher2021).
Search strategy and eligibility criteria
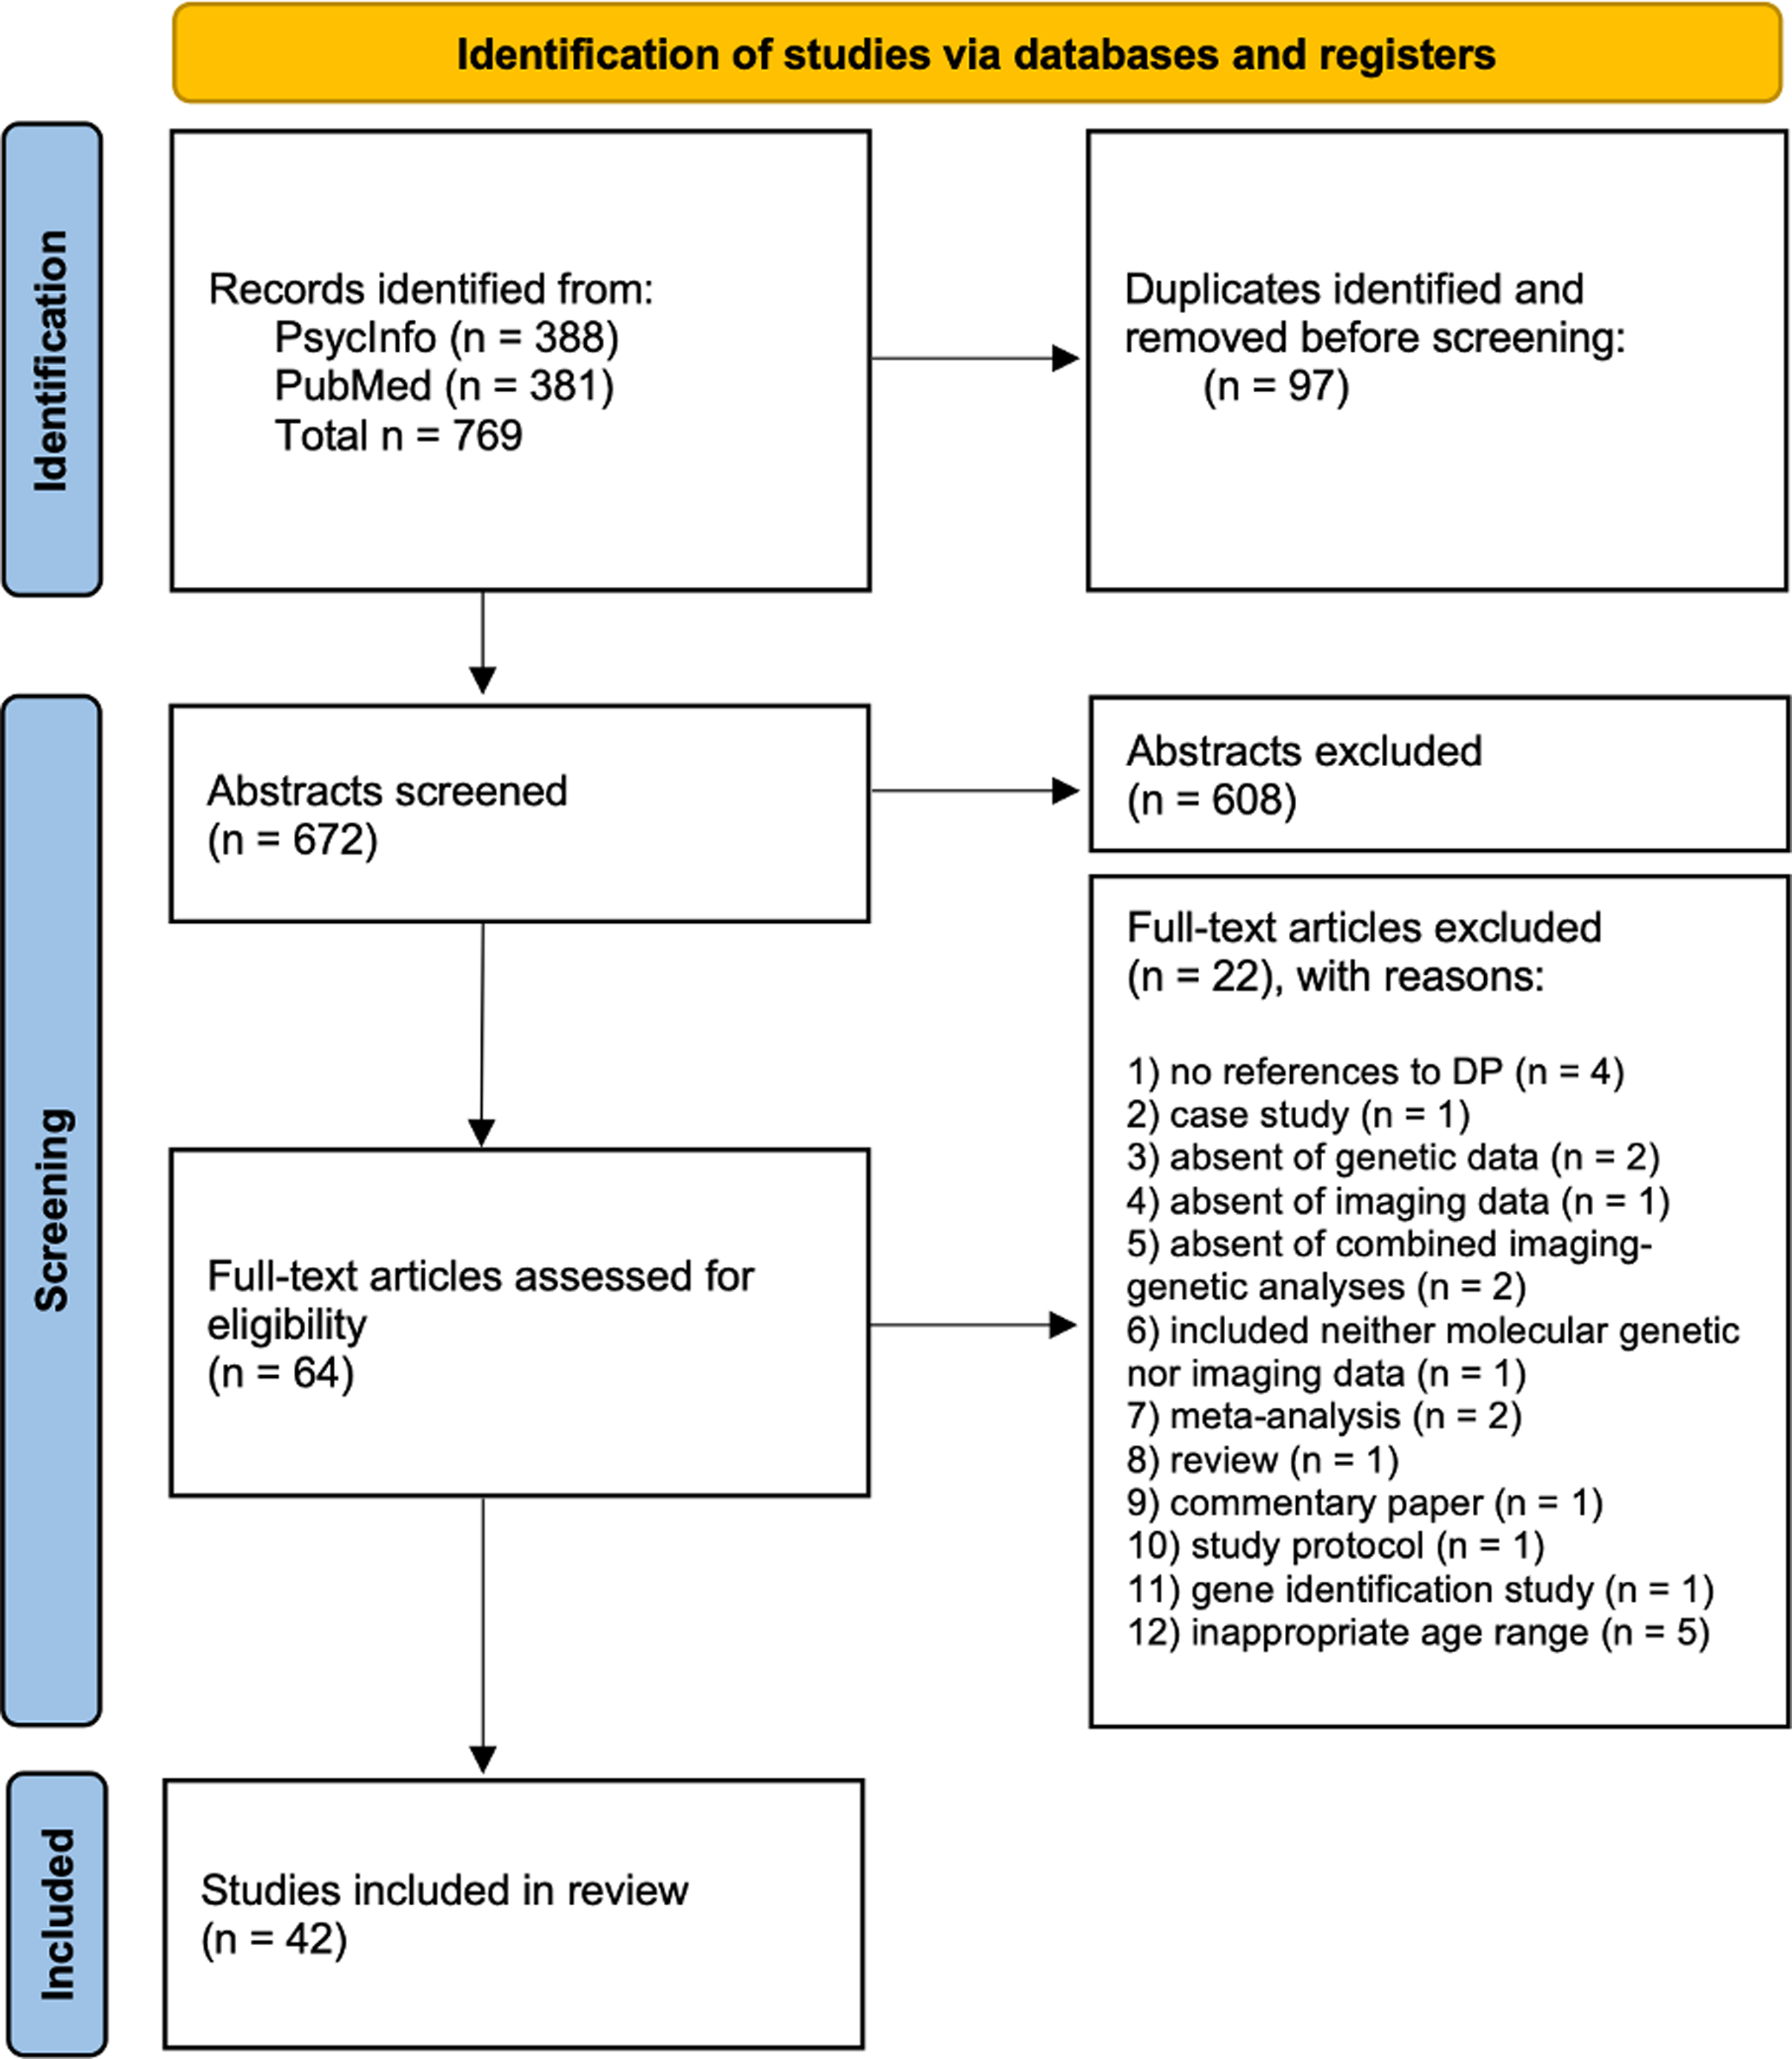
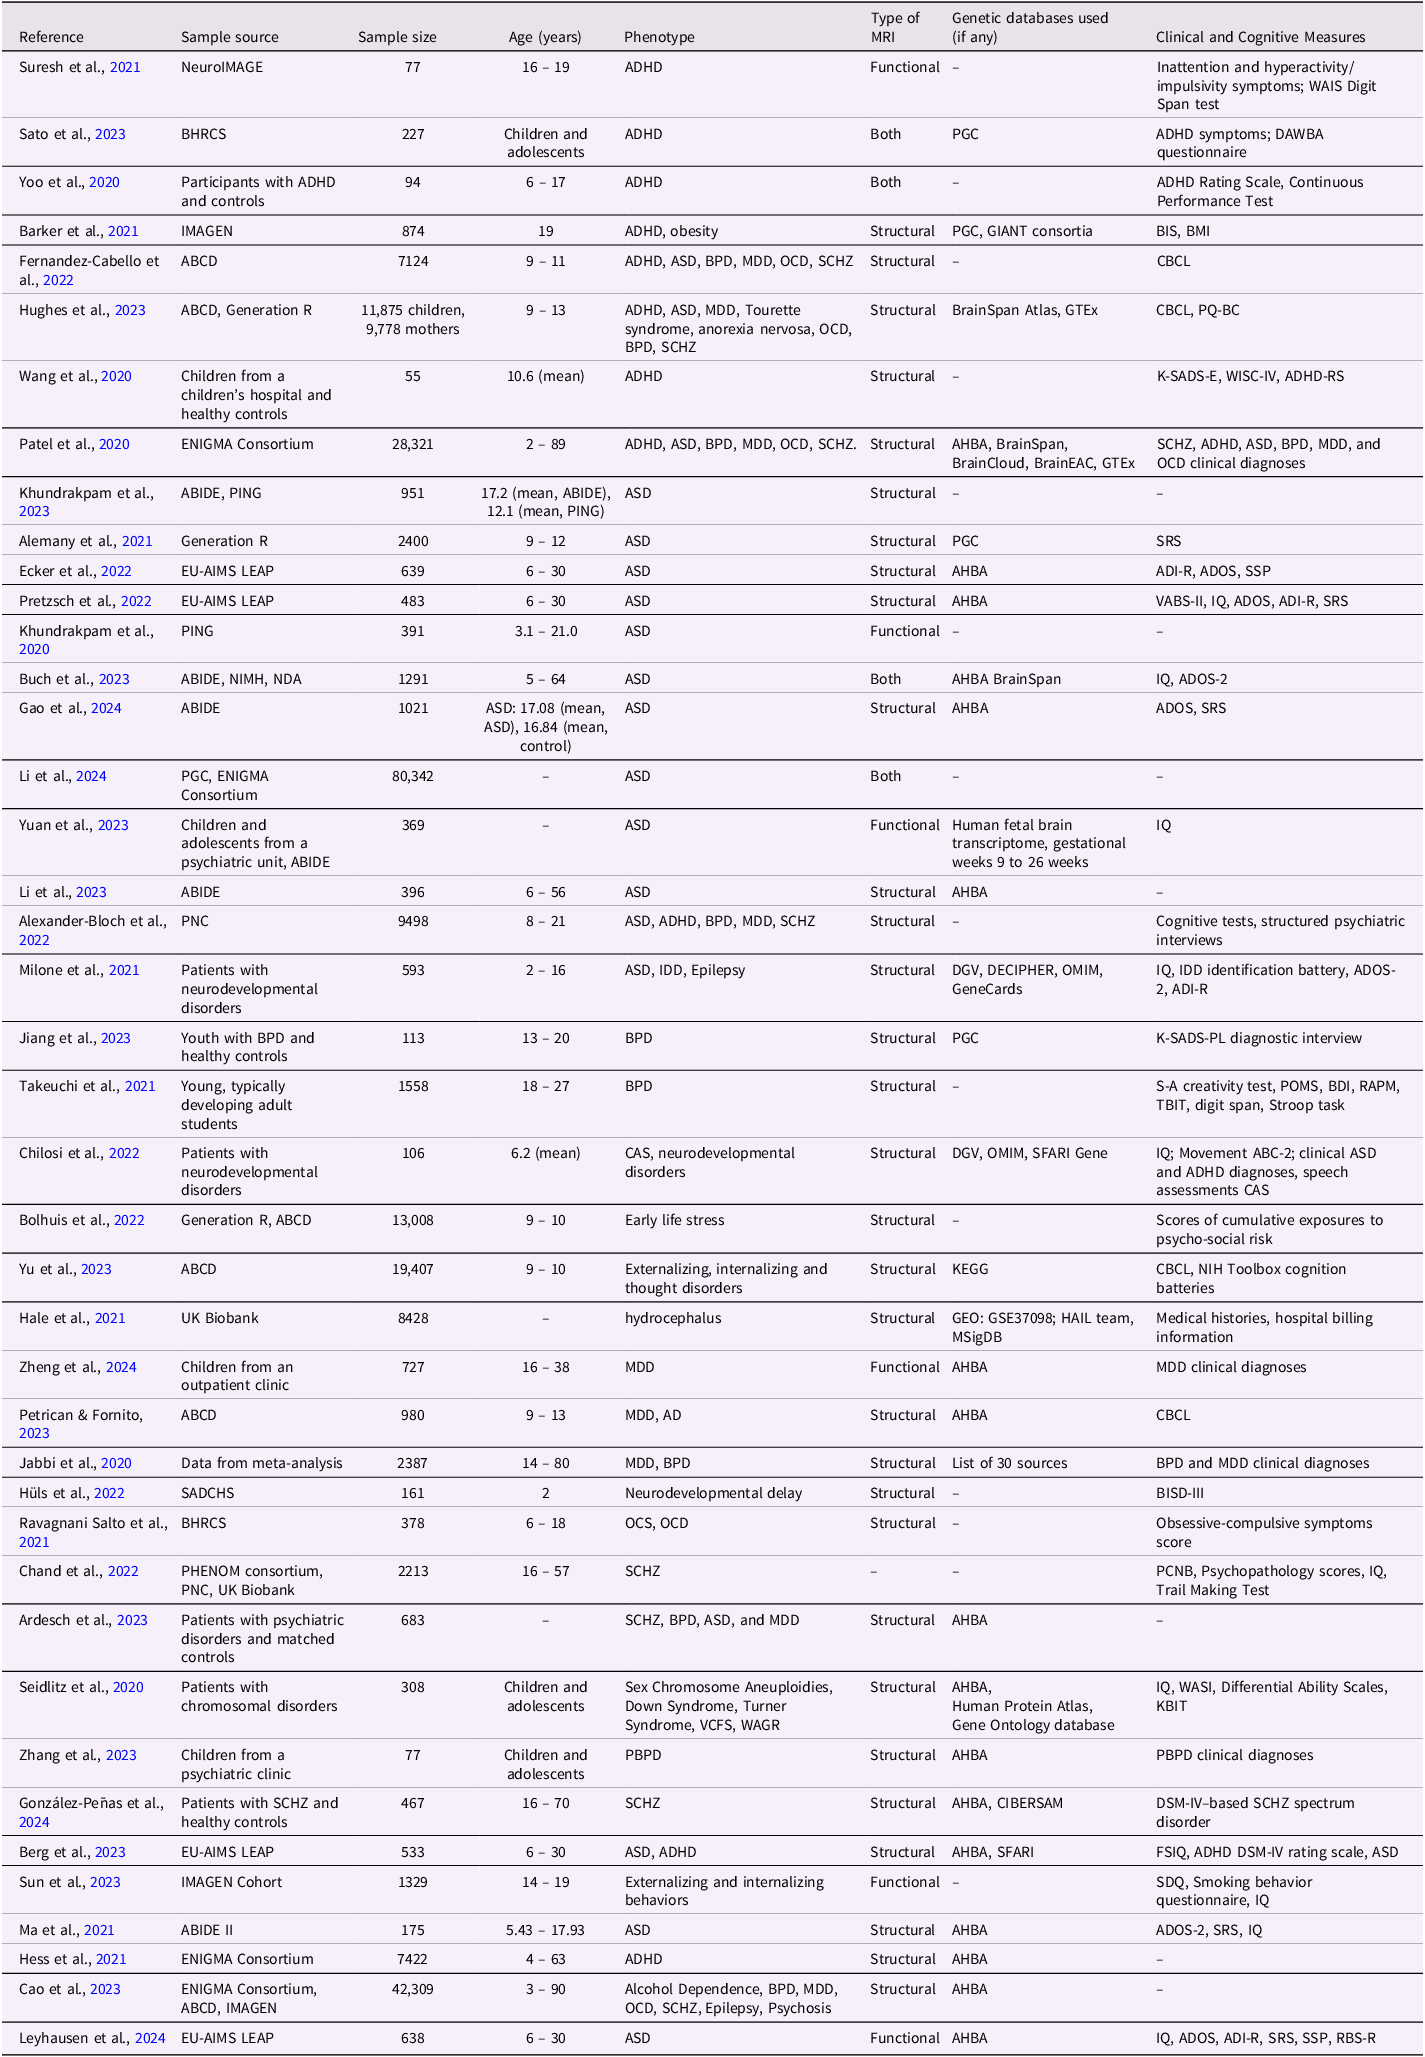
Initial search was conducted through the PubMed/MEDLINE and PsycINFO electronic databases for articles published between January 1, 2020, and April 3, 2024. We restricted our search to find article titles or abstracts that contained the following keywords: (neurodevelopmental OR developmental) AND (disab* OR disorder* OR condition*) AND (genetic* OR genomic* OR genes) AND (neuroimaging OR “brain imaging”)). The search resulted in 381 articles identified from PubMed/MEDLINE and 388 from PsycINFO (Figure 1). All studies were retrieved from online databases and exported to the PICO portal, which is an online literature review platform specifically designed for high-quality research, systematic reviews, and meta-analyses (PICO Portal, 2024). There were 672 articles remaining after removing duplicate articles found between both databases. Abstract screening was performed independently by two investigators (Cheek and Dobrynin), and all disagreements were resolved by discussing each case. As a result, 608 articles were removed from the list based on the following criteria: 1) the paper did not include novel empirical analyses (they were reviews of different types), 2) joint analysis of genetic and neuroimaging indicators was absent, 3) the study covered a different age than the developmental age groups (i.e., children aged 0 – 18), 4) the study did not investigate neurodevelopmental phenotypes, 5) the paper was a clinical case study of a particular genetic syndrome or a disorder, or 6) the paper was constricted to a single gene or genetic region. Many developmental pathologies are characterized by complex, highly polygenic phenotypes (Cross-Disorder Group of the Psychiatric Genomics Consortium, 2013; González-Peñas et al., Reference González-Peñas, Costas, García-Alcón, Penzol, Rodríguez, Rodríguez-Fontenla, Alonso-González, Fernández-Prieto, Carracedo, Arango and Parellada2020; Smeland et al., Reference Smeland, Frei, Dale and Andreassen2020); therefore, a whole-genome rather than single-gene approach was chosen for this review. Abstract screening resulted in 64 papers eligible for a full text review. Four investigators (Cheek, Dobrynin, Khafizova, and Grigorenko) independently conducted a full text review and further excluded 22 articles based on the above criteria. These 22 studies were as follows. Four studies used imaging phenotype as outcomes without references to developmental psychopathology (Chen et al., Reference Chen, Zhang, Wang, Jiang, Cai, Zhao, Zhu and Yu2022; Ge et al., Reference Ge, Wu, Zhang, Chen, Zhang, Kang, Deng, Ou, He, Zhao, Kuo, Ma, Banaschewski, Barker, Bokde, Desrivières, Flor, Grigis, Garavan and Yu2024; Jia et al., Reference Jia, Chu, Liu, van Dongen, Papastergios, Armstrong, Bastin, Carrillo-Roa, den Braber, Harris, Jansen, Liu, Luciano, Ori, Roiz Santiañez, Ruggeri, Sarkisyan, Shin, Sungeun and Desrivières2021; van der Meer et al., Reference van der Meer, Kaufmann, Shadrin, Makowski, Frei, Roelfs, Monereo-Sánchez, Linden, Rokicki, Alnæs, de Leeuw, Thompson, Loughnan, Fan, Westlye, Andreassen and Dale2021), 1 article was a case study (Hiraiwa et al., Reference Hiraiwa, Matsui, Nakayama, Komatsubara, Magara, Kobayashi, Hojo, Kato, Yamamoto and Tohyama2021), 2 studies included only imaging data (Matsumoto et al., Reference Matsumoto, Fukunaga, Miura, Nemoto, Okada, Hashimoto, Morita, Koshiyama, Ohi, Takahashi, Koeda, Yamamori, Fujimoto, Yasuda, Ito, Yamazaki, Hasegawa, Narita, Yokoyama and Hashimoto2023; Roberts et al., Reference Roberts, Wen, Ridgway, Ho, Gooch, Leung, Williams, Breakspear and Mitchell2022), 1 article included only genetic data (Richards et al., Reference Richards, Pardiñas, Frizzati, Tansey, Lynham, Holmans, Legge, Savage, Agartz, Andreassen, Blokland, Corvin, Cosgrove, Degenhardt, Djurovic, Espeseth, Ferraro, Gayer-Anderson, Giegling and Walters2020), 2 publications included both imaging and genetic data, but did not carry out combined imaging genetic analyses (Agarwala et al., Reference Agarwala, Narang, Geetha, Kurwale, Samson, Golani, Mahadevia, Vedam, Murugan, Chatterjee, Goyal and Jain2023; Rahman & Fatema, Reference Rahman and Fatema2021), 1 study included neither molecular genetic nor imaging data (Maes et al., Reference Maes, Lapato, Schmitt, Luciana, Banich, Bjork, Hewitt, Madden, Heath, Barch, Thompson, Iacono and Neale2023), 5 studies recruited participants of inappropriate age range (Fu et al., Reference Fu, Liu, Qin, Xu and Yu2020; Guo et al., Reference Guo, Liu, Li, Zhao, Li, Huang, Wang, Qian, Cao, Wang, Calhoun, Sui and Sun2021; Simões et al., Reference Simões, Vassos, Shergill, McDonald, Toulopoulou, Kalidindi, Kane, Murray, Bramon, Ferreira and Prata2020; X. Sun et al., Reference Sun, Huang, Wang, Xu, Zhang, Zhou, Zhu and Qian2023; Williams et al., Reference Williams, Burgess, Suckling, Lalousis, Batool, Griffiths, Palmer, Karwath, Barsky, Gkoutos, Wood, Barnes, David, Donohoe, Neill, Deakin, Khandaker, Upthegrove, Mondelli and Harrison2022). In addition, there were 2 meta-analysis (Battel et al., Reference Battel, Cunegatto, Viduani, Fisher, Kohrt, Mondelli, Swartz and Kieling2021; Q. Li et al., Reference Li, Xu, Qian, Cai, Zhao, Zhu and Yu2023), 1 review (Nisar & Haris, Reference Nisar and Haris2023), 1 commentary (Morris, Reference Morris2023), 1 study protocol (Sharma et al., Reference Sharma, Vaidya, Iyengar, Zhang, Holla, Purushottam, Chakrabarti, Fernandes, Heron, Hickman, Desrivieres, Kartik, Jacob, Rangaswamy, Bharath, Barker, Orfanos, Ahuja, Murthy and Benegal2020), and 1 gene identification study (Collier et al., Reference Collier, Guissart, Oláhová, Sasorith, Piron-Prunier, Suomi, Zhang, Martinez-Lopez, Leboucq, Bahr, Azzarello-Burri, Reich, Schöls, Polvikoski, Meyer, Larrieu, Schaefer, Alsaif, Alyamani and Taylor2021). All controversial cases were brought up for discussion by the group of 4 researchers (Cheek, Dobrynin, Khafizova, and Grigorenko). As a result of the full-text review, 42 articles were found eligible for data extraction. An abridged description of these articles are found in Table 1, with an expanded description found in Supplementary materials.
PRISMA flow diagram depicting the selection of studies.

Papers referenced in this review

Note. The unabridged version of this table with expanded detail is found in Supplementary Table 1. AHBA = Allen Human Brain Atlas; ASD = Autism Spectrum Disorder; ABCD = Adolescent Brain Cognitive Development; BDI = Beck Depression Inventory; BIS = Barratt Impulsivity Scale; BISD = Bayley Scales of Infant and Toddler Development; BPD = bipolar disorder; CAS = Childhood apraxia of speech; CBCL = Child Behavior Checklist; DAWBA = Development and Well-being Assessment; DCD = Developmental coordination disorder; KBIT = Kaufman Brief Intelligence Test; MDD = Major Depressive Disorder; OCD = Obsessive Compulsive Disorder; OCD = Obsessive Compulsive Symptoms; PBPD = Pediatric bipolar disorder; PCNB = Penn Computerized Neurocognitive Battery; PGC = Psychiatric Genomics Consortium; POMS = Profile of Mood States; PQ-BC = Prodromal Questionnaire-Brief Child; RAPM = Raven’s Advanced Progressive Matrices; RBS-R = Repetitive Behaviors Scale-Revised; SCHZ = Schizophrenia; SDQ = Strengths and Difficulties Questionnaire; SRS = Social Responsiveness Scale; SSP = Short Sensory Profile; TBIT = Tanaka B-type intelligence Test; VABS = Vineland Adaptive Behavior Scale; WAIS = Wechsler Adult Intelligence Scale; WISC = Wechsler Intelligence Scale for Children.
Data extraction
Four researchers independently extracted data using the following list of parameters: Sample source, Sample size, Age ranges, Phenotype, Approach used for genetic component assessment, Source of DNA, Imaging Component, Brain atlas used for mapping MRI, Genetic databases used, Data harmonization techniques applied, Statistical methods/models used, Clinical and Cognitive Measures used, Brain preprocessing approach, Significant gene/gene regions identified, Significant brain regions identified, Significant markers identified.
Results
The selected 42 articles were categorized into three groups based on the developmental ages in which conditions typically develop: (1) birth/early childhood, (2) late childhood or early adolescence, and (3) late adolescence. As the reviewed set is relatively large, only major highlights from the studies are summarized. However, multiple general themes relevant to the state of neuroimaging genetics as a field are considered in the Discussion.
Birth and early childhood onset disorders
Autism spectrum disorders
Our reviewed literature on Autism Spectrum Disorders (ASD) identified consistent structural brain differences, particularly in cortical thickness (CT), surface area (SA), and gray matter volume across frontal, temporal, and cingulate regions. These neuroanatomical variations correlate with both ASD symptom severity and PRS, with notable enrichment for genes involved in synaptic function (e.g., NRXN, SHANK3) and neurodevelopmental processes. Pretzsch et al. (Reference Pretzsch, Schäfer, Lombardo, Warrier, Mann, Bletsch, Chatham, Floris, Tillmann, Yousaf, Jones, Charman, Ambrosino, Bourgeron, Dumas, Loth, Oakley, Buitelaar, Cliquet and Ecker2022) found that baseline neuroanatomical features (CT, SA, and volume) could predict subsequent adaptive outcomes using the EU-AIMS Longitudinal European Autism Project (EU-AIMS LEAPS). Ecker et al. (Reference Ecker, Pretzsch, Bletsch, Mann, Schaefer, Ambrosino, Tillmann, Yousaf, Chiocchetti, Lombardo, Warrier, Bast, Moessnang, Baumeister, Dell’Acqua, Floris, Zabihi, Marquand, Cliquet and Murphy2022) identified between-group differences in core ASD brain regions based on CT indicators in this same cohort, while Berg et al. (Reference Berg, Gurr, Leyhausen, Seelemeyer, Bletsch, Schaefer, Pretzsch, Oakley, Loth, Floris, Buitelaar, Beckmann, Banaschewski, Charman, Jones, Tillmann, Chatham, Bourgeron, Ambrosino and Ecker2023) further found that comorbid ADHD modifies these patterns, with distinct neuroanatomical profiles in the left precentral gyrus and right frontal gyrus enriched for ASD-related genes. X. Li et al. (Reference Li, Jiang, Zhao, Yang, Lu, Zhang, Li and Wang2024) used summary statistics from large GWAS samples, the Psychiatric Genomics Consortium (18,381 ASD cases and 27,969 controls), and the ENIGMA Consortium (33,992 participants) and registered associations between ASD and cortical SA in specific regions. Leyhausen et al. (Reference Leyhausen, Schäfer, Gurr, Berg, Seelemeyer, Pretzsch, Loth, Oakley, Buitelaar, Beckmann, Floris, Charman, Bourgeron, Banaschewski, Jones, Tillmann, Chatham, Murphy, Ecker and Zwiers2024) used the EU-AIMS LEAPS data along with gene expression data from the Allen Human Brain Atlas (AHBA) and found that gray-matter structural connectivity patterns were associated with genes regulating neuronal migration and synaptogenesis.
Functional studies complement these structural findings. Ma et al. (Reference Ma, Yuan, Li, Guo, Zhu, Wang, Liu, Xue, Wang, Liu, Man, Ye, Liu and Wang2021) specifically examined dynamic functional connectivity in an ABIDE subsample (88 ASD vs. 87 controls), identifying disrupted connectivity between the right dorsolateral prefrontal cortex and temporal-occipital regions that correlated with symptom severity. Their transcriptomic analysis linked these functional connectivity patterns to genes involved in synaptic signaling and ion channels, which were also associated with other neuropsychiatric conditions. Y. Li et al. (Reference Li, Zhou, Li, Gu and He2023) similarly identified age-dependent functional changes in prefrontal and cingulate regions using ABIDE and AHBA data, while Buch et al. (Reference Buch, Vértes, Seidlitz, Kim, Grosenick and Liston2023) identified three distinct functional connectivity dimensions that predicted ASD behaviors, each associated with unique molecular pathways.
Genetic investigations highlight both shared and population-specific risk factors. Yuan et al. (Reference Yuan, Wang, Wu, Cheng, Zhang, Zhang, Yu, Zhang, Du, Wang and Qiu2023) identified novel Chinese-specific variants associated with functional temporal lobe abnormalities using a novel cohort of Chinese ASD probands and data from Simons Foundation Autism Research Initiative (SFARI) genetic impact resources. Gao et al. (Reference Gao, Xu, Li, Lu and Wang2024) further characterized this heterogeneity using ABIDE and AHBA and identified overlapping structural-functional markers in frontal and temporal regions linked to synaptic transmission genes.
Imaging genetic studies of ASD samples extended beyond clinical groups. Cao et al. (Reference Cao, Cupertino, Ottino-Gonzalez, Murphy, Pancholi, Juliano, Chaarani, Albaugh, Yuan, Schwab, Stafford, Goudriaan, Hutchison, Li, Luijten, Groefsema, Momenan, Schmaal and Sinha2023) used a large, combined dataset from ENIGMA, ABCD, and IMAGEN to identify shared CT patterns across various neuropsychiatric conditions and found that genes like KCNA2 and KCNS1 showed particularly strong expression during late childhood - a critical period for cortical maturation and psychopathology emergence. These findings align with Khundrakpam et al., (Reference Khundrakpam, Vainik, Gong, Al-Sharif, Bhutani, Kiar, Zeighami, Kirschner, Luo, Dagher and Evans2020, Reference Khundrakpam, Bhutani, Vainik, Gong, Al-Sharif, Dagher, White and Evans2023), who used PING and ABIDE data to show that higher ASD PRS correlated with altered cortical architecture even in non-clinical samples, and Alemany et al. (Reference Alemany, Blok, Jansen, Muetzel and White2021), who reported similar associations between autistic traits and structural brain differences in the Generation R Cohort. The study by Patel et al. (Reference Patel, Parker, Shin, Howard, French, Thomopoulos, Pozzi, Rooij, Buitelaar, Hoogman, Franke, Andreassen, Hibar, Ching, Schmaal, Veltman and Heuvel2020) found that CT differences were positively associated across six neuropsychiatric disorders (ADHD, ASD, Bipolar Disorder (BPD), MDD, Obsessive Compulsive Disorder (OCD), and SCHZ) and linked to cell-type specific gene expression patterns.
Attention deficit hyperactivity disorder
The reviewed studies on ADHD converged on several key themes, including structural and functional brain alterations, genetic risk associations, and their association with symptom trajectories. A finding across multiple studies was the connection between ADHD and reduced gray matter volume in the cingulate gyrus, insula, and temporal and occipital cortices (Suresh et al., Reference Suresh, Ray, Duan, Chen, Schoenmacker, Franke, Buitelaar, Sprooten, Arias-Vasquez, Turner and Liu2021; L.-J. Wang et al., Reference Wang, Li, Kuo, Chou, Lee, Chou, Tseng, Hsu, Lee and Lin2020). These structural differences were often linked to genetic risk, as measured by PRS, and were further associated with symptom severity. For instance, Suresh et al. (Reference Suresh, Ray, Duan, Chen, Schoenmacker, Franke, Buitelaar, Sprooten, Arias-Vasquez, Turner and Liu2021), using data from the NeuroIMAGE cohort, identified specific genes (OSBPL1A, CTNNB1, PRPSAP2, ACADM) and ADHD PRS that predicted inattention symptoms, though the small sample size limited generalizability. Similarly, Wang et al. (Reference Wang, Li, Kuo, Chou, Lee, Chou, Tseng, Hsu, Lee and Lin2020), using a small cohort of 55 children, found evidence of the potential role of microRNAs (e.g., miR-30e-5p) in mediating gray matter volume reductions and ADHD symptoms, suggesting epigenetic mechanisms may contribute to neuroanatomical variability. Hess et al. (Reference Hess, Radonjić, Patak, Glatt and Faraone2021) further examined selective brain region vulnerability in ADHD, finding that variations in cell-type composition and expression of apoptosis, autophagy, and neurodevelopment genes were associated with smaller brain size, with a suspected environmental etiology rather than common genetic risk factors suspected to contribute to these differences. Genetic studies showed both broad and disorder-specific patterns. Alexander-Bloch et al. (Reference Alexander-Bloch, Huguet, Schultz, Huffnagle, Jacquemont, Seidlitz, Saci, Moore, Bethlehem, Mollon, Knowles, Raznahan, Merikangas, Chaiyachati, Raman, Schmitt, Barzilay, Calkins, Shinohara and Glessner2022) analyzed a sample of the Philadelphia Neurodevelopmental Cohort (PNC) and found that CNV PRS were associated with both cognitive deficits and deviations from normative brain development trajectories. Their findings highlighted associations with psychosis-spectrum symptoms, suggesting that genetic risk may manifest differently across psychopathological dimensions. Barker et al. (Reference Barker, Ing, Biondo, Jia, Pingault, Du Rietz, Zhang, Ruggeri, Banaschewski, Hohmann, Bokde, Bromberg, Büchel, Quinlan, Sounga-Barke, Bowling, Desrivières, Flor, Frouin and Schumann2021) identified shared neural substrates (orbitofrontal cortex, amygdala) among participants in the IMAGEN study for ADHD-related impulsivity and obesity, while Sato et al. (Reference Sato, Biazoli, Bueno, Caye, Pan, Santoro, Honorato-Mauer, Salum, Hoexter, Bressan, Jackowski, Miguel, Belangero and Rohde2023) found ADHD PRS predicted functional connectivity patterns that were detectable only at baseline assessments in youth using the Brazilian High-Risk Cohort for Mental Conditions (BHRC). The relationship between genetic risk and brain structure appears to be moderated by developmental stage. Fernandez-Cabello et al. (Reference Fernandez-Cabello, Alnæs, van der Meer, Dahl, Holm, Kjelkenes, Maximov, Norbom, Pedersen, Voldsbekk, Andreassen and Westlye2022) found ADHD PRS showed weaker brain structure associations than educational attainment PRS in children aged 9 – 11, whereas Yoo et al. (Reference Yoo, Kim, Kim and Jeong2020) found that structural features (particularly in the insula, sensory/motor cortex, and inferior frontal cortex) outperformed genetic and functional markers in classifying ADHD among children aged 6 – 17. These findings suggest a developmental progression where neuroanatomical markers may become detectable earlier than clear genetic associations, with structural features potentially serving as more reliable indicators during specific developmental windows.
Methodological differences likely contributed to divergent findings regarding the consistency of ADHD-related biomarkers. Patel et al. (2020) found shared cortical thickness patterns across ADHD and other disorders, emphasizing cross-diagnostic neurobiological processes. The largest studies (e.g., Patel et al., Reference Patel, Parker, Shin, Howard, French, Thomopoulos, Pozzi, Rooij, Buitelaar, Hoogman, Franke, Andreassen, Hibar, Ching, Schmaal, Veltman and Heuvel2020 with n = 28,321) identified broad genetic associations between ADHD and structural brain measures, whereas smaller, hypothesis-driven studies (e.g., Wang et al., Reference Wang, Li, Kuo, Chou, Lee, Chou, Tseng, Hsu, Lee and Lin2020 with n = 55) appeared to provide mechanistic insights but with limited generalizability.
These studies collectively indicate ADHD as a disorder with both unique and shared neurobiological signatures. Fronto-cingulo-insular circuits were consistently implicated across many studies, while diverging findings regarding the stability and specificity of these associations highlight the importance of developmental timing, sample characteristics, and analytical approaches. The partial overlap with other conditions (e.g., obesity in Barker et al., Reference Barker, Ing, Biondo, Jia, Pingault, Du Rietz, Zhang, Ruggeri, Banaschewski, Hohmann, Bokde, Bromberg, Büchel, Quinlan, Sounga-Barke, Bowling, Desrivières, Flor, Frouin and Schumann2021) suggests that future research may benefit from cross-diagnostic studies for common imaging genetic underpinnings of neurodevelopmental disorders.
Chromosomal disorders and developmental delays
Five of the reviewed studies explored the role of genetic, epigenetic, and chromosomal mechanisms in intellectual or neurodevelopmental delays and chromosomal disorders. Despite the relatively small number of studies reviewed, converging evidence implicates structural brain alterations and early-life molecular markers. For instance, Milone et al. (Reference Milone, Cesario, Goldoni, Pasquariello, Fusilli, Giovannetti, Giglio, Novelli, Caputo, Cioni, Mazza, Battaglia, Bernardini and Battini2021) examined a cohort of 593 children with intellectual developmental delay (IDD), ASD, and epilepsy and found a high prevalence of posterior fossa anomalies and pathogenic CNVs, particularly in cases with comorbid brain malformations. This aligns with Seidlitz et al. (Reference Seidlitz, Nadig, Liu, Bethlehem, Vértes, Morgan, Váša, Romero-Garcia, Lalonde, Clasen, Blumenthal, Paquola, Bernhardt, Wagstyl, Polioudakis, de la Torre-Ubieta, Geschwind, Han, Lee and Raznahan2020), who found CNV-induced morphometric changes in brain structure correlated with spatial gene expression patterns, suggesting these dosage-sensitive genes as drivers of neuroanatomic disruptions.
Epigenetic contributions are further emphasized by Hüls et al., (Reference Hüls, Wedderburn, Groenewold, Gladish, Jones, Koen, MacIsaac, Lin, Ramadori, Epstein, Donald, Kobor, Zar and Stein2022), who linked cord blood DNA methylation (DNAm) at loci such as SPTBN4—a gene involved in neuronal cytoskeleton integrity—to severe neurodevelopmental delay in two-year-olds. These epigenetic markers were associated with enlarged caudate volumes, implicating altered subcortical development as a potential mediator. Similarly, Chilosi et al. (Reference Chilosi, Podda, Ricca, Comparini, Franchi, Fiori, Pasquariello, Casalini, Cipriani and Santorelli2022) identified non-causative CNVs in children with childhood apraxia of speech (CAS) and comorbid neurodevelopmental delays, indicating that certain genetic heterogeneity may accompany structural and functional deficits. Hale et al. (Reference Hale, Bastarache, Morales, Wellons, Limbrick and Gamazon2021) adopted a multi-omics approach, combining the exome and transcriptome in their imaging genetic analysis, to explore hydrocephalus and found a decreased expression of MAEL in frontal cortex tissue as a candidate mechanism for white matter loss.
Late childhood or early adolescence onset
Depression/Early life stress
Our reviewed studies on MDD, or depression, highlight consistent structural and molecular abnormalities in brain networks governing emotional regulation, with notable variations tied to developmental timing and genetic risk. Across large-scale cohorts like ENIGMA and ABCD, MDD has been associated with reduced gray matter volume in prefrontal, cingulate, and insular regions, often linked to dysregulated stress-response pathways. For example, Zheng et al. (Reference Zheng, Womer, Tang, Guo, Zhang, Tang and Wang2024) analyzed data from a cohort of 299 MDD patients and found gray matter volume reductions in the anterior cingulate and inferior frontal cortex alongside methylation changes in synaptic genes, suggesting a role for epigenetic dysregulation in structural deficits. Similarly, Jabbi et al. (Reference Jabbi, Arasappan, Eickhoff, Strakowski, Nemeroff and Hofmann2020) meta-analyzed gray matter volume loss in mood disorders, identifying the anterior insula as a hub where structural alterations were associated with hormonal and neurodevelopmental gene expression, implicating potential neuroinflammatory mechanisms in MDD pathology.
Genetic risk studies revealed both convergent and divergent patterns, particularly in how genetic vulnerabilities interact with environmental stressors. Bolhuis et al. (Reference Bolhuis, Mulder, de Mol, Defina, Warrier, White, Tiemeier, Muetzel and Cecil2022) explored gene-environment interactions and found that early life stress (ELS) modulated genetic effects on subcortical volumes across two large developmental cohorts: Generation R and ABCD. While their identified loci did not survive multiple testing corrections, the study revealed that genetic associations on brain structure are dependent on environmental exposure, which potentially alters their phenotypic expression. This complements findings from Petrican and Fornito (Reference Petrican and Fornito2023), where MDD PRS and adversity additively predicted altered functional network development, particularly in attention-related systems. Weaker associations identified in younger cohorts, identified by Fernandez-Cabello et al. (Reference Fernandez-Cabello, Alnæs, van der Meer, Dahl, Holm, Kjelkenes, Maximov, Norbom, Pedersen, Voldsbekk, Andreassen and Westlye2022), suggest age-dependent penetrance of genetic effects. This developmental pattern is further identified by Hughes et al. (Reference Hughes, Kunitoki, Elyounssi, Luo, Bazer, Hopkinson, Dowling, Doyle, Dunn, Eryilmaz, Gilman, Holt, Valera, Smoller, Cecil, Tiemeier, Lee and Roffman2023), who found that a neurodevelopmental PRS of depression risk showed stronger associations with childhood symptoms than adult illnesses, suggesting distinct genetic architectures for pediatric versus adult-onset depression. Alexander-Bloch et al. (Reference Alexander-Bloch, Huguet, Schultz, Huffnagle, Jacquemont, Seidlitz, Saci, Moore, Bethlehem, Mollon, Knowles, Raznahan, Merikangas, Chaiyachati, Raman, Schmitt, Barzilay, Calkins, Shinohara and Glessner2022) examined rare genetic variants and found that CNV burden predicted both structural brain deviations and broader psychopathology in youth, including depression spectrum symptoms.
Cross-disorder analyses identified overlapping neurobiological signatures between MDD and other psychiatric conditions. Patel and colleagues (Reference Patel, Parker, Shin, Howard, French, Thomopoulos, Pozzi, Rooij, Buitelaar, Hoogman, Franke, Andreassen, Hibar, Ching, Schmaal, Veltman and Heuvel2020) reported shared cortical thickness reductions across MDD, ADHD, and SCHZ, enriched for astrocyte- and microglia-related genes, while Ardesch et al. (Reference Ardesch, Libedinsky, Scholtens, Wei and van den Heuvel2023) identified similar expression levels of risk genes in limbic, ventral attention, and default mode networks. These findings suggest that MDD-related brain changes may reflect broader neurodevelopmental vulnerabilities. However, our reviewed studies did indicate MDD-specific patterns, where MDD-specific methylation patterns (Zheng et al., Reference Zheng, Womer, Tang, Guo, Zhang, Tang and Wang2024) and gene expression profiles (Jabbi et al., Reference Jabbi, Arasappan, Eickhoff, Strakowski, Nemeroff and Hofmann2020) distinguished it from bipolar disorder. Hence, there appear to be shared and disorder-specific pathways.
Obsessive-compulsive disorder
The reviewed articles on obsessive-compulsive symptoms (OCS) and OCD are diverse, particularly in how genetic risk maps onto brain structure across developmental stages. Longitudinal evidence from Ravagnani Salto et al. (Reference Ravagnani Salto, Santoro, Hoexter, Jackowski, Pan, Rosário, Belangero, Alvarenga, Doretto, Fumo, Batistuzzo, Macul Ferreira de Barros, Timpano, Ota, Rohde, Miguel, Leckman and Zugman2021) in high-risk children linked slower thalamic volume reduction to OCS severity, indicating that atypical thalamocortical development could be a potential precursor to OCD. However, the absence of associations with OCD PRS suggests this structural change may reflect non-genetic influences or developmental timing effects. Cross-sectional findings from Patel and colleagues (Reference Patel, Parker, Shin, Howard, French, Thomopoulos, Pozzi, Rooij, Buitelaar, Hoogman, Franke, Andreassen, Hibar, Ching, Schmaal, Veltman and Heuvel2020) identified shared cortical thickness reductions across OCD, ADHD, and ASD—primarily in frontal-cingulate regions—with transcriptional profiles highlighting prenatal pyramidal and glial dysfunction.
Large-scale studies like Fernandez-Cabello et al. (Reference Fernandez-Cabello, Alnæs, van der Meer, Dahl, Holm, Kjelkenes, Maximov, Norbom, Pedersen, Voldsbekk, Andreassen and Westlye2022) reported that OCD PRS had weaker associations with childhood brain structure compared to educational attainment PRS, suggesting that genetic risk for OCD may not manifest structurally until later adolescence or adulthood. Similarly, Hughes et al. (Reference Hughes, Kunitoki, Elyounssi, Luo, Bazer, Hopkinson, Dowling, Doyle, Dunn, Eryilmaz, Gilman, Holt, Valera, Smoller, Cecil, Tiemeier, Lee and Roffman2023) observed that a broad neurodevelopmental PRS indicating combined risk for ADHD, ASD, depression, and Tourette syndrome predicted childhood symptoms better than disorder-specific PRSs, including OCD, with cerebellar volume reductions a shared neural correlate. These studies identify thalamocortical and cerebellar-striatal systems as notable loci for OCD-related phenotypes, yet the inconsistent PRS associations across studies may reflect differences in sample age (e.g., childhood vs. lifespan cohorts) or phenotype (e.g., OCS vs. diagnosed OCD). Future work should prioritize longitudinal designs that track genetic risk, brain maturation, and symptom trajectories to disentangle these pathways.
Late adolescence
Bipolar disorder and schizophrenia
The reviewed research on BPD and SCHZ identified both overlapping and distinct neurobiological mechanisms, with genetic risk mapping onto structural and functional brain alterations. A convergent finding across some studies is the association between PRS and reduced gray matter volume in frontal and temporal regions. For instance, Jiang et al. (Reference Jiang, Zai, Kennedy, Zou, Nikolova, Felsky, Young, MacIntosh and Goldstein2023) found that higher BPD PRS correlated with thinner cortices in the superior frontal and inferior temporal gyri in youth, while Chand et al. (Reference Chand, Singhal, Dwyer, Wen, Erus, Doshi, Srinivasan, Mamourian, Varol, Sotiras, Hwang, Dazzan, Kahn, Schnack, Zanetti, Meisenzahl, Busatto, Crespo-Facorro, Pantelis and Davatzikos2022) identified two distinct neuroanatomical signatures in SCHZ: one characterized by widespread gray and white matter loss (linked to higher PRS and cognitive impairment) and another for increased striatal volume. These findings suggest that while both disorders share genetic influences on cortical structure, SCHZ exhibits more diffuse deficits, whereas BPD may involve more localized disruptions in emotion- and cognition-related circuits.
Transcriptomic analyses further highlight convergence in molecular pathways. Patel et al. (Reference Patel, Parker, Shin, Howard, French, Thomopoulos, Pozzi, Rooij, Buitelaar, Hoogman, Franke, Andreassen, Hibar, Ching, Schmaal, Veltman and Heuvel2020) found that cortical thickness differences across multiple psychiatric disorders, including BPD and SCHZ, were enriched for genes expressed in pyramidal neurons, astrocytes, and microglia, implicating neurodevelopmental and immune-related processes. Similarly, Ardesch et al. (Reference Ardesch, Libedinsky, Scholtens, Wei and van den Heuvel2023) reported that shared risk genes for psychiatric disorders were highly expressed in the default mode, limbic, and ventral attention networks—regions involved in cognitive and emotional functions. Zhang et al. (Reference Zhang, Gao, Cao, Niu, Guo, Cui, Yu, Dou, Jiao, Qiu, Su and Lu2023) demonstrated in pediatric BPD that cortical thickness alterations spatially correlated with expression patterns of risk genes using the AHBA, particularly those involved in synaptic signaling and ion channel function within excitatory neurons. Notable differences appeared between BPD and SCHZ in their cell-type associations, with SCHZ-related genes more strongly linked to early neurodevelopmental processes (e.g., synaptic pruning) and BPD-related genes more strongly linked to synaptic signaling and plasticity (e.g., CACNA1C). González-Peñas et al.’s (2024) longitudinal study also linked accelerated cortical thinning in SCHZ to downregulated neurodevelopmental genes. Population-based studies further contextualize these findings. Yu et al. (Reference Yu, Liu, Wu, Becker, Zhang, Fan, Peng, Kuang, Kang, Dong, Zhao, Schumann, Feng, Sahakian, Robbins, Palaniyappan and Zhang2023) analyzed ABCD study data and found that cortical thickness variations in externalizing (ES) and internalizing (IS) symptom dimensions—including alterations in the left pars opercularis common to both—were associated with distinct genetic mechanisms. Complementing this, Y. Sun et al. (Reference Sun, Huang, Wang, Xu, Zhang, Zhou, Zhu and Qian2023) longitudinally tracked DNA methylation patterns in the IMAGEN cohort, identifying epigenetic signatures (e.g., IQSEC1 methylation) associated with externalizing behaviors and reduced prefrontal/cingulate gray matter volumes by late adolescence, with negative life events partially mediating these effects through DNA methylation changes. Takeuchi et al. (Reference Takeuchi, Kimura, Tomita, Taki, Kikuchi, Ono, Yu, Matsudaira, Nouchi, Yokoyama, Kotozaki, Nakagawa, Hanawa, Iizuka, Sekiguchi, Araki, Miyauchi, Ikeda, Sakaki and Kawashima2021) associated BPD PRS in healthy adults with increased inferior frontal gyrus volume and noted it as a potential substrate for creativity and mood stability. This aligns with Fernandez-Cabello et al.’s (2022) observation that psychiatric PRS (including BPD and SCHZ) had weaker childhood associations with brain structure than educational attainment PRS, suggesting that genetic risk may not fully manifest until later development. Hughes et al. (Reference Hughes, Kunitoki, Elyounssi, Luo, Bazer, Hopkinson, Dowling, Doyle, Dunn, Eryilmaz, Gilman, Holt, Valera, Smoller, Cecil, Tiemeier, Lee and Roffman2023) found neurodevelopmental PRS (including ADHD, ASD, and Tourette syndrome) predicted psychiatric symptoms more so than disorder-specific PRSs, with peak gene expression occurring prenatally in the cerebellum. Alexander-Bloch et al. (Reference Alexander-Bloch, Huguet, Schultz, Huffnagle, Jacquemont, Seidlitz, Saci, Moore, Bethlehem, Mollon, Knowles, Raznahan, Merikangas, Chaiyachati, Raman, Schmitt, Barzilay, Calkins, Shinohara and Glessner2022) explored rare and common genetic variation and found that CNV risk scores were associated with both cognitive deficits and subtle structural brain deviations in youth, supporting a continuum of genetic risk.
Methodologically, studies diverged in focus. Large-scale consortia like ENIGMA made use of case-control comparisons to map broad structural deficits, whereas individual studies (e.g., Jabbi et al., Reference Jabbi, Arasappan, Eickhoff, Strakowski, Nemeroff and Hofmann2020; Takeuchi et al., Reference Takeuchi, Kimura, Tomita, Taki, Kikuchi, Ono, Yu, Matsudaira, Nouchi, Yokoyama, Kotozaki, Nakagawa, Hanawa, Iizuka, Sekiguchi, Araki, Miyauchi, Ikeda, Sakaki and Kawashima2021) explored dimensional traits (e.g., creativity, mood stability) to identify risk-resilience gradients. Jabbi et al. (Reference Jabbi, Arasappan, Eickhoff, Strakowski, Nemeroff and Hofmann2020) further highlighted the role of the anterior insula in mood disorder morbidity, with postmortem transcriptomics implicating hormonal and neurodevelopmental pathways.
Discussion
Imaging genetics provides a comprehensive framework for understanding how genetic risks in neurodevelopmental and psychiatric disorders and developmental psychopathology manifest as specific patterns of brain vulnerability. It also enables the identification of genetic factors underlying such phenotypes, which can be strongly linked to distinct brain patterns. Imaging genetics studies primarily rely on large, publicly accessible databases in order to achieve sufficiently large sample sizes from combined imaging, genetic, and behavioral analysis. The creation of these publicly accessible databases provides readily available neuroimaging and genomic data to screen for candidate molecular mechanisms and offers a powerful tool for future research. The presence of these databases enables the generation of specific hypotheses about gene-brain relationships without requiring postmortem tissue from patients or reliance on animal models. The resulting sample sizes permit the formulation of research questions that necessitate much statistical power (e.g., the role of small effects in the etiology of disorders). Here, we provide a set of commentaries derived from the systematic analysis of the literature presented above.
Analytics
We noticed general trends in the analytical strategies used in the articles discussed here. In studies that adopt frameworks like a traditional GWAS (e.g., X. Li et al., Reference Li, Jiang, Zhao, Yang, Lu, Zhang, Li and Wang2024; Yu et al., Reference Yu, Liu, Wu, Becker, Zhang, Fan, Peng, Kuang, Kang, Dong, Zhao, Schumann, Feng, Sahakian, Robbins, Palaniyappan and Zhang2023), the analytical pipeline first consists of a method to find associations between the genotype and a trait-affected imaging phenotype (e.g., differences in cortical measures between affected and unaffected groups). The significantly associated genetic markers are then annotated to find corresponding relevant genetic loci or genes. The majority of the studies employed a microarray approach for genotyping, likely due to its cost-effectiveness and the reliability of the genotypes produced. These microarrays typically featured a marker density ranging from 300,000 to 600,000 markers. To enhance the resolution of genetic data, imputation was frequently utilized rather than “liftover” techniques that convert genetic coordinates from one assembly version to another. This imputation process significantly increases the number of markers, expanding datasets from hundreds of thousands to approximately 8 million markers (e.g., (Ge et al., Reference Ge, Wu, Zhang, Chen, Zhang, Kang, Deng, Ou, He, Zhao, Kuo, Ma, Banaschewski, Barker, Bokde, Desrivières, Flor, Grigis, Garavan and Yu2024).
A major limitation of GWAS-type studies is their reliance on large sample sizes to detect small effect sizes, making them less effective for capturing rare variants with potentially larger effects. While these studies are useful for identifying common genetic markers associated with traits, they often fall short of providing functional insights or mechanistic explanations of how these markers influence brain structure and function. Moreover, the significant computational demands of handling imputed datasets and the complexity of controlling for population stratification and other confounding variables pose challenges. As a result, complementary approaches, like enrichment analysis using resources like the STRING database (see Box 4), are often needed to gain a more comprehensive understanding of the genetic underpinnings of neurodevelopmental disorders and/or developmental psychopathology phenotypes.
Enrichment analysis is often conducted to determine if the collectively identified set of genes or loci are overrepresented in relation to certain biological functions, or pathways, or if the identified genes have been previously associated with similar traits. In some cases, enrichment analysis compares the gene groups flagged by a GWAS (or a similar approach for identifying associated markers) with pre-defined gene sets that correspond to gene ontology (GO) terms, pathways, or interaction networks and determines if the experimentally selected genes are statistically overrepresented in these pre-defined sets (e.g., Yu et al., Reference Yu, Liu, Wu, Becker, Zhang, Fan, Peng, Kuang, Kang, Dong, Zhao, Schumann, Feng, Sahakian, Robbins, Palaniyappan and Zhang2023).
Another limitation of GWAS in developmental research is that, despite the many significant SNP associations with neuroimaging traits, these identified variants typically exert only minor influences and represent just a small portion of all truly associated variants. As a result, their ability to predict outcomes is limited. To address this limitation, researchers have incorporated PRS to aggregate the many small effects of associated common variants (Dudbridge, Reference Dudbridge2013; Palla & Dudbridge, Reference Palla and Dudbridge2015). Studies incorporating PRS combine the effects of variants across the entire genome to achieve several goals: 1) estimate heritability, 2) identify genetic overlap between different traits, and 3) predict phenotypes based on an individual’s genetic profile. It appears that, with the exception of educational attainment, there is a limited number of these scores that are used regularly. Notably, for developmental disorders, a limited number of specific studies are commonly referenced, such as for ASD (Grove et al., Reference Grove, Ripke, Als, Mattheisen, Walters, Won, Pallesen, Agerbo, Andreassen, Anney, Awashti, Belliveau, Bettella, Buxbaum, Bybjerg-Grauholm, Bækvad-Hansen, Cerrato, Chambert, Christensen and Børglum2019) and ADHD (Demontis et al., Reference Demontis, Walters, Martin, Mattheisen, Als, Agerbo, Baldursson, Belliveau, Bybjerg-Grauholm, Bækvad-Hansen, Cerrato, Chambert, Churchhouse, Dumont, Eriksson, Gandal, Goldstein, Grasby, Grove and Neale2019). Such a limited pool of PRS sources suggests a need for a way to calculate PRS in an ongoing fashion, constantly diversifying or stratifying the contributing samples.
Many studies in our reviewed set used genetic components represented by DNA-sequencing data (e.g., Chilosi et al., Reference Chilosi, Podda, Ricca, Comparini, Franchi, Fiori, Pasquariello, Casalini, Cipriani and Santorelli2022), RNA-sequencing data (e.g., Ardesch et al., Reference Ardesch, Libedinsky, Scholtens, Wei and van den Heuvel2023), or a combination of RNA-seq and proteomics (e.g., (Hale et al., Reference Hale, Bastarache, Morales, Wellons, Limbrick and Gamazon2021) or RNA-seq and DNA methylation data (e.g., Zheng et al., Reference Zheng, Womer, Tang, Guo, Zhang, Tang and Wang2024). In cases where DNA-sequencing data serve as the genetic component, genomic analyses tended to precede imaging analysis. Chilosi and colleagues (2022) first identified copy number variations (CNVs) associated with the neurodevelopmental disorder in question (childhood apraxia of speech), and after that, they used the MRI data to identify any associated structural brain abnormalities. In cases where RNA-sequencing served as the genomic component, imaging data analysis often preceded genomic analysis. For example, Jabbi and colleagues (2020) determined regions of interest from MRI images and then analyzed RNA data (gene expression levels) in these specific regions. Depending on the study, authors can use transcriptomic data from open sources such as AHBA (Ardesch et al., Reference Ardesch, Libedinsky, Scholtens, Wei and van den Heuvel2023) to build spatial expression profiles across the region of interest. In studies that implement multi-omics approaches (e.g., Hale et al., Reference Hale, Bastarache, Morales, Wellons, Limbrick and Gamazon2021; Zheng et al., Reference Zheng, Womer, Tang, Guo, Zhang, Tang and Wang2024), researchers may first combine genetics, proteomic, and epigenetics data into the common ‘genetic component’ and use various databases as references to search for a specific disease(condition)-associated variants as potential markers. After that, MRI data for relevant phenotypes are being used to verify the findings. GMV data can also serve as one of the parameters in such multicomponent studies (Jabbi et al., Reference Jabbi, Arasappan, Eickhoff, Strakowski, Nemeroff and Hofmann2020; Zheng et al., Reference Zheng, Womer, Tang, Guo, Zhang, Tang and Wang2024).
Diagnoses
There appears to be a narrow breadth of developmental disorders examined from an imaging genetics perspective. Most of the synthesized articles focused on participants with ASD and ADHD. There are also developmental disorders, such as SCHZ, mood disorders, or broadly defined developmental psychopathology phenotypes such as internalizing and externalizing. The number of studies focusing on a particular disorder or related phenotypes seems to be related to the availability of publicly accessible imaging genetic data. As the needed databases are impossible (or near impossible) to secure at a single site, it is important that the field adopts common best practices in the methodology of data acquisition and processing as quickly as possible to ensure that the data are mergeable and findings are robust, replicable, and generalizable across different neurodevelopmental disorders and developmental psychopathology phenotypes.
Integration of multimodal data
As new data become available, imaging genetics studies increasingly rely on multimodal neuroimaging data, combining structural MRI, fMRI, EEG, and other techniques to better characterize a given disorder. While this approach offers a more nuanced understanding of how genetic factors influence the brain, it also introduces a new challenge involving scalability, interpretability, and generalization of complex association models for integrating heterogeneous data types (Biessmann et al., Reference Biessmann, Plis, Meinecke, Eichele and Müller2011). Some of the typical hurdles include incommensurability of different datasets, e.g., brain structure, activity, clinical scores, gene expression levels involved in the study, spatial and dimensional heterogeneity of neuroimaging data caused by the varying spatial resolution limit of each of these modalities, or the data types that range from, e.g., time series data from fMRI to tensors of diffusion-weighted imaging (Lorenzi et al., Reference Lorenzi, Deprez, Balelli, Aguila, Altmann and Colliot2023). Others include heterogeneous artifacts and measurement uncertainty resulting from varied acquisition and processing routines, missing data, and the interpretability of the obtained results. In recent years, various methods have been developed to address these issues, some of which include integrating sMRI and diffusion MRI (Liu & Calhoun, Reference Liu and Calhoun2014), EEG and fMRI (Rastogi et al., Reference Rastogi, Lee and Salamon2008), and sMRI and fMRI (Mueller et al., Reference Mueller, Keeser, Samson, Kirsch, Blautzik, Grothe, Erat, Hegenloh, Coates, Reiser, Hennig-Fast, Meindl and Draganski2013). Moreover, various mathematical frameworks like Bayesian latent variable models (Lorenzi et al., Reference Lorenzi, Deprez, Balelli, Aguila, Altmann and Colliot2023) and mediation model framework (Zhao et al., Reference Zhao, Li and Caffo2021) have also been developed for the integration of multimodal informational variables derived from these datasets.
A methodological hurdle associated with the growing amount of high-dimensional data inherent to both genetic and neuroimaging research is the computational infrastructure required for analysis and storage. The technological advancements in high-throughput microarray genotyping platforms allow more affordable and hypothesis-free interrogation of millions of genetic variants across the genome (Uffelmann et al., Reference Uffelmann, Huang, Munung, de Vries, Okada, Martin, Martin, Lappalainen and Posthuma2021). Similarly, the possibility of collecting multimodal neuroimaging data concurrently or the availability of open access databases have increased significantly over the last decades (Alexander et al., Reference Alexander, Escalera, Ai, Andreotti, Febre, Mangone, Vega-Potler, Langer, Alexander, Kovacs, Litke, O’Hagan, Andersen, Bronstein, Bui, Bushey, Butler, Castagna, Camacho and Milham2017; Jernigan et al., Reference Jernigan, Brown, Hagler, Akshoomoff, Bartsch, Newman, Thompson, Bloss, Murray, Schork, Kennedy, Kuperman, McCabe, Chung, Libiger, Maddox, Casey, Chang, Ernst and Dale2016). However, the amount of storage and computing power (e.g., high-performance computing, HPC, clusters) needed to analyze these datasets are not prioritized or available to a significant fraction of researchers. In the United States, there has been a concerted effort to increase the availability of HPC infrastructure through various institutions and government initiatives like the National Science Foundation (NSF) - Extreme Science and Engineering Discovery Environment (XSEDE) program, Advanced Cyberinfrastructure Coordination Ecosystem: Services & Support (ACCESS), or Harnessing the Data Revolution (HDR) initiative, but the challenges related to demand, funding, technical expertise, and geographical disparities persist.
Sample size, reproducibility, and the challenge of small effect sizes
Reproducibility is a ubiquitous problem in scientific research, and imaging genetics is no exception. Basically, the reproducibility crisis describes the situation when published research results are too often not replicable, which leads to the slowdown of scientific progress in the field (Kelly & Hoptman, Reference Kelly and Hoptman2022). Avinun and colleagues (Reference Avinun, Nevo, Knodt, Elliott and Hariri2018) note that major contributing factors to the reproducibility crisis in imaging genetics include small effect sizes, heterogeneity between samples, and differences in analytical strategies. These issues are closely related to the issue of sample size and a lack of well-defined guidelines for imaging genetic research (i.e., which imaging modalities are most appropriate to interrogate which developmental outcome). Though, practically, a major limitation to choosing which imaging modality is most appropriate to study a given developmental population lies in which is best suited to acquire good data from them (e.g., small children may be more amenable to an EEG versus an MRI). This decision also depends on the phenotype and research question. Since EEG and MRI are not interchangeable, the choice will partly depend on the study’s objectives.
It is a major methodological challenge to detect genetic effects on brain structure and function, which are expected to have small effect sizes (Holland et al., Reference Holland, Wang, Thompson, Schork, Chen, Lo, Witoelar, Werge, O’Donovan, Andreassen and Dale2016; Mascarell Maričić et al., Reference Mascarell Maričić, Walter, Rosenthal, Ripke, Quinlan, Banaschewski, Barker, Bokde, Bromberg, Büchel, Desrivières, Flor, Frouin, Garavan, Itterman, Martinot, Martinot, Nees, Orfanos and Tahmasebi2020). Detecting these small effect sizes is further complicated by the small sample sizes and the so-called “curse of dimensionality” inherent to genetic and imaging data. The curse of dimensionality refers to the well-known problem where analytical methods fail to generalize as the parameter space exceeds the sample size. As the number of variables describing a sample increases relative to its participants, so does the chance that a model overfits the specific data and generates results that are less reliable and reproducible. Typically, imaging genetic datasets have very large feature spaces (e.g., hundreds of thousands) compared to the number of participants (e.g., a few hundred), making them susceptible to the curse of dimensionality unless addressed by the analytical strategy applied to the sample. Given the difficulties in collecting multimodal data from developing populations, it is difficult to generate large datasets for high-powered imaging genetic analysis. Thus, there is a need for large sample sizes to detect any associations between genes, brains, and development.
Large single-site cohorts can be difficult to achieve given the heterogeneity of neurodevelopmental disorders, variations in the manifestation and severity of such disorders, and the cost associated with the acquisition of both genetic and imaging data. Different methods have been proposed within each individual discipline to address some of these issues. A notable strategy in imaging contexts is the repeated acquisition of neuroimaging data for increasing reliability and significantly reducing the sample size needed to obtain a certain effect size (C. C. Fan et al., Reference Fan, Smeland, Schork, Chen, Holland, Lo, Sundar, Frei, Jernigan, Andreassen and Dale2018; McFarquhar et al., Reference McFarquhar, McKie, Emsley, Suckling, Elliott and Williams2016; Rosenberg & Finn, Reference Rosenberg and Finn2022). The issue of replicability is no surprise for anyone dealing with neurodevelopmental, neuroimaging, and genetic studies. Its complexity has been omnipresent. Thus, several large-scale studies were performed to provide evidence for and scope of the replicability of findings. The Open Science Collaboration (Open Science Collaboration, 2015) succeeded in replicating only 36 out of 100 prominent findings, whereas the Many Labs project not only replicated 10 of 13 across 36 independent samples but also demonstrated that replicability highly depends on the effect being studied (Klein et al., Reference Klein, Ratliff, Vianello, Adams, Bahník, Bernstein, Bocian, Brandt, Brooks, Brumbaugh, Cemalcilar, Chandler, Cheong, Davis, Devos, Eisner, Frankowska, Furrow, Galliani and Nosek2014), not so much on the specific sample or settings. These inconsistencies may be attributed to differences in sample characteristics, neuroimaging protocols, or statistical methods, highlighting the need for standardization and open science practice (Poldrack et al., Reference Poldrack, Baker, Durnez, Gorgolewski, Matthews, Munafò, Nichols, Poline, Vul and Yarkoni2017). For neurodevelopmental samples, the issue further increases from lack of homogeneity in the diagnosis of specific disorders, the difference in severity scales used, and the inclusion or exclusion of specific comorbidities, among others. These issues are then multiplied by the issues in neuroimaging data, which suffer from varying acquisition parameters across different sites (specifically for multisite larger datasets), quality of the data, and varying data analytic pipelines (Carter et al., Reference Carter, Bearden, Bullmore, Geschwind, Glahn, Gur, Meyer-Lindenberg and Weinberger2017).
Similar issues exist in genetic data analyses where biases can stem from various sources, potentially compromising the accuracy of genetic analysis. Allelic dropout (Johnson & Haydon, Reference Johnson and Haydon2007) is one common issue where one allele fails to amplify or is undetected during genotyping, leading to skewed results. Polymerase chain reaction (PCR) bias (Kebschull & Zador, Reference Kebschull and Zador2015) may occur due to factors like primer specificity or template secondary structure, causing certain alleles to be preferentially amplified over others. Reference bias (Günther et al., Reference Günther, Nettelblad and Di Rienzo2019) is another concern, as genotyping techniques rely on reference genomes or panels that may not fully represent the genetic diversity of the population being studied. Microarray-based genotyping can introduce chip bias (Kockum et al., Reference Kockum, Huang and Stridh2023), where factors like probe design or hybridization efficiency lead to inaccurate genotype calls. In NGS coverage, bias (Rieber et al., Reference Rieber, Zapatka, Lasitschka, Jones, Northcott, Hutter, Jäger, Kool, Taylor, Lichter, Pfister, Wolf, Brors, Eils and Hofmann2013) can arise, with some genomic regions being overrepresented or underrepresented due to uneven coverage. Genomic context bias is another issue, particularly in regions with repetitive sequences or high GC content (Lan et al., Reference Lan, Yin, Reed, Moua, Thomas and Zhang2015), which may be prone to amplification or sequencing errors. Sample preparation variability, including differences in DNA extraction or handling procedures, can also introduce biases in genotyping results. Following best practices for library preparation and genotyping, and being aware of these biases, is essential for accurately interpreting genetic data.
In response to the need for larger samples, there has been a growing number of databases that include brain, behavior, and genetic information for children. Large, open-source databases are becoming more common (see Boxes 3 and 4 for examples). These large datasets allow for more diverse populations to be studied and, importantly, allow for a more comprehensive view of child development by characterizing many child behaviors and, often, including many types of imaging data such as fMRI, sMRI, and diffusion MRI. Many of these databases have goals about diversity and include samples diverse in many characteristics, including race, SES, language background, and diagnosed developmental disorder, among other identifiers. While this diversity can make genetics studies more difficult, they are also arguably more representative of the current world than the typical W.E.I.R.D. (Western, educated, industrialized, rich, democratic) populations, which still rule many lab-based studies.
While the increase in data is a boon, researchers must be conscientious when performing analysis of heterogeneous populations. For example, there are natural differences in allele frequencies among populations with different genetic ancestry that must be accounted for in the analysis. Other confounders include environmental factors, such as exposure to toxins or stress; demographic variables, like age, sex, and ethnicity; and socioeconomic and sociocultural factors, like availability of resources, language exposure, and early childhood adversity. Failure to adequately account for these factors can lead to spurious statistical associations (Elliott et al., Reference Elliott, Sharp, Alfaro-Almagro, Shi, Miller, Douaud, Marchini and Smith2018; Lenroot & Giedd, Reference Lenroot and Giedd2008; Meyer-Lindenberg et al., Reference Meyer-Lindenberg, Nicodemus, Egan, Callicott, Mattay and Weinberger2008; Quinlan et al., Reference Quinlan, Barker, Luo, Banaschewski, Bokde, Bromberg, Büchel, Desrivières, Flor, Frouin, Garavan, Chaarani, Gowland, Heinz, Brühl, Martinot, Martinot, Nees, Orfanos and Schumann2020). Advanced statistical models, including mixed-effects models and path analysis, have been developed to address these confounding factors, making it possible to isolate the effect of genetic variants on neuroimaging outcomes (Chyzhyk et al., Reference Chyzhyk, Varoquaux, Milham and Thirion2022; Pala et al., Reference Pala, Lee, Ning, Kim and Shen2022). However, for various neurodevelopmental disorders with comorbidities, it is practically impossible to account for all confounding factors in a specific sample obtained for the study, which raises questions about the reliability of the findings (Mohammadi, Reference Mohammadi2015; Thompson et al., Reference Thompson, Stein, Medland, Hibar, Vasquez, Renteria, Toro, Jahanshad, Schumann and Franke2014). Therefore, it may be beneficial to focus on transdiagnostic symptom domains rather than focusing on specific disorders when using these large-scale resources, especially considering recent evidence indicating shared neural and genetic correlates across different disorders (e.g., Barker et al., Reference Barker, Ing, Biondo, Jia, Pingault, Du Rietz, Zhang, Ruggeri, Banaschewski, Hohmann, Bokde, Bromberg, Büchel, Quinlan, Sounga-Barke, Bowling, Desrivières, Flor, Frouin and Schumann2021; Hughes et al., Reference Hughes, Kunitoki, Elyounssi, Luo, Bazer, Hopkinson, Dowling, Doyle, Dunn, Eryilmaz, Gilman, Holt, Valera, Smoller, Cecil, Tiemeier, Lee and Roffman2023) Nonetheless, uniform guidelines that fit into an open science framework should be adopted to adequately mitigate the reproducibility crisis in imaging genetics research.
Statistical complexity and high-dimensional data
The complexity of genetic and brain imaging data that necessitates a large sample size also often requires advanced analytical techniques to parse out meaningful relationships, a task compounded by the vast heterogeneity observed within neurodevelopmental disorders (Arnett & Flaherty, Reference Arnett and Flaherty2022; Jacob et al., Reference Jacob, Wolff, Steinbach, Doyle, Kumar and Elison2019). In addition, the concern for privacy and the potential for genetic discrimination raises the ethical dilemma of this approach (Mezinska et al., Reference Mezinska, Gallagher, Verbrugge and Bunnik2021; Palk et al., Reference Palk, Illes, Thompson and Stein2020). Since many imaging genetic studies are interested in neurodevelopmental outcomes, extra care must be given to protecting the vulnerable populations under study. This includes equitable participant selection, appropriately informed consent/assent that reflects the growing necessity for these data to be stored in publicly accessible biobanks, and ethically reporting clinical results to participants and the broader public in a way that avoids psychological distress
(Palk et al., Reference Palk, Illes, Thompson and Stein2020). As global collaborations grow and generate large and diverse samples, researchers must be careful not to commit “ethics dumping,” the tendency to exploit potentially less regulated ethics oversight in low-to-middle-income countries, to expedite research aims (Palk et al., Reference Palk, Illes, Thompson and Stein2020).
The statistical complexity of analyzing these high-dimensional data is not handled well by traditional statistical methods. Methods that are used to analyze behavioral phenotypes, brain endophenotypes, and genetic variants concurrently to identify relationships between them must navigate these complex data while remaining robust to challenges posed by large sample sizes and high dimensionality (J. Fan et al., Reference Fan, Han and Liu2014). The development of appropriate methodology is dependent on available imaging genetic datasets suitable for testing such approaches. The first dataset suitable for testing such methods came from the Alzheimer’s Disease Neuroimaging Initiative, ADNI, and contained data modalities useful to imaging geneticists: clinical, behavioral, and cognitive assessments; brain imaging modalities, such as MRI and EEG; and genetic information such as genome-wide genotyping and whole-genome/exome sequencing (Weiner et al., Reference Weiner, Veitch, Aisen, Beckett, Cairns, Green, Harvey, Jack, Jagust, Morris, Petersen, Salazar, Saykin, Shaw, Toga and Trojanowski2017). The first large-scale whole-brain, whole-genome imaging genetics study was performed using these data in 2010, where researchers applied a massive univariate linear regression approach to identifying significant genetic markers associated with quantitative imaging indicators of AD progression (Stein et al., Reference Stein, Hua, Lee, Ho, Leow, Toga, Saykin, Shen, Foroud, Pankratz, Huentelman, Craig, Gerber, Allen, Corneveaux, DeChairo, Potkin, Weiner and Thompson2010).
Since then, numerous studies have explored analytical frameworks, ranging from multivariate regressions to machine learning to deep learning, suitable for jointly analyzing these combined data types. Although techniques from each discipline have proven effective in identifying significant associations between genes and imaging indicators, the prevailing approach is currently regularized multivariate regression due to its capacity to manage high-dimensional data within the constraints of current sample sizes, which typically include hundreds or thousands (Cheek et al., Reference Cheek, Lindner and Grigorenko2024). These regularized models have been the primary choice in large part because they are best able to mitigate the curse of dimensionality and prevent overfitting, as demonstrated in recent imaging genetic studies identifying genetic components of voxels associated with AD (Zhou et al., Reference Zhou, Thung, Liu and Shen2019). A major limiting factor for machine learning and deep learning techniques may be the number of available participants to train these models relative to the number of genetic and imaging features. However, as large studies and databanks begin to generate large cohorts of imaging genetic data (thousands of participants instead of hundreds), this paradigm may shift.
Network neuroscience
As new methods are developed, so too are new analytic frameworks. Network neuroscience represents a transformative approach to studying the neural mechanisms, shifting the focus from individual brain regions to the complex networks that underpin brain structural architecture, function, and cognition (Bassett & Sporns, Reference Bassett and Sporns2017; Koirala et al., Reference Koirala, Fleischer, Glaser, Zeuner, Deuschl, Volkmann, Muthuraman and Groppa2018; Michels et al., Reference Michels, Koirala, Groppa, Luechinger, Gantenbein, Sandor, Kollias, Riederer and Muthuraman2021). This new paradigm has significantly impacted imaging genetics, offering a different perspective to understanding the influence genetic variation has on the brain’s structural and functional networks, facilitating a deeper understanding of the polygenic nature of brain architecture. Unlike older imaging genetics studies focused on the association between individual genetic variants and specific brain regions or functions, network neuroscience has highlighted the importance of considering how the genome influences the brain’s overall connectivity. For example, studies using graph theory metrics such as node degree, clustering coefficient, and path length have shown that genetic factors can impact the efficiency and resilience of neural networks (Dennis et al., Reference Dennis, Jahanshad, Rudie, Brown, Johnson, McMahon, de Zubicaray, Montgomery, Martin, Wright, Bookheimer, Dapretto, Toga and Thompson2011; Fornito & Bullmore, Reference Fornito and Bullmore2012). These metrics provide a quantitative framework to assess the genetic contribution to the brain’s organizational principles and offer insights into the genetic bases of individual differences in cognitive abilities, emotional processing, and susceptibility to mental health disorders. Similarly, network neuroscience has enabled the identification of genetic influences on the brain’s modular organization. The human brain is organized into functionally specialized but interdependent networks, such as the default mode network, salience network, and central executive network (Power et al., Reference Power, Cohen, Nelson, Wig, Barnes, Church, Vogel, Laumann, Miezin, Schlaggar and Petersen2011; Yeo et al., Reference Yeo, Krienen, Sepulcre, Sabuncu, Lashkari, Hollinshead, Roffman, Smoller, Zöllei, Polimeni, Fischl, Liu and Buckner2011). Imaging genetics studies incorporating network analysis have demonstrated that specific genetic variants can modulate the coherence and integration of these networks. For instance, variations in genes related to neurotransmitter systems, such as the dopamine and serotonin receptors, have been associated with alterations in the connectivity within and between these functional networks (Gaiteri et al., Reference Gaiteri, Ding, French, Tseng and Sibille2014; Parikshak et al., Reference Parikshak, Gandal and Geschwind2015; Vértes et al., Reference Vértes, Rittman, Whitaker, Romero-Garcia, Váša, Kitzbichler, Wagstyl, Fonagy, Dolan, Jones, Goodyer and Bullmore2016). This has profound implications for understanding the genetic underpinnings of complex behaviors and neuropsychiatric conditions, as disruptions in network connectivity and integration are a common feature of disorders such as schizophrenia, ASD, and MDD (Benkarim et al., Reference Benkarim, Paquola, Park, Hong, Royer, Vos de Wael, Lariviere, Valk, Bzdok, Mottron and C. Bernhardt2021; Duman et al., Reference Duman, Sanacora and Krystal2019; Gulsuner et al., Reference Gulsuner, Walsh, Watts, Lee, Thornton, Casadei, Rippey, Shahin, Nimgaonkar, Go, Savage, Swerdlow, Gur, Braff, King, McClellan, Braff, Cadenhead, Calkins and Wilson2013). Recently, network neuroscience approaches have been employed to investigate how genetic predispositions interact with environmental exposures to shape the development and plasticity of neural networks (Flores-Dorantes et al., Reference Flores-Dorantes, Díaz-López and Gutiérrez-Aguilar2020; J.-W. Kim et al., Reference Kim, Park, Kang, Gonzales, Oh, Seung, Ko, Cheong, Chung and Shin2019; Tooley et al., Reference Tooley, Bassett and Mackey2021), which is critical for understanding the complex interplay between genetics, environment, and brain function, informing interventions, and developing personalized therapeutic strategies for neurodevelopmental and psychiatric disorders.
Conclusion
To conclude, imaging genetics is currently a burgeoning field of research that faces numerous challenges pertaining to data acquisition, analysis, and, most importantly, interpretation. As the field keeps expanding, new opportunities arise for data integration, such as co-interpretation of structural and functional imaging genetics data and results, which might be a subject of an independent systematic review. As the field continues to evolve, the integration of larger sample sizes, more refined analytical techniques, and complementary approaches will produce more robust and replicable findings. While much progress has been made, imaging genetics remains a burgeoning field with considerable potential for further discoveries, particularly in understanding the complex interactions between genetics, brain function, and behavior across development. Imaging genetics has become a highly popular approach within psychiatric research. The acquisition of sufficient sample sizes has crystallized as a critical factor in yielding robust results. Animal imaging studies might help to corroborate human findings and to provide information beyond pure imaging modalities” (Nickl-Jockschat & Wassink, Reference Nickl-Jockschat and Wassink2021, p. 423). In other words, much has been done, and there is still much to do.
Supplementary material
The supplementary material for this article can be found at https://doi.org/10.1017/S0954579425100400.
Acknowledgments
We thank Jessica Garcia and Marina Zhukova for their advice in meaningfully structuring the results of our reviewed papers. This research was supported by The Eunice Kennedy Shriver National Institute of Child Health and Development (NICHD) P50HD052120, Project 6 (PI: Elena L. Grigorenko) and the University of Houston’s Hugh Roy and Lillie Cranz Cullen Distinguished Chair endowment funds. The authors have no competing interests to declare. All data associated with this study (articles screened) are available in the Supplementary files.