Introduction
Since its first suggestion in the early 2000s (Hebert et al., Reference Hebert, Cywinska, Ball and deWaard2003), DNA Barcoding has received much attention due to its versatility as a global bioidentification system. The proposal of using a specific DNA sequence as a type of barcode for all life forms, allowing for quick comparisons and easier identification of specimens, is attractive in the context of fewer taxonomists and less time available for the careful study of specimens. In 2007, the Barcode of Life Data System (BOLD) was created as a freely available online workbench for collecting, analysing and sharing DNA Barcodes (Ratnasingham and Hebert, Reference Ratnasingham and Hebert2007).
In 15 years of existence, BOLD has gathered almost 14 million DNA sequences of over 345 thousand animals, plants and fungi species (as of May 16th, 2023; BOLD, 2023). It is a valuable repository allowing the association of voucher pictures with sequence data, which increases the repeatability and verification of information, two fundamental principles of scientific work (Vink et al., Reference Vink, Paquin and Cruickshank2012; Bianchi and Gonçalves, Reference Bianchi and Gonçalves2021b). BOLD also provides its own tool for species delimitation, the Barcode Index Number (BIN), which is based on cluster analysis of the sequences in the database, and compatible with the constant inclusion of new data (Ratnasingham and Hebert, Reference Ratnasingham and Hebert2013). Each BIN can represent a potential species, allowing the evaluation of such units and their use in the lack of a well-developed taxonomic frame.
However, some authors have pointed out some limitations currently found in BOLD for specific taxa (Sonet et al., Reference Sonet, Jordaens, Braet, Bourguignon, Dupont, Backeljau, De Meyer and Desmyter2013; Lis et al., Reference Lis, Lis and Ziaja2016; Gonçalves et al., Reference Gonçalves, Bianchi, Deprá and Calegaro-Marques2021; Bianchi and Gonçalves, Reference Bianchi and Gonçalves2021a), and even questioning the quality of the data added to this database. For example, it has been shown that there are problems in the acquisition of reference data and its curation in BOLD and GenBank, as well as in the production of sequences to assess the reference data (Meiklejohn et al., Reference Meiklejohn, Damaso and Robertson2019; Pentinsaari et al., Reference Pentinsaari, Ratnasingham, Miller and Hebert2020). Thus, the efforts to improve the quality of data of these online databases must be continuous, and should include revision and curation of available data.
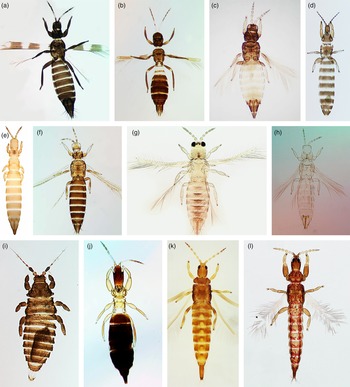
While DNA Barcoding has been extensively utilised in many taxa, for the insect order Thysanoptera (popularly known as thrips; Fig. 1) it is still a rather incipient tool. With over 6400 species in the order and a cosmopolitan distribution, Barcode data are available only for a few species, most of them with some importance for agriculture (e.g., Karimi et al., Reference Karimi, Hassani-Kakhki and Awal2010; Chakraborty et al., Reference Chakraborty, Singha, Kumar, Pakrashi, Kundu, Chandra, Patnaik and Tyagi2019). In fact, only a few works deal with a large variety of thrips taxa, and most studies focus on a limited geographical area (Iftikhar et al., Reference Iftikhar, Ashfaq, Rasool and Hebert2016; Tyagi et al., Reference Tyagi, Kumar, Singha, Chandra, Laskar, Kundu, Chakraborty and Chatterjee2017) or a specific family (Marullo et al., Reference Marullo, Mercati and Vono2020). Still, partial cytochrome c oxidase subunit I (COI) sequences, especially at the 5’ portion (COI-5P), have shown potential to be a useful identification tool for these insects, as shown in the recent revision of Ghosh et al. (Reference Ghosh, Jangra, Dietzgen and Yeh2021) of molecular and electronic identification tools.
Mounted specimens of a variety of Thysanoptera species and families. A-B: Aeolothripidae; A: Aeolothrips fasciatus (Linnaeus, 1758), B: Franklinothrips vespiformis (Crawford DL, 1909). C: Heterothripidae, Heterothrips bicolor Hood, 1954. D: Merothripidae, Merothrips brunneus Ward, 1969. E-H: Thripidae; E: Aptinothrips stylifer Trybom, 1894, F: Frankliniella occidentalis (Pergande, 1895), G: Scirtothrips dorsalis Hood, 1919, H: Thrips palmi Karny, 1925. I: Uzelothripidae, Uzelothrips scabrosus Hood, 1952. J-L: Phlaeothripidae; J: Compsothrips graminis (Hood, 1936), K: Eschatothrips decoratus Hood, 1957, L: Haplothrips dissociatus Cavalleri, Lindner & Mendonça, 2016. Photos A and E are from the site Thrips of California 2012 (Available at https://keys.lucidcentral.org/keys/v3/thrips_of_california/Thrips_of_California.html; accessed on September 16th, 2022), remaining photos from The Thrips of Brazil (Available at http://thysanoptera.com.br/home; accessed on September 16th, 2022).

Thysanoptera specimens offer difficulties and limitations for their DNA extraction and sequencing. Most preserved specimens no longer contain any source of DNA, thus molecular studies of thrips require freshly collected specimens. Their small size requires the usage of whole specimens for DNA extraction, and some procedures can easily damage the thrips, hampering specimen usage for molecular and morphological data concurrently. Finally, thrips often yield low quantities of DNA, further complicating molecular analyses (Dickey et al., Reference Dickey, Kumar, Hoddle, Funderburk, Morgan, Jara-Cavieres, Shatters, Osborne and McKenzie2015).
This work aims to evaluate the available COI sequences for Thysanoptera in BOLD. Despite the existence of other databases for genetic sequences, such as GenBank, our focus on BOLD data is due to its emphasis on DNA Barcodes and implementation of several quality control steps. The objectives of this study were: (1) investigate the representativity of BOLD sequences compared to the valid taxa within Thysanoptera; (2) identify Barcode gaps at the generic level; and (3) assess the correct identifications of thrips specimens using DNA Barcodes. After these analyses, we highlight some taxa within Thysanoptera that need a careful taxonomic revision, sequences whose identity may need to be re-evaluated, and suggest ways to improve the overall quality of the database available in BOLD.
Materials and methods
The workflow described below follows and adapts the methodology utilised in Gonçalves et al. (Reference Gonçalves, Bianchi, Deprá and Calegaro-Marques2021) and Bianchi and Gonçalves (Reference Bianchi and Gonçalves2021a).
Data acquisition and filtering
All sequences available on BOLD labelled as ‘Thysanoptera’ were manually downloaded in November 2021 (database 0). We curated this original database to remove sequences which did not fit the criteria needed for our analyses, and Table 1 lists how many sequences were removed at each step. The filtering steps are as follows: (1) removal of sequences of genes other than COI-5P; (2) all sequences without species-level identification removed, and names corrected whenever needed (synonymy, misspellings); (3) removal of all genera with a single species, as the probability of correct identification (PCI) analysis requires all genera to have at least two species; (4) remaining sequences divided into families and aligned using MAFFT v7.0 (Katoh et al., Reference Katoh, Rozewicki and Yamada2019); (5) alignments were trimmed to the canonical barcode region (Hebert et al., Reference Hebert, Cywinska, Ball and deWaard2003) using as reference the BOLD entry MAIMB460-09 (Thrips palmi), and all sequences with less than 400 bp were removed; (6) sequences were separated by genus; (7) genera with less than two species, or lacking any species with two or more sequences, were removed, to ensure intra- and interspecific comparisons for Barcode gap analysis. With these steps, Databases 1, 2 and 3 were generated (Table 2). All sequences were treated by their species name only, with subgenera or subspecies not being considered. Table 1 lists how many sequences, families, genera and species labels were available after each filtering step. All databases utilised in this work are given in Supplementary file 1. A dataset on BOLD has been generated with the majority of sequences downloaded in November 2021, under the name ‘DS-THRIPS21’.
Number of sequences and taxon representativity on BOLD, after each filtering step

Databases generated in this work, filtering steps completed on each, and analyses performed with them. All databases are available in Supplementary file 1.

Representativity of Thysanoptera data on BOLD
We assessed the representativeness of Database 1 for Thysanoptera taxa by determining the number of families, genera and species included. We also examined the distribution of sequences within these taxa to identify any potential biases. Geographical distribution data from databases 0 and 3 were obtained to generate global heat maps, to evaluate shifts in distribution patterns before and after filtering steps. The maps were created with MapChart, available at https://www.mapchart.net.
Barcode gap analysis
To evaluate the presence of Barcode gaps in Thysanoptera, we used the function dist.dna() of the R package ape (Paradis and Schliep, Reference Paradis and Schliep2019) on database 3 to estimate pairwise uncorrected p-distances for all sequences within each genus (Supplementary File 2). We used uncorrected p-distances because they yield better or similar results when compared to other nucleotide substitution models, such as Kimura 2-parameter (Collins et al., Reference Collins, Boykin, Cruickshank and Armstrong2012; Srivathsan and Meier, Reference Srivathsan and Meier2012). Intra- and interspecific distances were then represented in a boxplot for each evaluated genus, using the base R function ‘boxplot()’. This allows the automatic identification of outliers, which represent comparisons between two sequences whose distances fall outside the extent of the whiskers (fig. 2).
Example of a boxplot graph, indicating its parts. The outliers are represented as pink dots. The horizontal dotted line represents the cut-off area we delimited for selecting outliers for visual inspection in this genus. The boxplots generated illustrate the lower (Q1) and upper (Q3) quartiles as the two parts of the box, divided in the middle by the median value of the observed data. The whiskers represent ±1.5 Interquartile Range (IQR), the range from the lower limit of the boxplot (25%) to the upper limit of the boxplot (75%).

The boxplots allow visualisation of the Barcode gap, which were classified into one of the following three categories: Good, when there was no overlap between intraspecific and interspecific boxplots; Intermediate, when there was an overlap between boxplot whiskers only; and Poor, when the boxplot boxes overlapped (Badotti et al., Reference Badotti, de Oliveira, Garcia, Vaz, Fonseca, Nahum, Oliveira and Góes-Neto2017; Bianchi and Gonçalves, Reference Bianchi and Gonçalves2021a).
Many of the boxplot graphs showed at least one outlier. To analyse these, we listed the intraspecific outliers above the upper whisker limit, and the interspecific outliers below the lower whisker limit (Supplementary Files 3–4). These were chosen due to their potential overlap with interspecific distances and intraspecific distances, respectively. Supplementary file 5 lists all the genera with outliers and how representative they are concerning the number of potential comparisons and sequences available.
Finally, to demonstrate the potential of outlier comparisons in detecting taxonomic inconsistencies, we conducted a detailed examination of select outliers for Aeolothrips Haliday, 1836 and Frankliniella Karny, 1910. These genera were chosen due to the abundance of available sequences, their economic importance and their history of challenging taxonomy.
Probability of correct identification (PCI) analysis
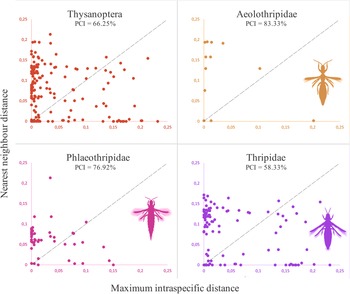
To evaluate if the available sequences in BOLD allow for the correct identification of COI sequences within Thysanoptera, we calculated the PCI (Supplementary file 6) utilising database 2. The PCI is a ‘discrete species assignment’ and considers the maximum intraspecific distance and the minimum interspecific distance (or nearest-neighbour distance) for each recognised species (Erickson et al., Reference Erickson, Spouge, Resch, Weigt and Kress2008). Then, these values are visualised in a scatterplot, where each dot represents a species name (Collins and Cruickshank, Reference Collins and Cruickshank2012). By drawing in the graph a line where x = y, it is possible to divide the species dots between two groups. Those above the x = y line have the nearest neighbour distance higher than the maximum intraspecific distance, and thus are considered to provide a ‘correct’ identification (since there is a clear gap between the species and the closest one, thus a clear delimitation of that species). Those dots below the x = y line have the nearest neighbour distance lower than the maximum intraspecific distance, and thus are considered to provide an ‘incorrect’ identification (since there is an overlap between the species and the closest neighbour, therefore a query sequence could fall in this overlap and have an uncertain identity). By calculating the number of points above the line in relation to the total number of points in the graph, it is possible to calculate the PCI for a given taxon. Thus, PCI calculations were performed for Thysanoptera as a whole and for three families (Aeolothripidae, 12 species names; Phlaeothripidae, 52 species names; and Thripidae, 96 species names).
Results
Representativity of Thysanoptera data on BOLD
A total of 30,581 sequences were obtained from BOLD, of which about one third had any image record, and only 5% were barcode compliant. After removing non-COI sequences and those lacking species identification (steps 1 and 2 of the filtering procedure), 11,096 sequences remained, representing seven families, 115 genus labels and 297 species labels (Table 1). The overall representativity of these sequences was low, with less than 15% of genera and 5% of valid thrips species (sensu ThripsWiki, 2023) (Table 3). Representativity of species varied in each family and subfamily, but most families had only a third or less of their genera represented in BOLD (Table 4).
Number of Thysanoptera taxa with at least one sequence after filtering step 2 (database 1), compared to the number of taxa currently accepted in the order (following ThripsWiki 2023)

Number of Thysanoptera genera and species with at least one sequence after filtering step 2, compared to the number of genera and species currently accepted (following ThripsWiki 2023)

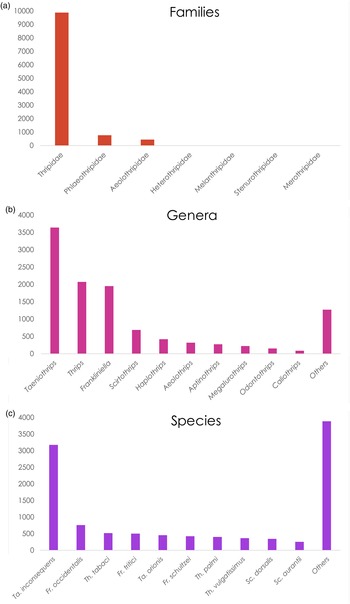
Out of the 11,096 sequences analysed, almost 90% belonged to Thripidae species (fig. 3A). Three genera comprise nearly 70% of the sequences: Taeniothrips Amyot & Serville, 1843 (32.81%), Thrips Linnaeus, 1758 (18.67%) and Frankliniella (17.59%) (fig. 3B). The species with most sequences in BOLD, Taeniothrips inconsequens (Uzel, 1895), represents almost 30% of all records in this database (fig. 3C). On the other hand, almost 70% of the species names have less than ten sequences each, and 27.6% of the species labels have a single COI sequence under their name (Supplementary file 7).
Distribution of Thysanoptera COI sequences (post filtering step 2) from BOLD, in different taxonomic levels. A: Family; B: Genus; C: Species.

We also identified errors in at least 35 records, such as species labels with outdated names, typos, and even a sequence belonging to a beetle species mistakenly listed as a member of Thysanoptera. A complete list of the errors detected on the sequences obtained in November 2021 can be found in Supplementary File 8.
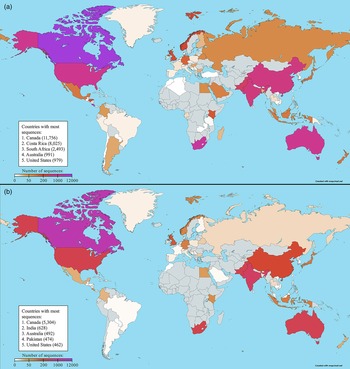
Geographical distribution data were available for 28,922 out of the 30,581 Thysanoptera sequences downloaded from BOLD (database 0), representing 69 countries which contributed with at least one sequence (fig. 4). Canada alone comprised about 40% of the total, with 11,756 sequences. The five countries with the most sequences (Canada, Costa Rica, South Africa, Australia and the United States) gather over 80% of the sequences (fig. 4A).
Heat maps showing the countries with most (purple) to least (white) Thysanoptera sequences added to BOLD. A: Geographical distribution of all Thysanoptera sequences downloaded from BOLD, before filtering (database 0). B: Geographical distribution of remaining Thysanoptera sequences, after all filtering steps (database 3). Countries in grey have zero sequences in the evaluated database. Image created with MapChart, available at https://www.mapchart.net.

Barcode gap
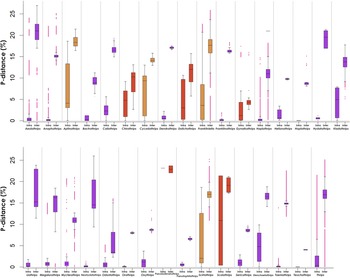
A total of 33 genera belonging to families Aeolothripidae, Phlaeothripidae and Thripidae could be evaluated for the presence and quality of Barcode gaps. Of these, 24 genera were classified as having a Good Barcode gap, four Intermediate, and five a Poor gap (fig. 5).
Boxplot graphs for 33 Thysanoptera genera, showing distribution of intraspecific and interspecific distances. Genera considered Good are in purple, Intermediate in orange and Poor in red. Pairwise comparisons which escape the area of significance indicated by the whiskers (±1.5 IQR), considered outliers, are represented in pink.

The median intraspecific distance varied widely among genera, with some presenting a median of 0% (i.e., Franklinothrips Back, 1912, Hoplothrips Amyot & Serville, 1843 and Orothrips Moulton, 1907), seven genera above 4%, and Pseudodendrothrips Schmutz, 1913 above 23%. The average median intraspecific distance was 2.49%.
The median interspecific distance also varied greatly among genera, with the lowest value being 3.44% for Odontothrips Amyot & Serville, 1843, and the highest value being 22.89% for Pseudodendrothrips. The average median interspecific distance was 13.27% (Table 5).
Barcode gap category and median intra- and interspecific distances of the evaluated genera

Boxplot outliers
Among the 33 analysed genera, 22 exhibited outliers in the boxplots, indicating pairwise comparisons that fell at the extreme ends of the observed data range (fig. 5); and 19 genera had at least one outlier in the range listed by our R script (Table 6, Supplementary Files 4–5).
List of genera with observed outliers in the boxplot graphs

a Outliers not listed by the R script.
b Outliers listed by the R script.
Aeolothrips outliers
We found 2256 intraspecific outliers for Aeolothrips, of which 1727 outliers (those above the dotted line on fig. 2) were visually inspected. These outliers exclusively involved comparisons between sequences of Aeolothrips intermedius Bagnall, 1934, which could be assigned to three distinct sequence clusters (Supplementary File 9).
We also observed low interspecific distances involving some Aeolothrips sequences. The only sequence identified as Aeolothrips melaleucus Haliday, 1852 (BOLD ID: GBMIN39680-13) exhibited distances ranging from 0.17 to 1.73% when compared to sequences of Aeolothrips fasciatus (Linnaeus, 1758), whose highest observed intraspecific distance was 2.92%. Similarly, two entries of Aeolothrips mongolicus Pelikan, 1985 (BOLD ID: GBMIN91243-17 and GBMIN91244-17) displayed distances varying from 0.15 to 4.85% when compared to sequences of A. intermedius, and they even clustered with some A. intermedius sequences within the same BIN (BOLD:AAU0572).
Frankliniella interspecific outliers
In the case of Frankliniella, a total of 16,717 interspecific outliers were identified, out of which 5403 (the ones which directly overlapped with the intraspecific boxplot) were considered for analysis. We observed outlier comparisons between five species pairs (Table 7). Moreover, the single sequence identified as F. minuta (Moulton, 1907) (BOLD ID: GBA8033-12) was identical to several sequences of F. schultzei (Trybom, 1910). Similarly, sequences labelled as F. citripes Hood, 1916 (BOLD ID: GBA8030-12) and F. borinquen Hood, 1942 (BOLD ID: GBMHT2007-19) exhibited very low distances when compared to F. insularis (Franklin, 1908) and F. occidentalis (Pergande, 1895), respectively. A complete list of the outlier comparisons between Frankliniella sequences is available in Supplementary File 9.
Frankliniella species with analysed interspecific outlier comparisons

PCI
The highest PCI value was observed for Aeolothripidae, with 83.33% of species labels allowing for ‘correct’ identifications (=maximum intraspecific distance < nearest neighbour distance). Meanwhile, the lowest value was observed for Thripidae, with 58.33% of species labels allowing for ‘correct’ identifications (fig. 6). The complete list of species names evaluated, and their maximum intraspecific and nearest neighbour distance values, can be found in Supplementary File 10.
Probability of correct identification analysis for order Thysanoptera, and for Aeolothripidae, Phlaeothripidae and Thripidae. Each dot represents a species, and dots above the dashed line represent species where a correct identification, using the evaluated COI sequences as reference, would be possible (maximum intraspecific distance < nearest neighbour distance).

Discussion
Thysanoptera data on BOLD
While there were over 30,000 sequences available on BOLD for Thysanoptera in November of 2021, only about a third of them matched the criteria to be included in the Barcode gap and PCI analyses performed in this work; moreover, the sequences we utilised have a very limited representativity for Thysanoptera genera and species (about 15 and 5% of valid taxa, respectively). This is similar to what was observed for Pentatomomorpha (about 6% of valid species; Bianchi and Gonçalves, Reference Bianchi and Gonçalves2021a) and Orthoptera (about 3% of valid species; Timm et al., Reference Timm, Gonçalves, Valente and Deprá2022), but much less than what is available for insect groups with a higher focus on molecular studies, such as Apidae (around 17% of valid species; Gonçalves et al., Reference Gonçalves, Françoso and Deprá2022) and Lepidoptera (almost two-thirds of valid species; Mutanen et al., Reference Mutanen, Kivelä, Vos, Doorenweerd, Ratnasingham, Hausmann, Huemer, Dincă, van Nieukerken, Lopez-Vaamonde, Vila, Aarvik, Decaëns, Efetov, Hebert, Johnsen, Karsholt, Pentinsaari, Rougerie, Segerer, Tarmann, Zahiri and Godfray2016). The usage of COI in Thysanoptera is usually focused on identification or population studies of a few pest species (e.g., Leão et al., Reference Leão, Spadotti, Rocha, Lima, Tavella, Turina and Krause-Sakate2017; Chakraborty et al., Reference Chakraborty, Singha, Kumar, Pakrashi, Kundu, Chandra, Patnaik and Tyagi2019; further references in Ghosh et al., Reference Ghosh, Jangra, Dietzgen and Yeh2021).
Despite fungivorous thrips species representing about 50% of the current diversity in the order, most of them lack sequences in BOLD. For example, there is no molecular information for the single extant species of Uzelothripidae, whose relationships within the order are still unknown. Subfamily Idolothripinae, which is the only group of thrips able to ingest and process whole fungal spores, is also underrepresented in BOLD.
Many sequenced specimens also lack any image records, and the available digital photographs were taken on a stereomicroscope or without enough magnification to examine thrips morphological traits. While it is possible to identify potential species units by utilising only the molecular data, for many taxa, including thrips, most species are still defined only by morphological traits. A good molecular library can work independently from morphology data, but we are still very far from using the BOLD database as a reliable identification tool for Thysanoptera. The lack of good quality pictures associated with the sequences or even voucher specimens hinders the possibility of reviewing and correcting potential misidentification. The lack of sequence metadata supporting taxonomic identification plays against the basic scientific principle of reproducibility (Bianchi and Gonçalves, Reference Bianchi and Gonçalves2021b) and compromises the utility of reference sequences.
While many countries contributed sequences to BOLD's Thysanoptera database, most of these sequences are concentrated in a small number of countries (fig. 4). Most of Africa and several countries in Asia, Europe and Latin America do not have any data added to BOLD. After filtering our data, all sequences from 15 countries were removed, and the remaining data are even more concentrated on Canada, the largest source of sequenced thrips specimens.
Barcode gap
A Good Barcode gap was observed for most of the genera, allowing species identification for these taxa based on this gap. However, many of them also had multiple outliers, which could potentially cloud identification efforts by increasing the observed intraspecific and interspecific ranges, creating overlaps. While the median intraspecific distance was below 1% in most genera classified as Good, both Kladothrips Froggatt, 1906 and Stenchaetothrips Bagnall, 1926 had a median intraspecific distance above 4%. If one were to use an arbitrary cut-off value to separate sequences into species for these groups (e.g., 2–3%; Hebert et al., Reference Hebert, Cywinska, Ball and deWaard2003), they would split a single species into different names. We recommend caution in using arbitrary distance values for thrips species delimitations without a proper sampling and previous evaluation of the intraspecific diversity of the target group.
The median intraspecific distance in genera with Intermediate or Poor gaps was high in comparison to those genera with Good gaps, and in those cases the Barcode gap may not be a reliable tool for species delimitation. Within the genera with Intermediate Barcode gap, Frankliniella and Scirtothrips Shull, 1909 have a high number of species distributed worldwide (236 and 108, respectively; ThripsWiki 2023) as well as complex taxonomy (Mound and Palmer, Reference Mound and Palmer1981; Cavalleri and Mound, Reference Cavalleri and Mound2012), and some potential cryptic species (Rugman-Jones et al., Reference Rugman-Jones, Hoddle and Stouthamer2010; Dickey et al., Reference Dickey, Kumar, Hoddle, Funderburk, Morgan, Jara-Cavieres, Shatters, Osborne and McKenzie2015).
Boxplot outliers
The Barcode gap analysis resulted in frequent outlier comparisons, which can demonstrate the necessity of re-examining the sequences involved or even a taxonomic revision of some groups, especially when there are overlaps between intraspecific and interspecific distances.
For A. intermedius, one sequence (BOLD ID: GBMNC48112-20) had very high distances (above 20%) when compared to most the other sequences identified as A. intermedius (Supplementary File 9), suggesting this sequence is not conspecific with the other A. intermedius specimens. The other two observed sequence clusters also separate into different BINs (Group 1 = BOLD:ACD4587; Group 2 = BOLD:AAZ8618 and BOLD:AAU0572; see Supplementary File 9 for full composition of these groups), which indicates that what is currently identified morphologically as A. intermedius may represent three or four distinct species when utilising this COI fragment as reference. Tyagi et al. (Reference Tyagi, Kumar, Singha, Chandra, Laskar, Kundu, Chakraborty and Chatterjee2017) found support for two species within A. intermedius collected from India, when conducting single-locus delimitation. We also observed that the single sequence of A. melaleucus (BOLD ID: GBMIN39680-13) and the two sequences of A. mongolicus (BOLD ID: GBMIN91243-17 and GBMIN91244-17) need revision, as they may represent specimens of A. fasciatus and A. intermedius, respectively. None of these specimens have photos on BOLD, so we are unable to compare their morphologies to see if they match the identity suggested by molecular data.
Regarding Frankliniella, we suggest that at least the sequences GBMHT2007-19, GBA8030-12, and GBA8033-12 (labelled F. borinquen, F. citripes and F. minuta, respectively) are misidentified. Unfortunately, there are no available images of these records to verify their identity.
Taxonomic incongruencies may be the most probable explanation for many of the observed high intraspecific distances and outliers. Misidentification of thrips species is frequent, especially in groups with high reliance on minute and similar looking morphological characters, such as Frankliniella and Scirtothrips. Alternatively, cryptic species (i.e., when distinct species are lumped under the same name due to a lack of morphological, ecological or biological distinction) could also explain a high intraspecific variation, due to molecular divergence that has not been translated into phenotypic differences yet (Struck et al., Reference Struck, Feder, Bendiksby, Birkeland, Cerca, Gusarov and Dimitrov2018; Struck and Cerca De Oliveira, Reference Struck and Cerca De Oliveira2019). However, we cannot discard the possibility of the taxonomy being correct, and the high intraspecific variation in COI being explained by other underlying causes. Geographic distribution and events can have an influence, by allowing or limiting contact and genetic exchange between different populations. The presence of parasites able to affect the host's reproduction, such as Wolbachia bacteria, could also influence the genetic composition of a species (Xiao et al., Reference Xiao, Wang, Murphy, Cook, Jia and Huang2012). Further studies can explore in more detail these or other potential explanations to the observed variation, but it is important to consider all available hypotheses and test them when reviewing the highly diverging sequences.
PCI
The PCI analysis indicates that in over 30% of the cases, identifying Thysanoptera species using the sequences as a reference library could lead to incorrect names, if using the ‘nearest neighbour’ distance value as a cut-off. This is worrisome especially for Thripidae, the second largest family within the order and the one with the most sequences in BOLD: more than 40% of the species names analysed returned as ‘incorrect’ identifications. Furthermore, many of the Thripidae species labels with intraspecific and interspecific distances overlapping belong to large genera, with complex taxonomy (e.g., Frankliniella, Scirtothrips, Thrips). This could support the hypothesis of incorrect identifications of some reference specimens included in BOLD, but the possibility that multiple cryptic species may be under the same name cannot be discarded (Rebijith et al., Reference Rebijith, Asokan, Krishna, Ranjitha, Krishna Kumar and Ramamurthy2014; Dickey et al., Reference Dickey, Kumar, Hoddle, Funderburk, Morgan, Jara-Cavieres, Shatters, Osborne and McKenzie2015; Tyagi et al., Reference Tyagi, Kumar, Singha, Chandra, Laskar, Kundu, Chakraborty and Chatterjee2017; see discussion above for other potential causes).
Curiously, Haplothrips Amyot & Serville, 1843 (PCI = 66.67%) and Thrips (PCI = 45.45%), despite their low PCI values, were both considered Good in the Barcode gap analysis, although with many outlier comparisons each. This suggests that most of the sequences within these genera have low enough distances for observing a clear Barcode gap between species; however, the PCI analysis can detect when there are a single or few sequences with a high intraspecific distance or low interspecific distance to another sequence.
The PCI analysis does not identify the causes for ‘incorrect identifications’ but can be used to detect taxa with a low percentage of correct identifications, which can then be further explored to identify such causes. A few potential causes for the ‘incorrect identifications’ include identification errors in the reference sequences, taxonomic incongruencies, human error during DNA extraction, sequencing or upload to databases, among others (Mutanen et al., Reference Mutanen, Kivelä, Vos, Doorenweerd, Ratnasingham, Hausmann, Huemer, Dincă, van Nieukerken, Lopez-Vaamonde, Vila, Aarvik, Decaëns, Efetov, Hebert, Johnsen, Karsholt, Pentinsaari, Rougerie, Segerer, Tarmann, Zahiri and Godfray2016).
Conclusion
Undoubtedly BOLD serves as a valuable tool for various molecular studies, offering a freely accessible COI sequence library for many taxa and enabling specimen identification and species delimitation. However, caution is advised when using BOLD data, particularly for Thysanoptera, as the representativity of thrips species in the database is low, with the majority lacking COI data. Additionally, the sampling effort has been limited to specific regions, restricting the usefulness of BOLD as a reference database for many geographical areas. Our analysis revealed a clear Barcode gap for most genera, yet numerous potential misidentifications and cryptic diversity were identified. We propose prioritising non-destructive DNA extraction methods and improving the photographic record to enhance taxonomic analysis. The hardest part – creating a global and freely accessible database of Barcode data – is done. It is up to us, researchers who use this database and populate it with new data, to work on identifying and correcting the inconsistencies and limitations currently present in BOLD, so that it can reach its full potential as a DNA-based species identification tool.
Supplementary material
The supplementary material for this article can be found at https://doi.org/10.1017/S0007485323000391.
Acknowledgements
MFL has received a doctorate fellowship from Coordenação de Aperfeiçoamento de Pessoal de Nível Superior (CAPES) during the development of this work. LTG was supported by a doctorate fellowship from Conselho Nacional de Desenvolvimento Científico e Tecnológico (CNPq).
Competing interests
None.