


Introduction
As one of the most common and abundant minerals, calcium (Ca) serves numerous essential functions within the human body. It is not only crucial for maintaining bone health but also plays a key role in regulating cardiovascular metabolism and neuroendocrine-immune function(Reference Harahap, Landrier and Suliburska1–Reference Terrell, Choi and Choi3). Data from the NHANES database reveal that over 50% of elderly men and nearly 70% of elderly women in the United States regularly use Ca supplements(Reference Mangano, Walsh, Insogna, Kenny and Kerstetter4). Data from both the United States and China have shown a trend of gradual increase in the daily dietary calcium intake of residents in recent years(Reference Yu, Li, Ba, Veldheer, Sun and Geng5,Reference Zhang, Wang, Wang, Zhang, Du and Su6) . Concurrently, research on the impact of Ca supplementation on human health has expanded beyond the scope of skeletal biology, with growing recognition of its potential benefits for cardiovascular and cerebrovascular metabolic health(Reference Kuehn7–Reference Tankeu, Ndip Agbor and Noubiap9).
Cardiovascular and cerebrovascular diseases are among the leading causes of mortality worldwide(Reference Alahmad, Khraishah, Royé, Vicedo-Cabrera, Guo and Papatheodorou10). Some meta-analyses claimed that Ca supplementation might positively affect risk factors associated with cardiovascular and cerebrovascular diseases, such as leading to improvements in blood pressure(Reference Allender11), blood lipids(Reference Morvaridzadeh, Agah, Alibakhshi, Heydari, Hoseini and Palmowski12), blood sugar levels(Reference Onakpoya, Perry, Zhang and Ernst13), and body weight(Reference Onakpoya, Perry, Zhang and Ernst13). Nevertheless, other research findings indicated that Ca supplementation may have a negative impact on cardiovascular health. A cohort study linked Ca supplementation to an elevated risk of coronary artery calcification(Reference Anderson, Kruszka, Delaney, He, Burke and Alonso14) (risk ratio (RR): 1.22; 95% confidence interval (CI): 1.07–1.39). Moreover, in a randomised controlled trial (RCT), participants assigned to Ca supplementation experienced a higher incidence of vascular events, including myocardial infarction (MI), stroke, and sudden death, than those assigned to placebo (RR: 1.66; 95% CI: 1.15–2.40)(Reference Bolland, Barber, Doughty, Mason, Horne and Ames15). In a subsequent meta-analysis of available trial data, it was reported that Ca supplements, with or without vitamin D, increased the risk of MI and stroke (RR: 1.15; 95% CI: 1.03–1.27)(Reference Bolland, Grey, Avenell, Gamble and Reid16).
The combined use of Ca and vitamin D (CaD) was a common clinical regimen. As a precursor to a fat-soluble hormone, vitamin D (VD) exerts a range of physiological effects, including its role in bone health(Reference Dattola, Silvestri, Bennardo, Passante, Scali and Patruno17) and its regulatory effects on glucose and lipid metabolism(Reference Chen, Zhou, Yan, Chen, Wang and Mo18–Reference Umar, Sastry and Chouchane22). The Women’s Health Initiative study revealed that long-term supplementation (seven years) with CaD did not significantly reduce the incidence of MI, coronary heart disease, mortality, and stroke(Reference Hsia, Heiss, Ren, Allison, Dolan and Greenland23). Nevertheless, further analysis of the study’s results demonstrated that CaD supplementation reduced the risk of heart failure in the low-risk postmenopausal female population(Reference Donneyong, Hornung, Taylor, Baumgartner, Myers and Eaton24).
In short, the impact of Ca on metabolism remains a controversial topic, and compared to Ca supplementation alone, further analysis of the clinical benefits of CaD supplementation is also required. In this umbrella meta-analysis, we aim to systematically investigate the effects of Ca or CaD supplementation on cardiovascular and cerebrovascular metabolism. First, we conducted a rigorous quality assessment of the meta-analysis that met the inclusion criteria. Second, we updated the existing meta-analysis with the latest clinical data. Finally, we constructed a more comprehensive evidence map, providing more definitive evidence for the clinical application.
Methods
The protocol of the present study was registered in PROSPERO (registration: CRD42024576917), and we followed the Preferred Reporting Items for Systematic Reviews and Meta-analysis (PRISMA) guidelines(Reference Moher, Liberati, Tetzlaff and Altman25) to carry out this research.
Search strategy
To investigate the effects of Ca or CaD supplementation on cardiovascular and cerebrovascular health, two researchers (LY and LG) independently conducted searches on four major databases (Embase, Web of Science, PubMed, and Cochrane Library). The publication date of the studies was set from inception to 31 January 2025. We searched for eligible meta-analyses and individual RCTs to update the identified meta-analysis. Details of the specific retrieval strategy are provided in supplementary Table 1.
Selection criteria
Initially, a preliminary screening was conducted based on the titles and abstracts of articles to select the anticipated studies for inclusion (see flowchart in Figure 1). Subsequently, a comprehensive full-text review was conducted on the articles that met the preliminary screening criteria. The inclusion criteria for the studies were as follows: (1) the intervention involved Ca supplementation alone or CaD supplementation; (2) the control group received either a placebo or standard treatment; (3) the evaluation included at least one of the following indicators: incidence of cardiovascular disease (CVD) and cerebrovascular disease, mortality, and risk factors for disease (blood pressure, weight, blood lipids, blood sugar, inflammatory factors, etc.); and (4) the study types were based on RCT meta-analyses and original RCT studies. Exclusion criteria were rigorously applied to studies that: (1) were published in languages other than English; (2) did not adhere to the RCT methodology; (3) lacked comprehensive data, including detailed intervention strategies and outcomes; and (4) did not stipulate specific parameters such as the type and dosage of Ca or CaD supplementation. All discrepancies were resolved through consensus among the research team.
Flowchart of study selection.

Data extraction
The key information was extracted from the eligible meta-analyses and primary studies. For the meta-analyses, the following details were recorded: the name of the lead author, publication year, study design, medical condition, number of participants, publication bias, heterogeneity (I 2), and the risk estimates. For primary studies, the following details were included: the name of the lead author, publication year, study design, medical condition, reported intervention calcium dose, number of participants, and the statistical measures employed.
Statistical analysis
Multiple metrics were estimated for each RCT included in the meta-analyses. The level of heterogeneity among the studies was quantified using the Q statistic and the I 2 metric. Appropriate meta-analysis models were selected based on the heterogeneity of the studies. When statistical heterogeneity was found to be significant (I 2 > 50%), a random-effects model was used; conversely, when statistical heterogeneity was not deemed to be significant (I 2 ≤ 50%), the fixed-effects model was chosen, and the associated 95% CIs were calculated. Small-study effects were assessed using Egger’s regression test. For the primary studies, data expressed in other formats were converted to standard deviations (SDs). The χ 2 test was used to conduct an excess significance test, aiming to investigate whether the observed number of studies with nominally significant results (O) (‘positive’ studies, P < 0.05) differed from the expected number of significant results (E). The expected number of significant studies for each meta-analysis was calculated by summing the statistical power estimates for each component study, and the effect size of the largest study in each meta-analysis was used as the plausible effect size in each meta-analysis. All statistical analyses were carried out using STATA v.16.0 and R free software v.3.4.4.
The pooled estimates shown in Figures 2–4 were calculated from extracted RCT-level or comparison-level data, as appropriate, rather than by statistically combining pooled estimates from previously published meta-analyses. Endpoint-specific forest plots are provided in supplementary Figs. S1–S65; these plots display the contributing RCT comparisons and include Ca dose-stratified analyses and CaD meta-analyses where applicable. Funnel plots for assessing small-study effects are provided separately in supplementary Figs. Sa1–Sa65.
Outcome-level summary plot of pooled RCT estimates for calcium supplementation and calcium plus vitamin D supplementation on cardiovascular morbidity, cerebrovascular morbidity, and mortality.
Note: Each row represents an endpoint-level pooled estimate. The number of independent RCTs contributing to each estimate and the corresponding trial-level forest plot are shown alongside the endpoint. Detailed forest plots displaying the independent RCTs are provided in supplementary Figs. S1–S18.

Outcome-level summary plot of pooled RCT estimates for calcium supplementation and calcium plus vitamin D supplementation on blood pressure and obesity-related parameters.
Note: Each row represents an endpoint-level pooled estimate. The number of independent RCTs contributing to each estimate and the corresponding trial-level forest plot are shown alongside the endpoint. Detailed forest plots displaying the independent RCTs are provided in supplementary Figs. S19–S37.

Fig. 3. Long description
The table presents outcome-level summary plots of pooled RCT estimates for calcium supplementation and calcium plus vitamin D supplementation on blood pressure and obesity-related parameters. It includes data on diastolic blood pressure, systolic blood pressure, abdominal circumference, hip circumference, waist circumference, waist circumference to hip circumference ratio, body mass index (BMI), body fat, body weight, and lean mass. The table has 12 rows and 7 columns. Column headers are Outcome, Intervention, Effects size and 95% CI, Studies, n Participants, n, Effects size (95% CI), P-value, and Supplementary Forest Plot. Each row provides specific data for different outcomes and interventions. For example, the first row shows data for diastolic blood pressure with interventions Ca+VD and Ca, including the number of studies, participants, effect size with 95% confidence interval, and P-value. The table provides a comprehensive comparison of the effects of these supplements on various health parameters.
Outcome-level summary plot of pooled RCT estimates for calcium supplementation and calcium plus vitamin D supplementation on glucose metabolism, lipid profiles and inflammatory markers.
Note: Each row represents an endpoint-level pooled estimate. The number of independent RCTs contributing to each estimate and the corresponding trial-level forest plot are shown alongside the endpoint. Detailed forest plots displaying the independent RCTs are provided in supplementary Figs. S38–S65.

Quality assessment
The outcomes and quality of evidence for different interventions were demonstrated by creating evidence maps. The quality of the evidence was evaluated using the GRADE (Grading of Recommendations Assessment, Development and Evaluation) method (GRADE pro GDT) (https://gdt.gradepro.org/app/) and classified as high, moderate, low, or very low(Reference Farah, Alsawas, Mainou, Alahdab, Farah and Ahmed26).
AMSTAR 2 was used to assess the methodological quality of the included systematic reviews and meta-analyses. Item-level judgements were made for all 16 items, with particular attention to the seven critical domains. Overall confidence ratings were classified as high, moderate, low, or critically low according to AMSTAR 2 guidance. When a review reported multiple eligible outcomes, AMSTAR 2 results were summarised at the outcome-comparison level; therefore, the reported counts refer to outcome-specific assessments rather than unique review articles (supplementary Table 8). Two researchers (LG and LY) independently evaluated the quality of the publications, with any discrepancies resolved through consultation.
Results
This umbrella review assessed the effects of calcium supplementation (35 meta-analyses) and calcium plus vitamin D supplementation (34 meta-analyses) on cardio-cerebrovascular outcomes and related risk factors (Table 1). As illustrated in Figure 1, the preliminary search yielded 728 articles, of which 685 were excluded upon review of the title and abstract. Following a review of the full-text content, 35 meta-analysis articles (comprising 118 meta-analyses) and 154 RCT articles were included in the umbrella review (supplementary list 7).
Association of calcium supplementation with cardio-cerebrovascular outcomes and related risk factors, with GRADE certainty ratings

Table 1. Long description
Panel A: The table lists various outcomes and risk factors related to calcium supplementation. Columns include the number of meta-analyses, effect size, certainty, and other relevant data. Panel B: The table details specific outcomes such as cardiovascular disease, cerebrovascular disease, myocardial infarction, blood pressure, obesity parameters, and inflammatory factors. Each row provides data on the number of meta-analyses, effect size, certainty, and other metrics. Panel C: The table includes columns for interventions, comparisons, participants, effect size, certainty, and additional data points. Each row corresponds to a specific study or meta-analysis.
BMI, body mass index; Ca, calcium; CHD, coronary heart disease; CRP, C-reactive protein; CVD, cardiovascular disease; DBP, diastolic blood pressure; FBG, fasting blood glucose; HDL, high-density lipoprotein; Hs-CRP, high-sensitivity C-reactive protein; IL-6, interleukin-6; LDL, low-density lipoprotein; MI, myocardial infarction; NA, not available; NR, not relevant (estimated expected number is larger than observed number and there is no evidence of excess significance); PBG, postprandial blood glucose; RR, risk ratio; SBP, systolic blood pressure; SMD, standardised mean difference; TNF-α, tumour necrosis factor; VD, vitamin D; VLDL, very low-density lipoprotein; W:H, waist circumference: hip circumference.
† P value for the pooled effect estimate.
* From Egger’s regression asymmetry test. It was used to evaluate the small-study effects.
‡ Observed and expected number of significant studies using effect of largest study (smallest SE) of each meta-analysis as plausible effect size.
§ Using χ2 test to analyse whether the observed number of studies with significant results differed from the expected number of significant studies. All statistical tests two sided.
Figures 2–4 present outcome-level summary plots of pooled estimates derived from individual RCTs. For each endpoint, the corresponding endpoint-specific forest plot is provided in supplementary Figs. S1–S65, showing the contributing RCT comparisons, including Ca dose-stratified analyses and CaD meta-analyses where applicable.
Methodological quality, publication bias, and certainty of evidence
The 35 included meta-analysis articles comprised 118 outcome-specific meta-analytic comparisons across multiple outcomes. Because several review articles reported more than one eligible outcome, AMSTAR 2 ratings were summarised at the outcome-comparison level. Among these 118 outcome-specific assessments, nine were rated as high confidence(Reference Dickinson, Nicolson, Cook, Campbell, Beyer and Ford27–Reference Chandler, Wang, Zhang, Sesso, Moorthy and Obi30), 43 as low confidence(Reference Onakpoya, Perry, Zhang and Ernst13,Reference Bolland, Avenell, Baron, Grey, MacLennan and Gamble31–Reference Sim, Teo, Teo, Syn, Li and Yeo42) , and 66 as critically low confidence(Reference Allender11,Reference Morvaridzadeh, Agah, Alibakhshi, Heydari, Hoseini and Palmowski12,Reference Bolland, Avenell, Baron, Grey, MacLennan and Gamble31,Reference Cormick, Betran, Romero, Cormick, Belizán and Bardach33,Reference Sim, Teo, Teo, Syn, Li and Yeo42–Reference Trowman, Dumville, Hahn and Torgerson58) . These counts should not be interpreted as the number of unique review articles in each AMSTAR 2 category. Detailed item-level judgements are provided in supplementary Table 8.
Publication bias and small-study effects were evaluated by visual inspection of funnel plots and Egger’s regression tests. The funnel plots, which are provided in supplementary Figs. Sa1–Sa65, suggested possible asymmetry for several outcomes, and the corresponding Egger’s P values are reported in Table 1.
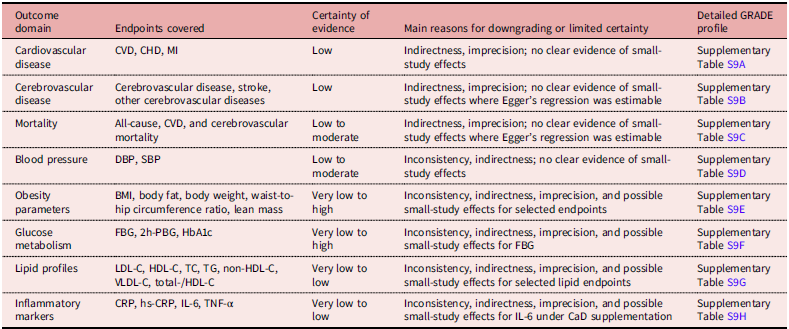
Standard GRADE Summary of Findings tables were prepared for each outcome domain and are provided in supplementary GRADE Tables S9A–9H. These tables summarise the number of contributing RCTs, effect estimates, and certainty assessment. A concise summary of the GRADE certainty ratings is presented in this Results section and in Table 2.
Summary of GRADE certainty by outcome domain

Table 2. Long description
A table summarizing GRADE certainty ratings by outcome domain. The table has 8 rows and 4 columns. The columns are labeled Outcome domain, Endpoints covered, Certainty of evidence, Main reasons for downgrading or limited certainty, and Detailed GRADE profile. The rows are labeled with different outcome domains and their respective data. Row 1: Cardiovascular disease, CVD, CHD, MI, Low, Indirectness, imprecision; no clear evidence of small-study effects, Supplementary Table S9A. Row 2: Cerebrovascular disease, Cerebrovascular disease, stroke, other cerebrovascular diseases, Low, Indirectness, imprecision; no clear evidence of small-study effects where Egger’s regression was estimable, Supplementary Table S9B. Row 3: Mortality, All-cause, CVD, and cerebrovascular mortality, Low to moderate, Indirectness, imprecision; no clear evidence of small-study effects where Egger’s regression was estimable, Supplementary Table S9C. Row 4: Blood pressure, DBP, SBP, Low to moderate, Inconsistency, indirectness; no clear evidence of small-study effects, Supplementary Table S9D. Row 5: Obesity parameters, BMI, body fat, body weight, waist-to-hip circumference ratio, lean mass, Very low to high, Inconsistency, indirectness, imprecision, and possible small-study effects for selected endpoints, Supplementary Table S9E. Row 6: Glucose metabolism, FBG, 2h-PBG, HbA1c, Very low to high, Inconsistency, indirectness, imprecision, and possible small-study effects for FBG, Supplementary Table S9F. Row 7: Lipid profiles, LDL-C, HDL-C, TC, TG, non-HDL-C, VLDL-C, total-/HDL-C, Very low to low, Inconsistency, indirectness, imprecision, and possible small-study effects for selected lipid endpoints, Supplementary Table S9G. Row 8: Inflammatory markers, CRP, hs-CRP, IL-6, TNF-α, Very low to low, Inconsistency, indirectness, imprecision, and possible small-study effects for IL-6 under CaD supplementation, Supplementary Table S9H.
Cardiovascular disease
The results of a meta-analysis involving 6,040 participants indicated a higher risk of CVD in participants assigned to Ca supplementation than in controls (RR: 1.323; 95% CI: 1.116, 1.569; P = 0.001). Another meta-analysis of CaD supplementation, involving 47,312 participants, showed no significant difference in CVD risk between CaD and control groups (RR: 0.999; 95% CI: 0.942, 1.060; P = 0.980). Subgroup analyses by disease clarified that Ca also had adverse effects on the incidence of MI (RR: 1.237; 95% CI: 1.003, 1.527; P = 0.047), whereas CaD supplementation did not demonstrate any significant impact. Subgroup analyses according to the reported intervention calcium dose showed that the 601–1,000 mg per day category was associated with an increased risk of CVD and MI (supplementary Table S10 and Figs. S1–S6).
For Ca and CaD supplementation, Egger’s regression test did not suggest significant small-study effects across all cardiovascular disease outcomes. These findings were visually consistent with the corresponding funnel plots and did not provide clear evidence of publication bias or small-study effects (supplementary Figs. Sa1–Sa6). The GRADE Summary of Findings table for cardiovascular outcomes, in which the overall certainty of evidence was rated as low, is provided in supplementary Table S9A and summarised in Table 2.
Cerebrovascular disease
The results of a meta-analysis involving 6,227 participants showed a higher risk of cerebrovascular disease in participants assigned to Ca supplementation than in controls (RR: 1.399; 95% CI: 1.054, 1.857; P = 0.002). Subgroup analysis by disease clarified that Ca supplementation was associated with an elevated risk of stroke incidence (RR: 1.489; 95% CI: 1.099, 2.016; P = 0.010) (Figure 2). Subgroup analyses according to the reported intervention calcium dose revealed that the 601–1,000 mg per day category was associated with an increased risk of cerebrovascular disease, including stroke (supplementary Table S10 and Figs. S7–S12).
For Ca and CaD supplementation, no significant small-study effects were detected across all cerebrovascular disease outcomes by Egger’s regression test, with the exception of other cerebrovascular diseases under CaD supplementation, for which Egger’s test could not be performed due to an insufficient number of studies. These findings were visually consistent with the corresponding funnel plots and did not provide clear evidence of publication bias or small-study effects (supplementary Figs. Sa7–Sa12). The GRADE Summary of Findings table for cerebrovascular outcomes, in which the overall certainty of evidence was rated as low, is provided in supplementary Table S9B and summarised in Table 2.
Mortality
The meta-analysis of mortality data revealed no statistically significant association between Ca or CaD supplementation and all-cause or cardio-cerebrovascular mortality (supplementary Table S10 and Figs. S13–S18).
Across all mortality outcomes, Egger’s regression test consistently indicated no significant small-study effects for either Ca or CaD supplementation, with the exception of cerebrovascular mortality under Ca supplementation, for which Egger’s test could not be performed due to an insufficient number of studies. The funnel plots for the remaining outcomes appeared visually symmetrical, providing no clear evidence of publication bias or small-study effects (supplementary Figs. Sa13–Sa18). The GRADE Summary of Findings table for mortality outcomes is provided in supplementary Table S9C and summarised in Table 2.
Blood pressure
The results of a meta-analysis involving 4,440 cases indicated that Ca supplementation exhibited a statistically significant reduction in diastolic blood pressure (DBP) (standardized mean difference (SMD): −0.215; 95% CI: −0.405, −0.026; P = 0.026) (Figure 3). A statistically significant reduction in both DBP and systolic blood pressure (SBP) was observed in studies with a reported intervention calcium dose of 601–1,000 mg per day (supplementary Table S10 and Figs. S19–S22).
For both Ca and CaD supplementation, Egger’s regression test revealed no significant small-study effects for either DBP or SBP, and the corresponding funnel plots appeared visually symmetrical, providing no clear evidence of publication bias or small-study effects (supplementary Figs. Sa19–Sa22). The GRADE Summary of Findings table for blood pressure outcomes is provided in supplementary Table S9D and summarised in Table 2.
Obesity parameters
Ca supplementation was found to significantly reduce body fat levels (SMD: −0.180; 95% CI: −0.350, −0.010; P = 0.038), whereas it was associated with a significant increase in waist-to-hip ratio (WHR) (SMD: 0.409; 95% CI: 0.003, 0.815; P = 0.048); The meta-analysis of CaD supplementation demonstrated a statistically significant reduction in body mass index (BMI) (SMD: −0.283; 95% CI: −0.555, −0.011; P = 0.041) and body fat (SMD: −0.194; 95% CI: −0.361, −0.026; P = 0.024) (Figure 3). A statistically significant reduction in body fat was observed in studies with a reported intervention calcium dose of 1,001–1,400 mg per day, whereas the 601–1,000 mg per day category was associated with a significant increase in WHR (supplementary Table S10 and Figs. Sa23–Sa37).
For obesity parameter outcomes, Egger’s regression test indicated statistically significant funnel plot asymmetry for BMI and hip circumference under CaD supplementation, as well as body fat and body weight under Ca supplementation (Egger’s P < 0.05), suggesting potential small-study effects for these specific outcomes; these results should therefore be interpreted with caution. No significant small-study effects were detected for the remaining obesity parameters under either intervention. The corresponding funnel plots were generally consistent with these findings (supplementary Figs. Sa23–Sa37). The GRADE Summary of Findings table for obesity parameters outcomes is provided in supplementary Table S9E and summarised in Table 2.
Glucose metabolism parameters
Ca supplementation was associated with a statistically significant increase in two-hour (2h) postload glycemia levels (SMD: 0.357; 95% CI: 0.065, 0.649; P = 0.016). Conversely, CaD supplementation demonstrated a statistically significant reduction in fasting blood glucose (FBG) (SMD: −0.623; 95% CI: −1.045, −0.201; P = 0.004) (Figure 4) (supplementary Table S10 and Figs. S38–S43).
For glucose metabolism outcomes, Egger’s regression test indicated statistically significant funnel plot asymmetry for FBG under both Ca and CaD supplementation (Ca: Egger’s P = 0.016; CaD: Egger’s P = 0.001), suggesting potential small-study effects. For 2h-PBG (postprandial blood glucose) under both interventions, Egger’s test could not be performed due to an insufficient number of studies. No significant small-study effects were detected for HbA1c under either Ca or CaD supplementation (all Egger’s P > 0.05) (supplementary Figs. Sa38–Sa43). The GRADE Summary of Findings table for glucose metabolism outcomes is provided in supplementary Table S9F and summarised in Table 2.
Lipid profile
Ca supplementation demonstrated a statistically significant reduction in total cholesterol (TC) (SMD: −0.412; 95% CI: −0.727, −0.097; P = 0.010) and total/HDL cholesterol levels (SMD: −2.406; 95% CI: −3.907, −0.904; P = 0.002). CaD also showed a statistically significant reduction in LDL-C (SMD: −0.225; 95% CI: −0.443, −0.008; P = 0.042), non-HDL-cholesterol (SMD: −0.906; 95% CI: −1.761, −0.051; P = 0.038), total/HDL-cholesterol levels (SMD: −0.548; 95% CI: −1.077, −0.019; P = 0.042), along with a significant elevation in HDL-C levels (SMD: 0.429; 95% CI: 0.195, 0.663; P < 0.001) (Figure 4) (supplementary Table S10 and Figs. S44–S57).
For lipid profile outcomes, statistically significant funnel plot asymmetry was detected for several outcomes, including LDL cholesterol under Ca supplementation, HDL cholesterol, total/HDL cholesterol, triglycerides, and total cholesterol under CaD supplementation, and total cholesterol under Ca supplementation (all Egger’s P < 0.05), suggesting potential small-study effects that warrant cautious interpretation. No significant asymmetry was detected for the remaining lipid outcomes, and Egger’s test could not be performed for non-HDL cholesterol under Ca supplementation due to insufficient studies (supplementary Figs. Sa44–Sa57). The GRADE Summary of Findings table for lipid profile outcomes is provided in supplementary Table S9G and summarised in Table 2.
Inflammatory factors
Ca supplementation was associated with a statistically significant increase in the levels of the inflammatory marker interleukin-6 (IL-6) (SMD: 1.603; 95% CI: 0.137, 3.068; P = 0.032) and tumour necrosis factor-alpha (TNF-α) (SMD: 0.885; 95% CI: 0.234, 1.536; P = 0.008) (Figure 4). Notably, a statistically significant elevation in IL-6 and TNF-α was observed in studies with a reported intervention calcium dose of 1,001–1,400 mg per day (supplementary Table S10 and Figs. S58–S65).
For inflammatory outcomes, significant funnel plot asymmetry was detected only for IL-6 under CaD supplementation (Egger’s P = 0.025), suggesting potential small-study effects that warrant cautious interpretation. All other inflammatory markers showed no significant asymmetry under either intervention (all Egger’s P > 0.05), and Egger’s test could not be performed for C-reactive protein (CRP) under Ca supplementation due to insufficient studies (supplementary Figs. Sa58–Sa65). The GRADE Summary of Findings table for inflammatory markers is provided in Supplementary Table S9H and summarised in Table 2.
Evidence map
Figure 5 presents the evidence map for calcium-based interventions with or without vitamin D on cardio-cerebrovascular outcomes and related risk factors. The certainty of evidence ranged from very low to high. Data for abdominal circumference were insufficient or unavailable in the evidence map, indicating an evidence gap for this outcome.
Evidence map of availability and appraisal of certainty of the evidence.

Discussion
Several clinical studies have carried out research regarding the role of Ca or CaD supplementation on cardio-cerebrovascular diseases and associated risk factors. However, the conclusions of these studies still remain controversial. Our findings indicated that Ca supplementation was associated with an increased incidence of cardio-cerebrovascular diseases, whereas CaD supplementation showed no statistically significant association with cardiovascular disease incidence. Neither Ca nor CaD supplementation significantly affected mortality. For cardiometabolic risk factors, Ca supplementation reduced DBP, TC, total/HDL cholesterol ratio, and body fat, but increased WHR, 2h postload glycemia, IL-6, and TNF-α. CaD supplementation was associated with reductions in BMI, body fat, FBG, LDL-C, non-HDL-C, and total/HDL cholesterol ratio, together with an increase in HDL-C.
The results of the meta-analysis indicated that the use of Ca supplementation was significantly associated with an increased incidence of cardio-cerebrovascular diseases. Subgroup analyses further demonstrated that the Ca supplementation was associated with an elevated incidence of stroke and MI. However, when Ca was co-administered with VD, no statistically significant association with the incidence of cardio-cerebrovascular diseases was observed. Regarding mortality, neither Ca supplementation alone nor in combination with VD demonstrated a statistically significant effect on all-cause mortality or cardio-cerebrovascular mortality. Subgroup analyses by reported intervention calcium dose showed that the 601–1,000 mg per day category was associated with an increased incidence of cardio-cerebrovascular diseases.
The potential adverse effects of Ca on cardiovascular health were predominantly attributed to its role in vascular calcification. Vascular calcification is a dynamic biological process governed by regulatory mechanisms. A previous cohort study reported an association between calcium intake from diet and supplements and the progression of coronary artery calcification, a finding that has been hypothesised to relate to calcium’s role as a phosphate binder, potentially facilitating the deposition of calcium–phosphate complexes within the vascular endothelium(Reference Klein59). This accumulation consequently increased the burden of atherosclerotic plaques(Reference Lee, Mintz, Matsumura, Zhang, Cao and Usui60), a process that accelerated vascular calcification and elevated mortality risk(Reference Block, Raggi, Bellasi, Kooienga and Spiegel61–Reference Russo, Miranda, Ruocco, Battaglia, Buonanno and Manzi63). Furthermore, the mechanism of vascular calcification is analogous to osteogenesis and is intimately intertwined with the bone mineralisation process(Reference Thompson and Towler64). Ca supplementation not only significantly increased bone density but also potentially facilitated vascular calcification, thereby increasing the prevalence rate of cardiovascular events(Reference Wu, Luo, Chen, Wang, Liu and Sun65). Additionally, transient hypercalcaemia was shown to induce a state of increase in hypercoagulability, thereby increasing the risk of thrombotic events. This further substantiates the hypothesis that Ca supplementation might exert adverse effects on cardiovascular health(Reference Mohammadifard, Gotay, Humphries, Ignaszewski, Esmaillzadeh and Sarrafzadegan66). A reduction in 25-OH-D levels was demonstrated to stimulate the expression of the renin gene and the proliferation of smooth muscle cells, which in turn activated the renin-angiotensin-aldosterone pathway. This resulted in elevated blood pressure, fibrosis, and left ventricular hypertrophy(Reference Gunta, Thadhani and Mak67,Reference Lutsey and Michos68) . A decline in 25-OH-D levels was associated with secondary hyperparathyroidism, increased production of pro-inflammatory cytokines, and heightened systemic inflammation. These changes potentially contributed to the development of arteriosclerosis, endothelial dysfunction, and adipose tissue inflammation, leading to elevated blood pressure, fibrosis, and left ventricular hypertrophy(Reference Faridi, Lupton, Martin, Banach, Quispe and Kulkarni69–Reference Sung, Liao, Lu and Wu72). The aforementioned inflammatory responses also promote infiltration of macrophages into the vascular wall, increased expression of cellular adhesion molecules, and depletion of endothelial progenitor cells, thereby elevating the risk of thrombosis and arteriosclerosis(Reference Michos, Cainzos-Achirica, Heravi and Appel73). In cases of cerebral aneurysms, cerebrovascular malformations, and strokes, the matrix exhibited significant instability(Reference Choquet, Trapani, Goitre, Trabalzini, Akers and Fontanella74,Reference Edwards and Bix75) . Conversely, VD was shown to stabilise the matrix by regulating various matrix metalloproteinases and their tissue inhibitors(Reference López-López, González-Curiel, Treviño-Santa Cruz, Rivas-Santiago, Trujillo-Paez and Enciso-Moreno76). Moreover, VD was demonstrated to reduce the incidence of neurodegenerative diseases by decreasing oxidative stress(Reference Skv, Abraham, Eshwari, Golla, Jhelum and Maity77), modulating neuronal inflammation, and minimising the disruption of the blood–brain barrier(Reference Sonar and Lal78). These protective mechanisms orchestrated neuroprotective effects, thus reducing the incidence of neurodegenerative diseases(Reference Nissou, Guttin, Zenga, Berger, Issartel and Wion79).
In a previously published meta-analysis, Myung(Reference Myung, Kim, Lee, Choi and Oh40) found that Ca supplementation increased the risk of CVD in healthy postmenopausal women. Similarly, Bolland(Reference Bolland, Grey, Avenell, Gamble and Reid16) concluded that Ca supplementation, whether combined with VD or not, was associated with an elevated risk of cardiovascular events, particularly MI. These findings were aligned with the results of our research. However, the findings of Lewis(Reference Lewis, Radavelli‐Bagatini, Rejnmark, Chen, Simpson and Lappe54) suggested that Ca supplementation, regardless of VD supplementation, did not increase the risk of coronary heart disease or all-cause mortality among postmenopausal elderly women. The discrepancies between the results of our study and those reported by Lewis might be attributed to variability in the populations included in the studies. In contrast, Chung(Reference Chung, Tang, Fu, Wang and Newberry80), in an updated systematic review and meta-analysis, concluded that calcium intake from dietary and/or supplemental sources within the tolerable upper intake range was not associated with CVD risk in generally healthy adults. Although this study utilised a prospective cohort dose-response meta-regression analysis, the results might be influenced by potential confounding factors, such as ecological bias and measurement errors in Ca exposure. In conclusion, the discrepancies among the results of different studies might be explained by the difference in types of studies conducted, the subjects involved, and the statistical methodologies employed.
The findings of our study indicated that Ca supplementation was associated with a significant reduction in DBP, whereas its effect on SBP was not statistically significant. It should be noted that these pooled estimates reflect scheduled trial assessments rather than acute post-dose responses; as Bristow(Reference Bristow, Gamble, Stewart, Horne and Reid81) demonstrated, transient post-dose haemodynamic changes may not be captured by follow-up clinic measurements. Therefore, the DBP reduction observed in our meta-analysis should be interpreted as an effect on blood pressure measured at scheduled trial assessments, and it does not exclude transient post-dose elevations or attenuation of the usual postprandial or diurnal fall in blood pressure. Inadequate dietary calcium intake may stimulate parathyroid hormone (PTH) secretion, which promotes renal calcitriol synthesis, increases calcium entry into vascular smooth muscle cells, and activates the renin-angiotensin-aldosterone system, collectively inducing vasoconstriction and elevating blood pressure(Reference He and Kh82–Reference Oinonen, Tikkakoski, Koskela, Eräranta, Kähönen and Niemelä86). Our findings were consistent with those of Morvaridzadeh(Reference Morvaridzadeh, Sepidarkish, Fazelian, Rahimlou, Omidi and Ardehali47); discrepancies with earlier studies(Reference Allender11,Reference Dickinson, Nicolson, Cook, Campbell, Beyer and Ford27,Reference Cormick, Ciapponi, Cafferata, Cormick and Belizán35,Reference Bucher45,Reference Van Mierlo, Arends, Streppel, Zeegers, Kok and Grobbee46,Reference Cappuccio, Elliott, Allender, Pryer, Follman and Cutler87) may reflect differences in publication year, sample size, and study population characteristics, including baseline blood pressure status.
The findings of our study indicated that combined Ca and VD supplementation had more pronounced effects on glucose and lipid metabolism and weight reduction compared with Ca supplementation alone, consistent with several previous meta-analyses(Reference Morvaridzadeh, Agah, Alibakhshi, Heydari, Hoseini and Palmowski12,Reference Chen, Ge, Li, Wu, Liu and Li29,Reference Li, Fan, Lu and Qi34,Reference Winzenberg, Shaw, Fryer and Jones48,Reference Hong, Lee, Woo, Om, Kwock and Kim52,Reference Booth, Huggins, Wattanapenpaiboon and Nowson56,Reference He, Yu, Zhou, Wang, Wu and Li88,Reference Hu, Tang, Sang, Tang, Li and Zheng89) . Regarding the underlying mechanisms, Ca modulates insulin signalling in target organs by regulating intracellular Ca concentrations, insulin receptor phosphorylation, and pancreatic β-cell secretory function(Reference Wu, Wei, Petersen, Ali, Wang and Bacaj90–Reference Ozcan and Tabas92), and may further attenuate pro-inflammatory cytokine expression linked to insulin resistance(Reference Ojuka93–Reference Wright, Hucker, Holloszy and Han95). Elevated PTH levels – a consequence of inadequate Ca intake – inhibit adipose tissue lipolysis and increase the risk of impaired glucose tolerance, whereas Ca supplementation suppresses circulating PTH and 1,25-dihydroxyvitamin D, thereby promoting fat breakdown(Reference Procopio, Magro, Cesario, Piovesan, Pia and Molineri96–Reference Breining, Pedersen, Kjolby, Hansen, Jessen and Richelsen100–Reference Paik, Curhan and Taylor102). VD exerts complementary effects through multiple pathways: obesity and insulin resistance are associated with VD deficiency due to sequestration within expanded adipose tissue and downregulation of VD-metabolising enzymes(Reference Pramono, Jocken and Blaak103); VD restores insulin sensitivity by modulating Ca flux, facilitating GLUT-4 dephosphorylation, and upregulating PPARγ expression(Reference Borissova, Tankova, Kirilov, Dakovska and Kovacheva104–Reference Pludowski, Holick, Pilz, Wagner, Hollis and Grant106); and VD suppresses pro-inflammatory cytokines and chemokines, reducing immune cell recruitment to adipose tissue and further ameliorating insulin resistance(Reference Marziou, Philouze, Couturier, Astier, Obert and Landrier107,Reference Park, Kim, Yoo, Seo, Pae and Han108) . Jointly, adequate Ca and VD levels regulate insulin receptor gene expression and secretion, enhancing glucose metabolism and reducing diabetes risk(Reference Ojuka93,Reference Dutta, Mondal, Choudhuri, Maisnam, Hasanoor Reza and Bhattacharya109,Reference Pittas, Harris, Stark and Dawson-Hughes110) .
The principal strengths of our study lie in the integration of data from RCTs and meta-analyses, the examination of dose-stratified analyses of Ca supplementation effects, and the incorporation of newly published RCT data not yet captured in existing meta-analyses, collectively yielding an evidence map that enables direct quantitative comparison of Ca and CaD supplementation across a broad range of cardio-cerebrovascular outcomes and risk factors. In addition, the systematic application of AMSTAR 2 to all included meta-analyses constitutes a further methodological strength, providing a structured and transparent appraisal of the internal validity of the contributing evidence base. Nevertheless, several limitations warrant consideration. Of foremost importance is the certainty of evidence: as assessed by the GRADE framework, the majority of outcomes in the present review were supported by low certainty evidence. Besides, AMSTAR 2 ratings revealed that the methodological quality of the included meta-analyses was predominantly suboptimal, which may have compromised the reliability of the synthesised evidence. Beyond these evidence-quality considerations, the present review was restricted to Ca supplements and Ca-fortified foods with explicitly stated dosages, leaving the potential impact of products with unspecified Ca content unevaluated and thereby narrowing the applicability of the findings. Differences in supplement formulation, such as calcium citrate versus calcium carbonate, combined with the unavailability of individual participant data for this study, may have introduced additional heterogeneity. Finally, observational cohort evidence was not quantitatively synthesised in the updated meta-analysis; therefore, our findings primarily reflect randomised comparisons and may not fully capture long-term cardiovascular risks observed in real-world populations.
Conclusion
The objective of this umbrella review is to assist researchers in assessing the relative priority of Ca and Ca plus VD supplementation in relation to cardio-cerebrovascular outcomes and risk factors. This assessment is intended to inform future research and guide nutritional health management. This umbrella review included 35 meta-analyses and 11 new RCTs, encompassing 154 trials and 78,175 participants, and conducted 69 meta-analyses. High-certainty evidence indicated that CaD supplementation improved body fat levels. Low-certainty evidence showed that Ca supplementation increased the risk of cardiovascular and cerebrovascular diseases and elevated inflammatory markers (IL-6 and TNF-α), 2h postload glycemia, and waist-to-hip circumference ratio, while also reducing DBP, body fat, total cholesterol, and total/HDL cholesterol levels. CaD supplementation improved BMI, body fat, fasting blood glucose, LDL, HDL, non-HDL, and total/HDL cholesterol levels. These findings provide an evidence base for clinical interpretation and help guide future research toward existing evidence gaps.
Supplementary material
The supplementary material for this article can be found at https://doi.org/10.1017/S095442242610050X
Data availability statement
The data used in this review was derived from publicly available systematic reviews and meta-analyses.
Financial support
Not applicable.
Competing interests
The authors declare no conflicts of interest.
Authorship
ZJ: data curation, writing – original draft, writing – review and editing. LY: methodology, writing – original draft, writing – review and editing. LG: methodology, writing – original draft, writing – review and editing. SK: writing – original draft, writing – review and editing. BZ: conceptualisation, resources, supervision, writing – review and editing. LZ: investigation, resources, supervision, writing – review and editing.
Institutional review board statement
Not applicable.