1. INTRODUCTION
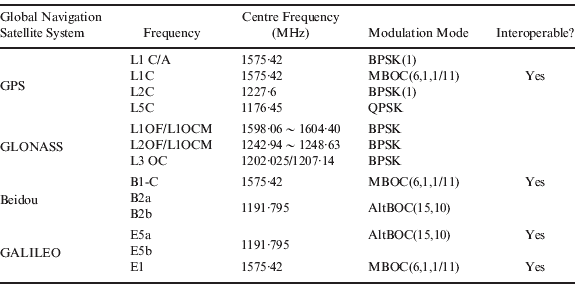
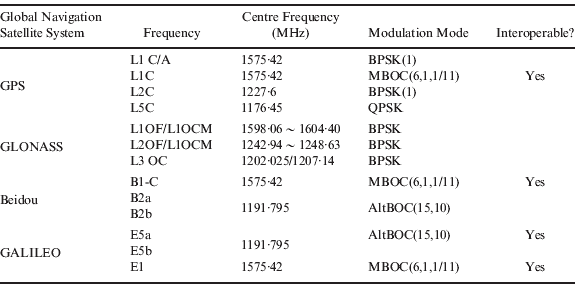
Stepping into the 21st century, the successful launches of the Beidou and Galileo satellite systems will change the previous bipolar competition between GPS and GLONASS and promote cooperation among all the four satellite navigation systems. Obviously, the compatibility and interoperability of navigation signals is one of the main features of the development of multiple GNSS. Open signals with the function of interoperability are expected to provide higher quality GNSS services and better user performance, especially in places such as urban canyons and mountainous areas where the number of satellites in view is limited. Using these open signals, the number of visible satellites will significantly increase, which will improve the reliability and availability of navigation and positioning services (Yang, Reference Yang2010). All the signals of GNSS Open Services, including existing ones and those that are being designed are listed in Table 1.
Signals of GNSS Open Services.
At present, the specifications of the Open Service performance of the four satellite navigation systems have been issued or are being planned to be issued. Due to the possibility of large differences among these specifications either in form or in performance, GNSS users may become confused or will be inconvenienced. In addition, there are no specifications for the performance of GNSS Open Service signals. In order to ensure the safety of the usage and achieve the ultimate goal of interoperability of GNSS Open Services signals, it is essential to conduct research on the monitoring and assessment of GNSS Open Services.
The monitoring and assessment of GNSS Open Services is significant. Firstly, it can provide users with information on the service performance of the single navigation system provided from a third party. This information is helpful for decision-making and it may also improve the quality of the services. Secondly, based on the compatibility and the interoperability, GNSS can not only provide a great leap forward in improving the performance and quality of navigation services, but also may be degraded due to the signal interference across the systems. The work on the monitoring and assessment of GNSS Open Services can help to deal with this problem. It may enhance the reliability of other Open Services. Finally, monitoring and assessment of the comprehensive properties of the multi-system GNSS Open Services could enhance the compatibility and interoperability among the systems, and provide decision-supporting information for the maintenance and management of multi-GNSS.
Since 1997, Stanford University has been under contract to support the USA GPS Joint Program Office by regularly monitoring the L-band transmissions of all newly launched and currently operational GPS satellites. The goal of this program is to verify that all the deployed satellites perform consistently and reliably as the specifications say. They measured the signal power, code delay, frequency content and bandwidth to verify the proper operation of the satellite constellations. Currently, Stanford University is upgrading the RF systems used for data collection by using a 47 m (150 ft) diameter steerable antenna at Stanford University (“The Dish”). All the measurements collected are from this antenna. In addition, the University also monitors and analyses other countries' satellite navigation systems.
In September 2005, the Institute of Communications and Navigation at the German Aerospace Center (DLR) established an independent monitoring station for analysing GNSS signals. The core of this facility is a 30 metres deep space antenna located at the DLR ground station at Weilheim, Germany. The integrated measurement system collects high quality raw measurements of GNSS signals, which will be used for the later analysis of the signals. After the commissioning phase of SVN49 started, DLR collected data and provided analytical results for signal anomalies. For example, when the SVN49 had some problems, its signal anomaly was found and investigated by DLR using the high gain antenna at the monitoring station.
Currently, Stanford University and DLR have already formed the cooperation mechanism for the joint monitoring and assessment of GPS and Galileo signals.
2. ELEMENTS AND METHODS FOR MONITORING AND ASSESSMENT OF GNSS OPEN SERVICES
The work of monitoring and assessment of GNSS Open Services can be divided into the following four layers: constellation status, spatial signals, navigation information and service performance. Before choosing and determining the elements and methods of the assessment, we should take into account different users' requirements, the connections and relationship between different layers, as well as the characteristics of each element. The independence of Open Services of a single system cannot be neglected. The finalised elements and methods should be open, extensible, and compatible, so that when a new system and its open signals appear, this monitoring system can analyse them. In addition, it is emphasised that the monitoring and the release of the assessment results must be implemented in a real-time mode. This is the important function of monitoring by the third party.
2.1. Satellite navigation system constellations
Constellation status is one of the determinant factors for the satellite navigation system to provide high quality services. Therefore, the monitoring and assessment of constellation status plays a significant role for the users to use its open services safely and reliably. The contents of the monitoring and assessment of constellation status are discussed in the sections below.
2.1.1. Constellation status
The constellation status refers to each satellite's working status as part of a single satellite or GNSS constellation at a specified moment. In common use, the working status includes the normal operation, the testing and maintenance, and failures, etc. The number of satellites and the orbit distributions of all the satellites are used to describe this working status. In addition, features such as the launch date and service life of each satellite also can be used as reference information in the assessment of satellite constellation status. Information on constellation malfunctions, maintenance and management released by satellite navigation system providers is an important information source for the monitoring and assessment of constellation status.
2.1.2. Dilution of Precision (DOP)
DOPs indicate the values of various DOPs of healthy satellites in their service range in a single- or multi-GNSS constellation in services volume. DOPs include GDOP, PDOP, HDOP, VDOP, TDOP, etc. DOPs indicate the geometric distribution of satellites. Different DOP values cause different level inaccuracies in the determination of positioning and timing. Hence DOPs are regarded as a measure of the satellite geometry of the GNSS constellation. Low DOP values mean better geometry of the satellite constellation, which results in low errors in the positioning results. For the constellation of single navigation system, the instantaneous DOPs are the direct means for the performance of the constellation. For multi-system constellations, these values can also be used as an important indicator for assessing the navigation and positioning performance of interoperable open signals.
2.1.3. Number of visible satellites
The number of visible satellites is also an important indicator for assessing the condition of a satellite constellation. Its instantaneous value has a strong correlation with its corresponding DOP value regardless of whether these satellites are from a single navigation system or multiple systems. Due to the interoperability of multi-GNSS Open Signals, more satellites will be observable, which will reduce the sensitivity of a single satellite to the overall service performance and also increase the redundancy of the observations. As a result, the accuracy, reliability and availability of the Open Services may be significantly improved.
2.2. Spatial signals
To assess the quality of GNSS spatial signals, relative experiments in various domains e.g. the domains of time, frequency, modulation and correlation should be conducted.
2.2.1. Time domain characteristics
To obtain baseband signals, digital intermediate frequency signals collected by high-gain antennas should be used for quadrature carrier stripping and Doppler removing by a software receiver. Then we can draw waveforms in the time domain. Based on those waveforms, some characteristics such as the edge shape of one chip, code sequence, code rate, code shape, degree of digital distortion and analogue distortion, etc. could be analysed in detail (Hegarty and Ross, Reference Hegarty and Ross2010). Eye diagrams of actual signals and ideal signals can be displayed on the same graph, from which the similarity of both signals can be observed and the related parameters of eye-diagrams. For example, the open degree and noise tolerance, etc. can be also calculated. Thus we can assess the quality of the received signals in the time domain.
2.2.2. Frequency domain characteristics
Frequency domain characteristics are analysed mainly using both offline analysis software and some standard measuring instruments such as a real-time spectrum analyser. Through the tests of signals in aspects of carrier frequency, power spectrum and its envelope, bandwidth and centre frequency, beamwidth between two zero point on main lobe, etc., the difference between the power spectrums of the actual signal and the ideal signal can be observed. In addition, some other indicators such as spectrum asymmetry or distortion, signal stray and carrier leakage, etc. can also be assessed. Thus, the quality of the received signals from the frequency domain properties can be assessed.
2.2.3. Modulation domain characteristics
Both signal vector diagrams and histograms are drawn and analysed using offline analysis software and some standard measuring instruments such as a vector signal analyser. From the vector diagrams for both received signals and ideal signals drawn on the same diagram, one can easily compare both and construct diagrams for the error vector to extract indicators such as the phase orthogonality, carrier orthogonality, amplitude imbalance of I/Q channels, etc. In this way, the phase error and amplitude error caused by channel distortions and noise interference etc., can be analysed. In addition, histograms drawn by offline analysis software can be used to assess noise level. Using a vector signal analyser, a signal vector diagram can be drawn, along with the centre frequency offset, SNR, EVM value, etc. shown on the screen. We can also see its stability by the root-mean-square deviation value calculated by this analyser.
2.2.4. Correlation domain characteristics
Correlation domain characteristics of the received signals are analysed mainly in aspects such as the correlation curve, correlation loss, curve symmetry, code delay and S curve deviation of DLL discriminator, etc. by offline analysis software (Lu and Zhou, Reference Lu and Hongwei2010). The correlation curve of the received signals is compared with that of the ideal duplicated code sequences for identifying its asymmetry and the probability of false lock. Thus the degree of correlation distortions caused by band limited filters, noise, multipath, cross-correlation, etc. can be assessed.
2.3. Navigation information
Navigation information refers to those parameters such as the satellite ephemeris, satellite clock correction, ionosphere delay, time system deviation, etc. that are provided by the satellite navigation data. Navigation information is a very important factor, which affects system service performance, and is also one of the most important items in the monitoring and assessment of GNSS Open Service signals.
2.3.1. Message verification
The verification of a navigation message includes two sides. The first is the consistency verification. The various parameters such as time information, satellite ephemeris, satellite clock, almanac, checksum and so on, which are set and updated correctly or not according to the ICD. The second is the verification of rationality and validity. The related parameters must be validated according to its specific attribute and generation method.
2.3.2. Accuracy of ionospheric delay corrections
Those parameters of ionosphere delay correction models are very important to single-frequency users. The models and parameters may be different in different satellite navigation systems. The accuracy of ionosphere delay corrections is related not only to the model but also the accuracy and update frequency of these parameters. The accuracy can be assessed by the ionospheric delays calculated from dual-frequency or multi-frequency GNSS observations.
2.3.3. Accuracy of GNSS time offset
GNSS time offset reflects the time offset values between different satellite navigation system's time systems. It is the basic but important data for the realisation of GNSS compatibility and interoperability. Its accuracy will directly affect the precision of PVT results for various GNSS user equipment, especially for timing equipment. To carry out monitoring of GNSS time offset, high performance monitoring equipment is required in order to get a more reliable and accurate outside reference.
2.3.4. Validity of time group delay parameters
The monitoring of the time group delay (Tgd) parameters includes two elements. The first is time bias between different frequency signals passed through the same path in a satellite's equipment. This time bias is related with the calibrated values and signal frequency. The other is the time bias between different codes modulated on the same carrier wave.
2.4. Service performance
The satellite navigation system usually provides three kinds of basic services. The user can get position, velocity and time (PVT) estimates. The service performance of a satellite navigation system usually is described from these aspects, such as accuracy, availability, integrity and continuity (Department of Defense of United States of America, 2008), etc.
2.4.1. Accuracy
The accuracy of signal in space (SIS) includes URE (User Range Error), URRE (User Range Rate Error), URAE (User Range Acceleration Error) and UTE (User Time Error). It is an important indicator to assess the effect of satellite ephemeris and forecast clock bias on the errors of position, velocity or time estimates. To assess the accuracy of signals in space, it is necessary to calculate the precise orbits and clock bias.
The accuracy of Open Services is used to describe the difference between the measured value and the real value of the position, velocity and time. It equals UERE (User Equivalent Range Error) multiplied by DOP, where UERE is determined by URE and UEE (User Equipment Error) from the expression:

It also relates to the errors of satellite clock error, ephemeris error, atmosphere model error, multipath effects, receiver clock error, etc.
2.4.2. Availability
Service availability refers to the percentage of time when the errors of position, velocity and time estimates are within the required threshold for a specified period of time (a return cycle) and service volume. According to the accuracy being equal to UERE multiplied by PDOP, the service availability in fact can be changed to DOP availability.
2.4.3. Integrity
Service integrity mainly refers to the probability of a navigation system sending an alarm to the users timely (i.e. within a given period of time) when the errors of position, velocity or time estimates are larger than the threshold values. It is generally described by alarm threshold, alarm time and hazardous misleading information (HMI) probability. The alarm time refers to the maximum time delay allowed from the time a malfunction starts to the time an alarm is generated. In addition, the HMI probability, also called the integrity risk, refers to the probability of the current measured results falling in the range of the alarm threshold.
2.4.4. Continuity
Service continuity refers to the percentage of time when a satellite navigation system continuously meets the required service precision for a given period of time and service volume. The average continuity of service can be calculated from the MTBF (Mean Time Between Faults) and MTTR (Mean Time To Repair) values under the condition without any planned interrupts of the satellite system.
3. FRAMEWORK OF IGMAS
3.1. Architecture and functions
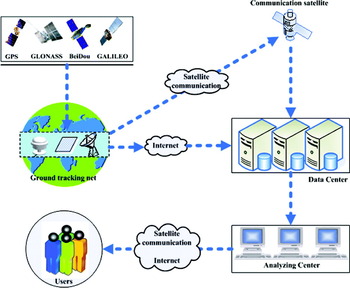
To monitor and assess GNSS open services worldwide, it is necessary to construct an international GNSS Monitoring and Assessment System (iGMAS). The basic functions of iGMAS should include data monitoring and collecting, data transmitting, data storing, data analyzing and information releasing. Figure 1 shows its architecture.
Framework of iGMAS.

3.1.1. Data monitoring and collecting
The basic tasks of data monitoring and collecting is receiving and measuring signals of GNSS navigation and collecting the observation data of environment (such as electromagnetic data, meteorological data). The main functions include:
1) Providing Quadruple-overlap coverage observations for the integrity monitoring and precise orbit determination.
2) Real-time monitoring of the quality of all GNSS satellite signals using digital multi-beam antennas and related equipment.
3) Fine and continuous observation to key satellites using a 30 m high-gain antenna and related equipment.
Equipment for data monitoring and collecting mainly includes anti-multipath omni-directional antennas, multi-beam antennas which can receive all GNSS signals (with equivalent diameter of 2·4 m and gain of 28 dB), a 30 m antenna, a monitoring receiver, RF and baseband signal observations equipment, time-delay calibrating equipment, meteorological sensors and electromagnetic environment analysing equipment. Additional equipment includes atomic clocks, data processors, network switches, etc.
3.1.2. Data storing
The basic tasks of data storing include classifying, storing and managing the data of GNSS observations and electric-magnetic environment data, providing a raw data service to users in a standard data format.
The main equipment includes data server, huge-mass storage and corresponding network equipment.
3.1.3. Data analysis and information release
What is meant by data analysis and information release here is mainly classifying and processing the GNSS monitoring data, comprehensively analysing GNSS signals and related information, and assessing the system's service performance. For example, the constellation characteristics such as the number of visible satellites, constellation status and constellation DOPs, etc are all analysed. The properties of the navigation signals from various domains such as time domain, frequency domain, modulation domain and correlation domain are also analysed. To verify the validity of navigation information such as navigation message, accuracy of ionosphere delay corrections and GNSS time offset, validity of time bias parameters between different frequencies; assessing the accuracy, availability, integrity and continuity of GNSS Open Services, all these works should be undertaken. Based on the comprehensive analytical results, statistical information on the working status of GNSS satellites is also released to the users. The equipment required includes: equipment for displaying real-time status, software for analysing and assessing, servers, work stations, equipment for network exchanging, huge-mass storages, etc.
3.1.4. Data transmissions
The basic tasks of data transmissions include data exchange, transmission of control instructions, and transmission of information released to users. The data transmission links include the Internet, satellite link (Vsat) and wireless mobile network, etc.
3.2. A tentative plan for the implementation of iGMAS
3.2.1. Preliminary deployment scheme
In iGMAS, the tracking stations scattered worldwide are used to implement data collection. The following two factors should be considered in the deployment of the tracking stations:
1) For the high quality monitoring of GNSS signals, it is necessary to use multi-beam antennas and a 30 m high-gain antenna to track satellites continuously. Thus, at least, these tracking stations should meet the requirement of Single-overlap coverage of satellites.
2) For the satellite integrity monitoring, these tracking stations should meet the requirement of Quadruple-overlap coverage of satellites.
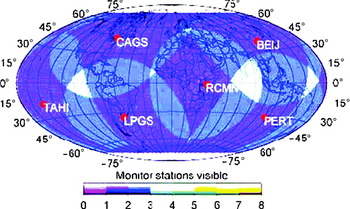
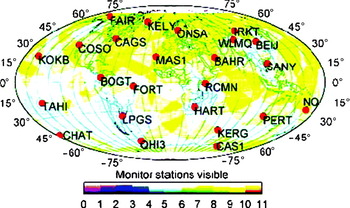
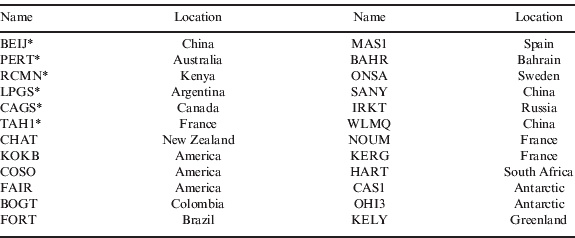
Here the tracking stations are selected from the existing IGS stations and a grid analysis method is used to optimise their layout (Stanton and Strother, Reference Stanton and Strother2007). The data used for the analysis is from the belt where the latitudes are in the range of 65° N – 65° S at a height of 19,000 km. The grid size is 1°×1° and the elevation cut-off angle is 15°. The preliminary analysis result shows that six tracking stations are needed to meet requirement 1, and 24 stations are needed to meet requirement 2. Table 2 lists the locations of the iGMAS tracking stations. Figures 2 and 3 show the two schemes for the optimal deployment of stations of Single-overlap and Quadruple-overlap coverage respectively.
Scheme for the optimal deployment of stations of Single-overlap coverage.

Scheme for the optimal deployment of stations of Quadruple-overlap coverage.

Locations of the iGMAS tracking stations.
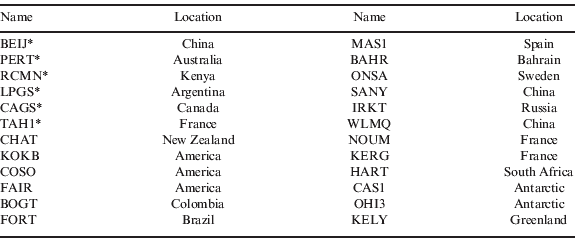
where ‘*’ denotes the tracking stations belonging to both Quadruple-overlap and Single-overlap coverage.
3.2.2. Operation mode
The iGMAS can be constructed through international cooperation and the co-operator can be the service providers of the four global navigation systems and their civil users.
The basic unit of the iGMAS' network is called a node here. The five functions of the nodes can be: data collecting and monitoring, data transmitting, data storing, data analysing and information releasing.
All the nodes can be categorised into three levels: level one has all the aforementioned five functions; level two has functions of data collecting, data transmitting, data storing and analysing; level three only has the two functions: data collecting and transmitting. To implement global data sharing, each node intuitively provides data for the network and also automatically extracts data from the network to perform signal assessment. All the nodes in level one will join together to realise the monitoring and assessment of GNSS Open Services and information release. This network regularly works through the collaboration of its nodes. Each node is allowed to access to or exit from the network freely.
4. PERFORMANCE MONITORING AND ASSESSMENT FOR BEIDOU
4.1. Monitoring and assessing the accuracy of SIS
For the monitoring and assessment of the performance of Beidou Open Services from the information layer, a Beidou monitoring and assessment system was constructed in November 2007. It includes a monitoring and assessment centre, a data analysis centre and six tracking stations. The six tracking stations were located in Xi'an, Shanghai, Changchun, Kunming, Urumqi and Antarctic respectively. Each station is equipped with Beidou geodetic receivers, high-precision atomic clocks and computers, etc. The main purpose of these stations is precise orbiting and satellite clock bias determination and assessing the performance of the satellite clocks and the accuracy of the ionosphere models, verifying the navigation message, etc.
4.2. Monitoring and assessment of SIS Quality
In February 2009, the first monitoring and assessment system for the Beidou signal quality was successfully constructed by NTSC (National Time Service Centre) of the Chinese Academy of Sciences, in Lintong district of Xi'an, Shaanxi province. This system consisted of a 7·3 m antenna, a RF receiving subsystem, a RF data collecting subsystem, a baseband signal collecting subsystem, monitoring receivers, a calibrating subsystem, a data storing subsystem and so on. Experimental results showed that this system could perform some intensive tasks of monitoring and assessing GNSS signal quality using many standard measuring instruments, monitoring receivers, high speed data collecting equipments and offline analysis software.
At present, two key techniques of GNSS signal quality monitoring and assessment have been achieved, offline analysis technique for signal performance based on correlation curves and the channel calibrating technology. In addition, great progress has also been made on the anti-interference technique of this system. Since this system successful operated in April 2009, it has successfully completed the tasks of monitoring and assessing the signal quality of the Beidou GEOs and IGSOs. It has also collected and analysed GPS MEOs signals and Galileo Glove – B signals.
5. CONCLUSIONS
The monitoring and assessment of GNSS open services can bring many benefits to the development of GNSS healthily. It can not only extend GNSS application fields, but also provide the foundation for all kinds of civil users to use the system services safely and reliably. Much evidence, such as the preliminary exploration of monitoring and assessment of Beidou Open Services, the long-term successful operation of IGS, and the achievements in navigation signal monitoring and assessment made by Stanford University and DLR, etc. suggests that the iGMAS proposed in this paper is technically feasible. The construction of the iGMAS is however an international and long-term work. It needs more organisations and countries to be involved in this work. Thus international cooperation is very necessary.