


INTRODUCTION
Quaternary colluvial sedimentary deposits are associated with the downslope zone of steep bedrock slopes and topographic escarpments and have long been recognised as an important product of mass wasting (Blikra and Nemec, Reference Blikra and Nemec1998). Colluvial processes involve rockfalls/debris falls, debris flows, and channelized or unconfined water flow (Nemec and Kazanci, Reference Nemec and Kazanci1999; Ventra et al., Reference Ventra, Chong Dìaz and De Boer2013), which mobilise and then deposit the colluvial material. These processes depend strongly on the local geology and geomorphology and the climatic conditions at the time of deposition. Colluvial deposits in general have quite a small spatial extent, but with the right conditions, colluvial sequences can form deposits traceable for many kilometres and be many tens of metres thick. Such conditions can occur in extensional tectonic environments where fault activity produces the volume/space for colluvial deposition. Here, large bedrock footwall mountain fronts are uplifted forming steep slopes, and hanging-wall slopes are subsided. These normal faults are typical for the Aegean region, and colluvial processes can deposit thick sequences in the hanging-wall covering large areas.
Colluvial sedimentation is by its nature episodic; the study of these deposits provides information about a specific time period when the colluvium was deposited, and its use as a proxy record for terrestrial climatic conditions has been shown by many authors (e.g., Blikra and Nemec, Reference Blikra and Nemec1998; Nemec and Kazanci, Reference Nemec and Kazanci1999; Gradzinski et al., 2014). Quaternary colluvial sequences throughout the world mainly comprise noncemented gravel deposits, which have been used in applied geologic studies (gravel exploitation, slope stability, etc.) for hundreds of years. However, occasionally the colluvial gravels become cemented by mineral precipitation between the gravels from near-surface or groundwater fluids. Some researchers refer to cemented colluvial deposits as a type of travertine. For example, the term cemented rudite is used in the travertine classification of Pentecost (Reference Pentecost1993, Reference Pentecost2005) and Pentecost and Viles (Reference Pentecost and Viles1994, p. 310) describe “surface cemented rudites, consisting of cemented screes, alluvium, breccia, gravel, etc.” The term calcrete was also originally used to refer to cemented deposits (Lamplugh, Reference Lamplugh1902); however, calcretes are now mostly regarded as carbonates formed within soil profiles and are mostly associated with low sedimentation rates. To avoid confusion, we refer to unconsolidated deposits cemented by secondary carbonate as cemented colluvium as this is a descriptive term lacking genetic connotations.
The focus of this study is cemented colluvium, which is present on the Lastros Fault located within the Ierapetra Fault Zone (IFZ) in eastern Crete, Greece. Crustal extension has led to the development of normal faults throughout Crete, and many of these faults comprise footwall limestone bedrock scarps mainly juxtaposed against Quaternary colluvium, which has fallen from the footwall mountain above the scarp and landed on the hanging-wall. In places, this colluvium has often become cemented forming large hanging-wall lobes or spatially irregular sheets of varying thickness parallel to the bedrock fault scarp. These colluvial sheets should not be confused with fault cataclasite (tectonic breccia), which also forms sheets and belts parallel to faults (e.g., Stewart and Hancock, Reference Stewart and Hancock1988, Reference Stewart and Hancock1990). We therefore provide characteristic criteria for a distinction to be made.
The cement within cemented colluvium has precipitated from fluid flow within the fault zone. However, the origin and nature of this fluid is unknown. Faults themselves can be both conduits and barriers for fluid movement during the seismic cycle (Brown and Bruhn, Reference Brown and Bruhn1996; Uehara and Shimamoto, Reference Uehara and Shimamoto2004; Wibberley et al., Reference Wibberley, Yielding and Di Toro2008). To understand the processes of fluid flow within fault zones, the cement precipitated from the fluid therefore needs to be investigated. Laboratory analyses of the stable isotope composition of carbon and oxygen within the cemented colluvium, and also ground-penetrating radar (GPR), indicate the cement’s likely formation processes and give insights into how the fault has evolved throughout the Quaternary.
GEOLOGIC AND TECTONIC SETTING
The island of Crete is located in the southern Aegean region just north of the Hellenic Arc and Trench System (Fig. 1a). Late Miocene–Quaternary extension (Papanikolaou and Vassilakis, Reference Papanikolaou and Vassilakis2010) has led to a complex pattern of extensional detachment faults and high-angle normal faults throughout the region. This is attributed to crustal back arc extension, interpreted as a response to the southward slab rollback of the Hellenic margin, the southwestward expulsion of the Aegean microplate, and the anticlockwise rotation of the African lithosphere relative to Eurasia (Meulenkamp et al., Reference Meulenkamp, Wortel, van Wamel, Spakman and Hoogerduyn Strating1988; Reilinger et al., Reference Reilinger, McClusky, Vernant, Lawrence, Ergintav, Cakmak and Ozener2006). The southward slab rollback is the predominant mechanism; from the Middle Miocene, the central and southern Aegean domain began to extend rapidly in a north–south direction implying the rapid migration of the Crete trench relative to northern Greece (Angelier et al., Reference Angelier, Lyberis, Le Pichon, Barrier and Huchon1982; Royden and Papanikolaou, Reference Royden and Papanikolaou2011; Jolivet et al., Reference Jolivet, Faccenna, Huet, Labrousse, Le Pourhiet, Lacombe, Lecomte, Burov, Den’ele and Brun2013). Extension is occurring orientated both arc perpendicular and arc parallel creating normal faults roughly oriented both north-northeast (NNE) to south-southwest (SSW) and east-southeast (ESE) to west-northwest (WNW) (Fig. 1b). These faults crosscut all of the bedrock geology, which comprises Alpine thrust sheets developed as a result of oceanic closure and subsequent nappe stacking. Crete comprises several thrust sheets that have been successively imbricated by other sedimentary and metamorphic units (van Hinsbergen et al., Reference van Hinsbergen, Hafkenscheid, Spakman, Meulenkamp and Wortel2005; Papanikolaou and Vassilakis, Reference Papanikolaou and Vassilakis2010). In eastern Crete, the stratigraphically lowest Mani unit (Fig. 1c) is the autochthon basement comprising crystalline limestone. This unit was imbricated by the Western Crete unit (Fig. 1c), which comprises mainly Permo-Triassic phyllites and Middle to Late Triassic evaporites. The Arna unit was next to be imbricated, but these rocks have not been preserved in eastern Crete; the largest exposures of the Arna unit are in western Crete and comprise low- to medium-grade metamorphic phyllites and quartzites. The Tripolis unit (Fig. 1c) was then imbricated on the Arna unit and comprises a thick sequence of flysch, limestone, dolomite, andesite, diabase, and phyllites, all of which are preserved in eastern Crete. These rocks form the volcano-sedimentary base to the shallower carbonate rocks of the Tripolis carbonate platform, exposed in both Crete and the Peloponnese (Papanikolaou and Vassilakis, Reference Papanikolaou and Vassilakis2010).
(colour online) (a) Simplified tectonic map of the Aegean region. NAFZ, North Anatolian Fault Zone; Pel., Peloponnese. Large arrows show the direction and velocity of plate motion based on GPS studies relative to stable Eurasia (Reilinger et al., Reference Reilinger, McClusky, Paradissis, Ergintav and Vernant2010). (b) Relief map of Crete showing the locations of the major capable bedrock faults throughout the island (fault locations from Caputo et al., Reference Caputo, Catalano, Monaco, Romagnoli, Tortorici and Tortorici2010; Gallen et al., 2014). (c) Geologic map of the study area showing the locations of the northern part of the Kavousi Fault, Lastros Fault, and Sfaka Fault (modified from Papastamatiou, 1959; Papanikolaou and Vassilakis, Reference Papanikolaou and Vassilakis2010). Dashed rectangle refers to Figure 3a and b.

The study area is the Lastros Fault located within the IFZ in eastern Crete (Fig. 1b and c). The IFZ consists of a roughly 25-km-long zone of fault segments dipping to the WNW and ESE. Within the IFZ, colluvial sequences have developed throughout the Quaternary. The largest colluvial sequences occur at the Kavousi Fault where thick aprons of colluvium have been deposited, predominantly in the hanging wall but in some locations also covering the lower reaches of the footwall (north of Kavousi town in Fig. 1c). The high deposition rate of this colluvium does not allow a scarp to be exposed on the Kavousi Fault. The Lastros Fault is another fault within the IFZ that has significant colluvial deposits. The Lastros Fault is 11 km long and has a clear fault scarp for approximately 5 km, which comprises two segments separated by a step over; in the south, the fault jumps back into the footwall by about 150 m (Mason et al., Reference Mason, Schneiderwind, Pallikarakis, Wiatr, Mechernich, Papanikolaou and Reicherter2016) (Figs. 1c, 2a and b). The footwall is composed of limestone of the Mani tectonic unit (Papanikolaou and Vassilakis, Reference Papanikolaou and Vassilakis2010) making the Kapsos Mountain ridge and is brecciated as first observed by Stewart and Hancock (Reference Stewart and Hancock1988, Reference Stewart and Hancock1990). The fault’s northern segment comprises footwall limestone juxtaposed against hanging-wall phyllites, which are overlain by a colluvial sequence. The southern segment’s hanging wall close to the scarp comprises the same carbonate rocks as the footwall overlain by colluvium. The colluvium is mostly unconsolidated material that has fallen from the footwall mountain above the scarp and settled on the hanging wall; however, in many places over the whole fault the colluvium has become cemented. A large hanging-wall lobe of cemented colluvium at the northern end of the fault’s lower segment is approximately 110 m long and 140 m wide (Figs. 3a–d, 4a) and forms an impressive protuberance within the hanging-wall morphology. In some areas, the cemented colluvium forms sheets parallel to the fault plane (Fig. 4b–d), which can be many metres thick, and in others it is completely absent allowing the bedrock scarp to be exposed. Where present, the thickness of these sheets attached to the plane ranges between about 10 cm and 3 m. However, there are areas where only remnants of the cemented colluvium are left on the fault plane and the thickness is therefore much less than originally; this is caused by subaerial erosion of the sheet after exposure. In certain locations within the colluvial sheets, calcite has grown forming veins and crystals (Fig. 4c). Terraces have been constructed on the hanging-wall at the base of the scarp to allow the space to be used for agriculture and utilise water runoff. This construction process has artificially exposed the scarp and cemented colluvium in some areas.
(a) Block diagram of the Lastros-Sfaka Graben. (b) View of the Lastros Fault, yellow arrows indicate the bedrock scarp, and stereoplot shows the fault plane orientation. NNE, north-northeast; SSW, south-southwest. (For interpretation of the references to colour in this figure legend, the reader is referred to the web version of this article.)

(a) Terrestrial light detection and ranging (t-LIDAR) derived Digital Elevation Model (DEM) showing slope angle. Black arrows indicate the fault scarp. (b) t-LIDAR derived hill-shade DEM showing the calcite vein sampling site and ground-penetrating radar (GPR) location. Yellow box indicates the location of panels c and d. Red arrows indicate the fault scarp. (c) Close-up hill-shade view of the lobe from the t-LIDAR derived DEM showing profile location of cross section (see Fig. 10a). (d) Close-up aerial view of the lobe using Google Earth imagery from April 2013 (Lastros Fault 1 km north-northwest of Lastros village, Crete, 35°8.968'N, 25°53.695'E, elevation 450 m; http://www.google.com/earth/index.html [accessed July 2016]). Cemented colluvium sampling locations are shown in yellow with respective numbers indicating metres from the fault plane. (For interpretation of the references to colour in this figure legend, the reader is referred to the web version of this article.)

Photo plate showing the forms of cemented colluvium on the Lastros Fault. (a) View of the north part of the Lastros Fault’s lower segment showing a lobe of cemented colluvium sitting proud in the hanging-wall; yellow arrows indicate the scarp. (b and c) Sheets of cemented colluvium of varying thickness attached to the Lastros Fault’s bedrock plane. (d) Schematic diagram showing the structure of the tectonic breccia (cataclasite) and cemented colluvium (modified from Stewart and Hancock, Reference Stewart and Hancock1988). (For interpretation of the references to colour in this figure legend, the reader is referred to the web version of this article.)

Cemented colluvium is present at some other normal faults in the Aegean region. Altunel and Hancock (Reference Altunel and Hancock1993) describe locally cemented footwall-derived talus at the Pamukkale Fault in western Turkey as “range-front travertines” deposited from spring water. Hancock and Barka (Reference Hancock and Barka1987) describe trails and tabular sheets of “brecciated colluvium” attached to several fault planes in western Turkey. “Indurated breccia” is mentioned to be present on a number of faults on Crete (Stewart and Hancock, Reference Stewart and Hancock1991; Caputo et al. Reference Caputo, Monaco and Tortorici2006, Reference Caputo, Catalano, Monaco, Romagnoli, Tortorici and Tortorici2010). The Zou Fault within the Sitia Fault Zone (Fig. 1b) has a prominent cemented lobe, and sheets of varying thickness are present on the Kera, Asomatos, Spili, and Kastelli Faults (Fig. 1b). The formation process of this cemented colluvium (brecciated colluvium or indurated breccia) is, however, not discussed in the aforementioned publications, and little work has been undertaken on these deposits and their relationship to individual faults.
METHODS
Field methods
GPR was undertaken on the hanging-wall of the fault to determine whether cemented colluvium was present in the hanging-wall subsurface below uncemented colluvium. Several GPR profiles were undertaken on an area where thick vegetation and boulders were at a minimum, allowing easier access to the hanging wall (see Fig. 3b for location). This allowed good coupling of the GPR antenna with the ground surface. We used a GSSI 270 MHz antenna with a survey wheel, an SIR-3000 data recording unit, and a handheld GPS to mark the start and end of the profiles. Trace increment was set to 0.02 m to achieve a high data density; the range was set to 120 ns two-way travel time and with a sample rate of 512 scans/s. This achieved a penetration depth of about 6 m. Data processing was then done with ReflexW V6.1 (Sandmeier Scientific Software), which included static correction, background removal, gain adjustments, and velocity adaption for time-depth conversions. The latter was based on a hyperbola analysis where such features were present. In other cases, we estimated characteristic velocities presented by Neal (Reference Neal2004). In order to confirm the GPR results, trial pitting was also undertaken with hand tools. This allowed the shallow geology to be confirmed and time-depth-conversion to be carried out.
Terrestrial light detection and ranging (t-LIDAR) scanning was undertaken along the fault (Fig. 3a and b) covering the footwall and hanging-wall. This was undertaken so that the surface morphology of the footwall and hanging-wall could be visualised along with radar reflections of the hanging-wall subsurface. We used an ILRIS 3-D laser scanner from Optech Inc. The t-LIDAR scanning produced a point cloud that was cleaned of isolated points (e.g., vegetation), geometrically aligned, and then georeferenced using GPS data taken in the field. A raster was then produced with a 0.5 m cell-size resolution using geographic information system (ArcMap, ESRI), which creates a spatially regular distribution of the point cloud data. The GPR profiles were then georeferenced using GPS data and manual measurements. Topographic correction using the t-LIDAR data was then applied to the GPR profiles.
Laboratory methods
Cemented colluvium samples from the Lastros Fault were extracted from the lobe structure towards the fault’s northern end (Fig. 3a and b). Samples were collected from locations with no vegetation cover at ~5 m intervals from the fault plane into the hanging-wall up to a distance of 59 m (Fig. 3d). This was undertaken by hammering the deposit until a cobble-size piece was freed. A calcite vein sample was also taken from within a sheet (Fig. 3b). The cemented colluvium samples were cut, photographed, and stained with Alizarin red S (ARS) and potassium ferricyanide dissolved in a dilute hydrochloric acid solution in order to confirm that the composition of the cement was carbonitic (Evamy, Reference Evamy1963; Dickson, Reference Dickson1965). The sedimentary descriptions of the mineralogy and texture of the cemented colluvium were based on the macroscopic and microscopic characteristics of the material. Thin sections were made of representative areas and were viewed using a standard petrographic microscope. Soft-cemented (friable) samples were first impregnated with an epoxy resin to make them harder for cutting. All samples were sectioned, glued to a glass slide (3–5 mm), and polished using progressively finer abrasive grit until the sample was 20–30 µm thick.
To reconstruct the occurrence, origin, and movement of fluids within the fault zone, the stable isotope geochemistry of the cement was investigated. The ratios of two isotope pairs 13C/12C and 18O/16O, which are respectively expressed as the delta values δ13C and δ18O, are measured and used to determine the physicochemical conditions of the source water from which the cement precipitated. The ratios relate the isotopic concentration of the sample to that of a standard, and delta values are said to be either heavier (enriched) or lighter (depleted) than the standard (Pentecost, Reference Pentecost2005). The standard used for carbonates is Vienna Pee Dee belemnite (V-PDB), originally from the Cretaceous Pee Dee Formation (Urey et al., Reference Urey, Lowenstam, Epstein and McKinney1951) but has now been replaced by the artificial V-PDB, which is a marble (Pentecost, Reference Pentecost2005). Ratios are expressed as per mille (‰) providing an expanded scale for the comparatively small differences observed. Fractionation, resulting from evaporation, degassing, or metabolic consumption of the lighter isotopes during the (bio)geochemical cycle, induces discrete changes in δ13C and δ18O, providing information about the physicochemical conditions of the precipitation events (Gandin and Capezzuoli, Reference Gandin and Capezzuoli2008).
Calcite cements form through the degassing of surfacing CO2-rich groundwaters. The concentrations of δ18O and especially δ13C in the cement can be used to determine the source of the CO2, which can be either meteoric or thermal. Meteoric CO2 originates from the atmosphere and the soil zone. Cements formed from groundwaters charged with meteoric CO2 are termed meteogenes and typically form from cold-water springs in regions underlain by carbonates. Thermal CO2 originates from thermal processes within or even below the earth’s crust. Thermally generated CO2 dissolves in groundwater producing high concentrations of CO2, which are capable of dissolving large volumes of rock. Cements formed from groundwaters charged with thermal CO2 are termed thermogenes and form from hot-water springs (Pentecost, Reference Pentecost2005). The concentration of δ18O can be used to estimate past water temperatures. Groundwater exchanges oxygen atoms with the dissolved CO2, and where isotopic equilibrium conditions are established, meaning there is isotope exchange between the calcite and water phases, the difference between the ratio of oxygen isotopes in the precipitated calcite and that of the parent water can be used to estimate the palaeotemperature (Pentecost, Reference Pentecost2005).
Colluvium has a porous framework, and calcite cement–precipitating waters can penetrate below ground and continue to precipitate calcite cement downstream of the source spring. At emergence, the source water is supersaturated with carbonate, and calcite then precipitates on the preexisting gravels. As penetration continues downstream and below ground, the supersaturation will fall until saturation is reached and no further calcite precipitation will occur (Pentecost, Reference Pentecost2005). Calcite-precipitating groundwaters have 18O compositions similar to the local precipitation, but groundwaters are often slightly enriched in 18O compared with rainwater because of surface evaporation, which preferentially affects the lighter 16O isotopes (Yurtsever, Reference Yurtsever1976; Pentecost, Reference Pentecost2005).
Powdered samples were obtained by microdrilling of the unstained cut surface using a Dremel drill. Eighty-three powder samples were analysed to determine the composition of (1) calcite crystals in the sampled vein, (2) crystalline calcite cement, (3) crystalline clay-rich calcite cement, (4) soft clay-rich calcite cement, (5) clay-rich rims around clasts, (6) calcite growing in secondary voids, and (7) limestone clasts. The size of the hole drilled will have an effect on results, as a large hole will cover a larger time period of calcite precipitation, and fractionation conditions may have changed. Therefore, the microdrilled holes were kept to <3 mm diameter to try and minimise this effect as only 50–100 μg of cement powder is required per sample. To determine the stable isotopic composition of calcite samples, we used a Finnigan 253 gas mass spectrometer coupled to an automatic carbonate preparation device Kiel IV at the Alfred Wegener Institute in Bremerhaven, Germany. The mass spectrometer was calibrated via international standard NBS19 to the PDB scale, and results are given in δ notation versus V-PDB. The precision of δ18O and δ13C measurements, based on an internal laboratory standard (Solnhofen limestone) measured over a 1 yr period, was better than ±0.08‰ and ±0.06‰, respectively.
RESULTS
Cemented colluvium descriptions
The source of colluvial deposits at the Lastros Fault is relatively small and consists of carbonates from the Mani unit (Figs. 1c and 2b). The lobe structure has three distinct cemented colluvium facies that can be recognised. The classification of these facies is dependant on the clay content of the cement and the clast composition and texture. The macroscopic and microscopic characteristics of these three facies are described below.
Facies 1 can be described as a matrix-supported breccia with crystalline cement containing a minor constituent of fines. This facies occurs at 9 and 40 m from the fault plane. The cemented colluvium comprises poorly sorted carbonate rock clasts. The vast majority of these clasts are crystalline limestone from the Mani unit (Papanikolaou and Vassilakis, Reference Papanikolaou and Vassilakis2010) and are light blue/grey in colour (Fig. 5a). There are occasional lithic fragments of impure limestone, and some dolomite fragments are also present that do not stain red with ARS (Fig. 5b). The carbonate clasts are mainly angular and elongate in shape indicating short transport distances (Fig. 5a–c). The clasts are mainly coarse gravel size (between 2 and 6.3 cm); however, larger cobbles are occasionally present. Dolomite fragments are generally medium gravel size (between 0.63 and 2 cm). The cemented colluvium is mainly matrix supported with constituent clasts rarely touching. The matrix mainly comprises sparry calcite cement. Where there is relatively pure calcite there is an isopachous cement rim of micrite around the parent clast (Fig. 5d). The size of the crystals then significantly increases towards the centre of the void, and the crystals become drusy and blocky (Fig. 5d). In some areas, the cement appears slightly light brown in colour; here clay/silt minerals are a minor constituent. Occasional voids are also present within the cement matrix.
Facies 1: (a) Cut sample 9 m from the fault plane. (b) Cut sample 9 m from the fault plane stained with Alizarin red S; note the dolomite fragments that do not stain red. (c) Cut sample 40 m from the fault plane. (d) Thin section image (cross polars) from the 9 m sample showing the pure sparry calcite cement (Ca) and the fine-grained isopachous cement rim around the parent clast (P). (For interpretation of the references to colour in this figure legend, the reader is referred to the web version of this article.)

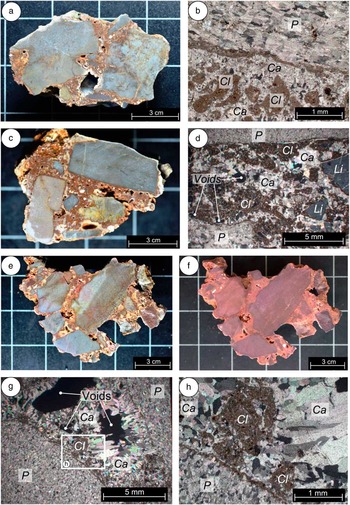
Facies 2 can be described as a matrix-supported breccia with crystalline cement with a medium fines content. Fines are particles with sizes <0.063 mm. This facies is the most common occurring at 19, 35, 51, 57, and 59 m from the fault plane, and the clast composition is similar to facies 1, with the majority of clasts comprising crystalline limestone from the Mani unit (Papanikolaou and Vassilakis, Reference Papanikolaou and Vassilakis2010). The cemented colluvium is matrix supported with no clasts touching (Fig. 6a, c, and e). The major difference compared with facies 1 is the composition of the cement matrix. The cement matrix comprises between 30% and 50% fines. The fines comprise poorly sorted rounded peloids of clay/mud. Surrounding most parent carbonate clasts there is, in the majority of cases, a clay/mud coating between 100 and 200 µm in thickness (Fig. 6b, d, g, and h) that sometimes projects into the pore space. The remaining 50% to 70% comprises sparry calcite. This proportion of calcite allows the cement to have a crystalline appearance when viewed macroscopically. Sparry calcite crystals form in between peloids of clay/mud and have a drusy texture. There are still some voids visible within the cement matrix (Fig. 6b, d, and e) indicating where the most recent calcite crystals were growing.
Facies 2: (a) Cut sample 19 m from the fault plane. (b) Thin section image (cross polars) from the 19 m sample showing the sparry calcite cement (Ca), clay minerals comprising ~50% of the matrix (Cl), and the clay isopachous cement rim around the parent clast (P). (c) Cut sample 51 m from the fault plane. (d) Thin section image (cross polars) from the 51 m sample showing the sparry calcite cement (Ca), clay minerals comprising ~50% of the matrix (Cl), and lithic fragments of impure limestone (Li). (e) Cut sample 35 m from the fault plane. (f) Cut sample 35 m from the fault plane stained with Alizarin red S. (g) Thin section image (cross polars) from the 35 m sample showing elongate crystals of pure sparry calcite cement (Ca), voids in which the calcite crystals were growing, the fine-grained isopachous cement rim around the parent clast (P), and mud/clay minerals (Cl). (h) Higher magnification image from panel g showing the clay minerals (Cl) and calcite (Ca) in more detail and the clay rim around the parent clast (P). (For interpretation of the references to colour in this figure legend, the reader is referred to the web version of this article.)
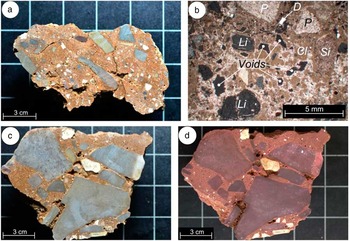
Facies 3 can be described as a matrix-supported breccia with cement, which has a high fines content. This facies occurs at 16 and 24 m from the fault plane. The clast composition is similar to facies 1 and 2, but rare fragments of siliceous material are also present (Fig. 7a and b). The main difference is the composition of the cement matrix. The matrix comprises between 50% and 70% poorly sorted rounded peloids of clay/mud, with the remaining 30% to 50% being sparry calcite cement (Fig. 7a–c). This high fines content makes the matrix rather friable and no longer appear crystalline when viewed macroscopically (Fig. 7a and c).
Facies 3: (a) Cut sample 16 m from the fault plane. (b) Thin section image (cross polars) from the 16 m sample showing fine sparry calcite cement and clay minerals (Cl) comprising ~60% of the matrix (Cl), lithic fragments of impure limestone (Li), dolomite fragments (D), and a siliceous fragment (Si). (c) Cut sample 24 m from the fault plane. (d) Cut sample 24 m from the fault plane stained with Alizarin red S; note the dolomite fragments that do not stain red. (For interpretation of the references to colour in this figure legend, the reader is referred to the web version of this article.)
Stable isotope analyses
The stable isotope composition of facies 1, 2, and 3, as well as the calcite vein from within a colluvial sheet, totalling 83 measurements, is listed in Table 1 and presented in Figure 8. The calcite vein shows the highest negative values of both δ13C and δ18O, whereas the limestone bedrock clasts from all facies show the lowest negative δ18O values, with many having positive δ13C values (yellow triangles in Fig. 8). There is no clear correlation between δ13C and δ18O for facies 1, 2, and 3. However, there is a clear grouping of the values. The relatively pure cement of facies 1 has δ13C values ranging from −10.2‰ to −7.7‰, and δ18O values ranging from −5.4‰ to −4.5‰. The crystalline clay-rich cement of facies 2 has a larger range of δ13C values from −9.0‰ to −2.3‰, and also a larger range of δ18O values from −5.8‰ to −4.3‰. The soft clay-rich cement of facies 3 has δ13C values ranging from −10.2‰ to −7.8‰, and δ18O values ranging from −5.4‰ to −5.0‰. The sampled secondary void areas in facies 1 and 3 generally show similar isotope values to the cement. However, for facies 2 there is a large scatter in both δ13C and δ18O values, which range from −8.1‰ to 1.4‰ and −5.5‰ to −3.0‰, respectively.
(colour online) Stable isotope composition of the colluvial cement, calcite vein, and limestone clasts. The calcite vein shows the highest negative values of both δ13C and δ18O, whereas the limestone bedrock clasts have the lowest negative δ18O values and mainly positive δ13C values.

Stable isotope composition of carbonate samples. V-PDB, Vienna Pee Dee belemnite; CV, calcite vein.

GPR
Three GPR profiles undertaken perpendicular to the fault dip are presented having been combined with the t-LIDAR–derived DEM (Fig. 9a and b; see Fig. 3b for location). All three profiles are between 30 and 35 m long and are spaced between 10 and 20 m apart. All GPR profiles have distinct radar facies (Neal, Reference Neal2004). In particular, six are identified, five of which are repeated in each profile (Fig. 9a and b). Radar facies 1 (RF1) can be described as having planar-shaped parallel reflectors with a horizontal dip in relation to the hanging-wall slope surface. Because of the geometry of these reflectors, which end abruptly only a few metres along each profile, RF1 is interpreted as the subsurface continuation of the horizontally bedded limestone exposed in the footwall. Radar facies 2 (RF2) is described as having planar- to sinuous-shaped, parallel to subparallel reflectors, which are moderately continuous and have a horizontal dip in relation to the slope surface. RF2 is located in the top 10 to 30 cm of each profile and represents recent soil of the vegetated surface and was confirmed through trial pitting. Radar facies 3 (RF3) has discontinuous and sinuous shaped reflections, which are subparallel to oblique. Some hyperbolas are present indicating the presence of boulders. RF3 is located in all profiles beneath the recent soil layer in the first 20 m of each profile and is interpreted as anthropogenically affected colluvial deposits containing boulders of either limestone or cemented colluvium. Radar facies 4 (RF4) is perhaps the most interesting facies. It is present in all profiles up to about 20 m horizontal distance from the bedrock fault scarp. Only in the southernmost profile 1 is RF4 not present close to the fault plane; here RF4 begins approximately 8 m from the fault. This radar facies has low reflectance properties compared with the surrounding facies, which indicates that it is a significantly harder material. The reflections that are present can be described as planar to sinuous, parallel to subparallel, and discontinuous.
(colour online) (a) Uninterpreted and interpreted ground-penetrating radar (GPR) profiles at the Lastros Fault (see Fig. 3b for location). (b) Close-up view of interpreted GPR profile 3. RF, radar facies; TWT, two-way travel time.

Two trial pits were excavated on the northernmost GPR profile in order to see RF4 and its upper boundary. In both trial pits at 0.8 m, our hand tools could not dig any further because of cementation of the colluvial gravels; we therefore interpret RF4 as cemented colluvium. There are two other radar facies present in Figure 9: Radar facies 5 (RF5) is located beneath RF4 in both profile 3 (northernmost) and profile 2 (central profile). This is most likely a continuation of the cemented colluvium at depth. RF5 is also located up to 8 m from the fault plane in profile 3 and is most likely cemented. Radar facies 6 (RF6) is located further into the hanging wall. It has planar to sinuous, subparallel, moderately continuous reflections, and much higher reflectance properties than RF4 and RF5. We interpret RF6 as uncemented colluvium. The cemented colluvium (RF4 and RF5) stops quite abruptly about 20 m from the fault plane; this is particularly evident in profiles 2 and 3.
DISCUSSION
Cemented colluvium identification criteria
As first identified by Stewart and Hancock (Reference Stewart and Hancock1988, Reference Stewart and Hancock1990), the footwall of the Lastros Fault is brecciated, and this can be observed in areas where no cemented colluvium is attached to the fault. Where only thin sheets of breccia are located on the bedrock fault plane, it needs to be determined whether this breccia has been formed through the faulting process (cataclasite) or is actually the remnants of cemented colluvium attached to the fault plane. For a clear differentiation to be made, Table 2 shows the criteria that must be considered. Tectonic breccia (cataclasite) comes in two forms, compact breccia sheets and incohesive breccia belts (Fig. 4d). Distinguishing the latter from cemented colluvium is relatively simple because incohesive breccia belts often have no fine-grained matrix, and the clast boundary matching is moderate to high (Stewart and Hancock, Reference Stewart and Hancock1988); furthermore, phyllosilicate-rich pressure solution seams (Bullock et al., Reference Bullock, De Paola, Holsworth and Trabucho-Alexandre2014) are indicative of incohesive breccia belts and are not present in cemented colluvium (Table 2). To differentiate between compact breccia sheets and cemented colluvium, the internal structure, matrix composition, clast sizes, and clast angularity are the best criteria to consider. The presence of foliation (Bussolotto et al., Reference Bussolotto, Benedicto, Invernizzi, Micarelli, Plagnes and Deiana2007) is indicative of compact breccia sheets as foliation is not present in cemented colluvium. The matrix composition of cemented colluvium generally has a higher clay/mud content than the matrix of compact breccia sheets; however, an up to 2-mm-thick clay-rich gouge layer can sometimes coat the primary slip surface of compact breccia sheets (Bullock et al., Reference Bullock, De Paola, Holsworth and Trabucho-Alexandre2014). Furthermore, the cemented colluvium matrix can also have low clay content as observed in facies 1. Clast size and angularity should therefore also be considered. Compact breccia sheets have maximum clast sizes of 2.5 cm, which are moderate to subrounded (Stewart and Hancock, Reference Stewart and Hancock1988), whereas cemented colluvium has much larger clast sizes, which are more angular, indicating the short transport distances and physical weathering of the footwall limestone.
Criteria for differentiating fault breccia (cataclasite) and cemented colluvium on the Lastros Fault.

Note: Tectonic breccia attributes are mainly from Stewart and Hancock (Reference Stewart and Hancock1988, Reference Stewart and Hancock1990) who studied normal faults in carbonate rocks in the Aegean; further tectonic breccia characteristics are from Bussolotto et al. (Reference Bussolotto, Benedicto, Invernizzi, Micarelli, Plagnes and Deiana2007) and Bullock et al. (Reference Bullock, De Paola, Holsworth and Trabucho-Alexandre2014) who both studied normal faults in carbonate rocks in Italy.
Diagenetic interpretation of cement and lobe internal structure
The cement from facies 1 has a minor constituent of mud/clay, and the predominantly clast-supported nature of the facies is indicative of a rockfall deposit, which later became cemented because of the precipitation of calcite below ground. The minor constituent of mud/clay that is present in facies 1 most likely comes from pedogenic clays and silts, which formed after rockfall deposition and were washed into an originally porous gravel skeleton. The higher content of clay/mud in facies 2 and 3 is representative of debris flow deposits (e.g., Sanders et al., Reference Sanders, Ostermann and Kramers2010) where fines were incorporated into the cemented colluvium gravel matrix by the reworking of pedogenic clays and silts during mobilisation and deposition (Flügel, Reference Flügel2010). After deposition on the hanging-wall, calcite cement then precipitated in the pore spaces of the matrix.
The macroscopic and microscopic results from facies 1, 2, and 3 show that there is no significant difference between the calcite within the cement. Sparry calcite is present in all three facies, and it is only the size of the crystals that differ; with increasing clay content in facies 2 and 3, the calcite crystal sizes drop significantly reflecting the lack of void space for them to grow. Stable isotope values of δ13C and δ18O are also very similar for all three facies (Tables 1 and 3), and the values indicate that the source water has a meteoric origin and the deposit can be classified as a meteogene. The average δ13C value for all three facies is −7.95‰ (Table 3), which falls within the typical range for meteogenes; thermogenes have significantly higher δ13C values averaging 3.89‰ (Pentecost, Reference Pentecost2005). Dissolved inorganic carbon in groundwater is derived from two sources: from dissolution of organic carbon in the soil zone and from dissolution of inorganic carbon from carbonate aquifer rocks. Shallow groundwater leaving the soil zone is highly depleted in δ13C values (approximately −25‰; Deines et al., Reference Deines, Langmuir and Harmon1974), whereas deeper groundwater has δ13C values around 0‰. The average δ13C value of −7.95‰ for all three facies suggests that either the source spring water flowed through a portion of soil before precipitation of the calcite cement or rainwater has percolated through the soil zone and mixed with groundwater before calcite precipitation. In either case, this indicates that the cement formed from the dissolution of limestone in meteoric groundwaters charged with soil zone CO2. The gravel clasts within the cemented colluvium show no visible signs of dissolution, which implies that the calcium carbonate within the parent water was not derived from the host sediment. The calcite vein from within the colluvial sheet has lower δ13C and δ18O values than all the lobe facies (Table 3). However, the values still fall within the typical range for meteogenes (Pentecost, Reference Pentecost2005).
Average stable isotope values for facies 1, 2, and 3. V-PDB, Vienna Pee Dee belemnite.

Note: Values from secondary void edges and rims around dolomite clasts are excluded.
The form of calcite crystal can be used to help identify the hydrologic environment in which they precipitated. Drusy calcite crystals increasing in size towards the centre of the void are observed in all three facies and are typical of saturated zones. This would imply a phreatic environment, but saturated conditions can also occur in the vadose zone (Flügel, Reference Flügel2010) where there is a high water supply. There is both primary and secondary porosity within the analysed cements. Primary porosity is observed microscopically as remnant pores/voids that were not completely filled by calcite. Sparry calcite crystals often surround these primary pores (Fig. 6d and g, 7b), which are indicative of the cessation of saturated conditions. Secondary porosity is observed as larger pores/voids that can be observed macroscopically, which represent vadose eluviation and/or dissolution of the matrix (Fig. 5a and c; 6a, c, and e; 7a and c).
When δ18O concentrations of the facies cement are compared with contemporary spring water near Aghios Nikolaos (Fig. 1b), there is some enrichment within the facies cement. Leontiadis et al. (Reference Leontiadis, Payne and Christodoulou1988) analysed 19 samples of spring water and determined a mean δ18O concentration of −7.23‰. The average δ18O for all three cement facies is −5.01‰. This indicates that some evaporation of the groundwater is likely to have taken place prior to calcite precipitation. Evaporation is caused by surface and soil zone exposure and preferentially affects the lighter 16O isotopes leading to enrichment in δ18O. Furthermore, the majority of the samples by Leontiadis et al. (Reference Leontiadis, Payne and Christodoulou1988) were taken from higher altitudes than the lobe. There is progressive depletion of δ18O in rainwater at higher altitudes leading to more negative values compared with lower altitudes (Dotsika et al., Reference Dotsika, Lykoudis and Poutoukis2010). The temperature of the water will also have an effect on the δ18O concentrations, and oxygen isotope fractionation in speleothems has been shown to cause an increased oxygen isotope value with decreasing temperatures (Mühlinghaus et al., Reference Mühlinghaus, Scholz and Mangini2009). Palaeotemperature calculations of the parent water that formed for lobe cement are presented in the section “Palaeotemperature.”
The three different facies within the lobe are representative of the mass wasting process that formed them, with facies 1 representing a rockfall deposit and facies 2 and 3 representing debris flows. The facies would have originally been deposited in layers close to parallel with the hanging-wall surface. The dip angle of the lobe facies is hard to determine because of the cemented nature of the deposits and the high density of vegetation covering the surface. However, there are many hanging-wall catchment gullies on the Lastros Fault (Fig. 3a and b) where the dip of the colluvial layers can be accurately measured; this angle can also be observed in the GPR profiles (Fig. 9a and b). The average dip of the hanging-wall colluvium is 24°, and assuming this average for these facies layers allows the internal structure to be visualised. Figure 10a shows a cross section through the full extent of the lobe, and Figure 10b shows the sampled area in detail. The facies layers are all >1 m in thickness with the stratigraphically lowest facies 2 deposit considerably thicker. It should be noted that a further division of these layers would be likely with continuous sampling along the profile.
(colour online) (a) Cross section through the lobe (see Fig. 3c for location). (b) Cross section of sampled area showing the locations of the three facies; numbers represent samples taken at distances from the fault plane. m asl, meters above sea level.

The previous observations, in combination with the localised position of the cemented colluvium lobe with little lateral extension, clearly indicate that the cementation occurred in vadose zone conditions with the meteoric source water coming from a spring at the fault plane. The spring formed locally saturated zones in the vadose environment. This localised outflow allows cement to be precipitated at the source and immediately downstream of it, reflecting the channelling of flow in the vadose zone (Halley and Harris, Reference Halley and Harris1979) and formation of the lobe.
The lobe could be classified as a type of travertine. Altunel and Hancock (Reference Altunel and Hancock1993) describe similar hanging-wall morphologies from the Pamukkale Fault in western Turkey. The authors name locally cemented footwall-derived talus as “range-front travertines” deposited from spring water. They describe these morphological structures as heavily denuded and provide a provisional U/Th date of 66,000±5600 yr. Martínez-Díaz and Hernández-Enrile (Reference Martínez-Díaz and Hernández-Enrile2001) also describe range-front travertines at the Alhama de Murcia Fault in the Betic Cordillera, Spain. Here the fault allows spring water to issue out onto the slope cementing alluvial deposits. These structures in both Turkey and Spain are, however, formed from cement precipitation in thermal waters making them thermogenes.
Palaeotemperature
The temperature of the fluid from which the calcite cement precipitated can be calculated to infer what the climatic conditions were like at the time of precipitation. These palaeotemperature calculations assume isotopic equilibrium conditions. This means there is isotope exchange between the calcite and water phases (Pentecost, Reference Pentecost2005). Equilibrium isotope fractionation effects are temperature dependant and affect mainly the oxygen isotope composition, usually through degassing; fractionation effects of carbon isotopes are rather minor and only weakly temperature dependant (Letsch, Reference Letsch2014). For the lobe cement, excluding secondary void areas, there is a poor correlation between the δ13C and δ18O values (Fig. 8, solid squares) indicating that degassing is not a major factor (Hendy, Reference Hendy1971). Furthermore, when δ18O values are plotted against distance to the fault plane (Fig. 11), there are only minimal changes up to 40 m. An increase in δ18O at 51 m may be indicative of δ18O-depleted CO2 degassing; therefore, up to 40 m from the fault plane we can assume that the cement precipitated under isotopic equilibrium conditions and parent water palaeotemperature calculations can therefore be undertaken.
(colour online) The δ18O values of cement plotted against distance to the bedrock fault. Secondary void areas and rims are excluded.

There are several different equations in the literature that can be used to calculate the temperature of the precipitating fluid. We present the results using two equations. Hays and Grossman (Reference Hays and Grossman1991) used meteoric cements to formulate the following equation:
 $$t \left( {^{\circ}{\rm C}} \right){\,\equals\,}15.7{\,\minus\,}4.36\left( {{\rm \delta }_{c} {\,\minus\,} {\rm \delta }_{w} } \right){\plus}0.12\left( {{\rm \delta }_{c} {\,\minus\,} {\rm \delta }_{w} } \right)^{2} ,$$
where δ c is the oxygen isotope composition of the calcite measured in V-PDB, and δ w is the oxygen isotope composition of water measured in Vienna standard mean ocean water (VSMOW). Kim and O’Neil (Reference Kim and O’Neil1997) used nonmarine carbonates based on the earlier work of O’Neil et al. (Reference O’Neil, Clayton and Mayeda1969) and Freidman and O’Neil (Reference Friedman and O’Neil1977) to determine the following equation:
 $$10^{3} {\rm ln}\,\alpha _{{c{\minus}w}} {\,\equals\,}\left( {18.03{\times} 10^{3} } \right) {\,\div\,}T{\,\minus\,}32.42,$$
where T is temperature measured in degrees Kelvin, and α c−w is the oxygen equilibrium fractionation factor between calcite and water defined by:
 $${\rm \alpha }_{{c{\minus}w}} {\,\equals\,} {{1000{\plus} {\rm \delta }^{{18}} {\rm O}_{c} } \over {1000{\plus} {\rm \delta }^{{18}} {\rm O}_{w} }}$$
where δ18O c and δ18O w are the oxygen isotopic compositions of the calcite and water both measured in VSMOW.
Equations 1 and 2 both assume knowledge of the oxygen isotopic composition of the parent water from which the calcite precipitated, but this is unknown. However, investigations by Leontiadis et al. (Reference Leontiadis, Payne and Christodoulou1988) determined that the δ18O concentration from 19 samples of spring water near Aghios Nikolaos (Fig. 1b) have a mean value of −7.23‰. It is likely that the groundwater during the Pleistocene interglacial periods had a similar composition, and as Aghios Nikolaos is in close proximity to the Lastros Fault, one can accept this mean value as representative.
The results of these calculations based on the previous values are shown in Table 4. Secondary void areas have been excluded as the possibility of secondary precipitation renders their interpretation rather ambiguous. Using Eq. 1, the average crystallisation temperature for all cement samples is 7°C, and there is little difference between the three facies (Table 4). Using Eq. 2, the average temperature of all cements drops to 4°C. Groundwater temperatures are generally equal to the average annual air temperature above the land surface. The average air temperature for Crete at 2 m above ground was 17.5°C between 1961 and 1990 (Bank of Greece, 2011). As the altitude of the cement samples is from 460 to 480 m, the average air temperature must be corrected for altitude for a comparison to be made with water precipitation temperature. Assuming a lapse rate of 0.7°C for every 100 m in altitude (Flocas et al., Reference Flocas, Giles and Angouridakis1983), the current average air temperature at the altitude of the cement samples is 14°C. Therefore, the parent water palaeotemperature results indicate a climate between 7°C and 10°C cooler than present day. However, there is a possibility that the actual δ18O of the parent water was lower than the assumed value of −7.23‰ used in the calculations. When the δ18O of the parent water is decreased by 0.5‰, there is a 2°C increase in palaeotemperature, and this possibility cannot be excluded.
Crystallisation temperatures of calcite cement. VSMOW, Vienna standard mean ocean water.

Notes: Calculation 1 is from Hays and Grossman (Reference Hays and Grossman1991). Calculation 2 is from Kim and O’Neil (Reference Kim and O’Neil1997). The δ18O concentration of parent water is assumed to be −7.23‰ (Leontiadis et al., Reference Leontiadis, Payne and Christodoulou1988) for both calculations. If varied by ±0.5‰, there is a ±2°C change in the derived palaeotemperatures for both calculations.
Cement from facies 1 was tested for possible U-Th dating. Unfortunately, the mud/clay content within facies 1, although low, contained too much thorium to allow an accurate date to be determined. Therefore, a Marine Oxygen Isotope Stage (MIS) cannot be ascribed to the cement. Interglacial conditions are suggested by the relatively low values of δ13C (Tables 1 and 3) indicating groundwater charged with biogenic CO2 (Baker et al., Reference Baker, Ito, Smart and McEwan1997; Gradziński et al., Reference Gradziński, Hercman and Staniszewski2014) and the presence of the mud/clay within the cement matrix implying the presence of soil cover during colluvial deposition and cementation.
On Crete, periglacial processes are ongoing on the highest peaks (Hughes et al., Reference Hughes, Woodward and Gibbard2006), but no glaciers exist today. However, there is evidence of glaciers on Crete in the Pleistocene (Fabre and Maire, Reference Fabre and Maire1983; Nemec and Postma, Reference Nemec and Postma1993), and they were the southernmost glacial landforms in Europe (Poser, Reference Poser1957; Boenzi et al., Reference Boenzi, Palmentola, Sanso and Tromba1982; Fabre and Maire, Reference Fabre and Maire1983). Kuhlemann et al. (Reference Kuhlemann, Rohling, Krumrei, Kubric, Ivy-Ochs and Kucera2008) suggest that the air temperature around Crete during the last glacial maximum (23–19 ka) was 6.5°C to 7°C lower than today, but the sea temperature was only between 3°C and 4°C lower. The relatively warmer sea temperature compared with the air would have promoted the convection of moist air and high precipitation rates. The highest peak on Crete is more than 2400 m in height and located within the White Mountains in the west of the island (Fig. 1b). Alluvial fans were formed in this region because of ice cap melting and discharge of large amounts of meltwater. Five alternate periods of fan growth and abandonment are considered to be related to periods of deglaciation and reglaciation (Nemec and Postma, Reference Nemec and Postma1993). Pope et al. (Reference Pope, Candy and Skourtsos2016) undertook a sedimentologic and palaeoclimatic study of the Sphakia alluvial fan in this region carrying out optically stimulated luminescence and U-Th dating on several segments of the fan. The U-Th dates from carbonate cements within the representative fan sequence are 123.9±7.4, 75.4±2.9, 70.9±1.0, and 72.3±6.1 ka; one sample of pedogenic calcrete was dated at 59.0±2.3 ka. High groundwater levels were therefore causing cementation at these times, mostly between 70 and 75 ka, which was the transition from MIS 5a (warm climate) to MIS 4 (cold climate). Pope et al. (Reference Pope, Candy and Skourtsos2016) also show that alluviation of the fan was occurring during most climatic settings (interglacial, interstadial, and stadial episodes) throughout the last interglacial/glacial cycle because of high sediment supply from the catchment in the White Mountains (Fig. 1b). Further glacial features have been found on Mount Ida in the centre of the island (Fig. 1b). Here a cirque and associated moraines at an altitude of 1945 m have been identified (Fabre and Maire, Reference Fabre and Maire1983).
The Kapsos Mountain comprising the footwall block of the Lastros Fault has a maximum altitude of 980 m. It is therefore too low to have once hosted a permanent ice cap during Pleistocene glacial times, and there is no geomorphological evidence for this. However, the parent water palaeotemperature calculations (Table 4) suggest there would have likely been a snowcap on the mountain in winter months. The lobe cement precipitated at a maximum altitude of 480 m, and the top of the mountain is 980 m; therefore, average annual temperatures on top of the mountain at the time of cement precipitation were between 0°C (calculation 1) and −3°C (calculation 2) assuming lapse rate of 0.7°C for an increase of 100 m in altitude (Flocas et al., Reference Flocas, Giles and Angouridakis1983). High precipitation rates throughout the year and seasonal melting of the winter snow would have led to the high groundwater levels needed for spring activity at the fault plane and subsequent cementation. This is likely to have occurred during a transitional period soon after a glacial maximum, most likely following a Heinrich event (meltwater influx) (Dansgaard et al., Reference Dansgaard, Johnsen, Clausen, Dahljensen, Gundestrup, Hammer and Hvidberg1993) in the late Pleistocene. However, as Pope et al. (Reference Pope, Candy and Skourtsos2016) have shown cementation is also occurring on Crete during the transition between warm to cold climates where there are high-altitude catchment areas. Seasonal changes in palaeoclimate have also been observed after the last glacial maximum (LGM) by Kontakiotis (Reference Kontakiotis2016) who analysed planktonic foraminifera and their stable isotope concentrations from sea cores in the northern and southern Aegean Sea. Kontakiotis (Reference Kontakiotis2016) determined that the seasonal changes in palaeoclimate were most pronounced during the transition from LGM to deglaciation between 15.1 and 12.9 ka. This was caused by sea surface temperature variability in the Aegean, where humid air from Africa increased precipitation and river runoff. It is therefore likely that seasonal hanging-wall colluvial cementation was occurring following and perhaps preceding most deglaciation stages in the late Pleistocene, with the cold temperatures controlling cement precipitation. Cemented colluvium is therefore likely to be present deeper in the hanging-wall having been formed at earlier deglaciation stages and then subsequently buried.
CEMENTED COLLUVIUM FORMATION AND FAULT EVOLUTION
The sheets and lobes of cemented colluvium are clearly visible in the fault zone morphology. However, the GPR data (Fig. 9a and b) show that there is cemented colluvium present in the hanging-wall subsurface below uncemented colluvium. In all three GPR profiles, the cemented colluvium (RF4 and RF5 in Fig. 9a and b) stops approximately 20 m downslope of the scarp; this is particularly evident in profiles 2 and 3 where there is a sharp boundary between the cemented and uncemented colluvium. This boundary represents either the downslope extent of vadose zone seasonal cementation formation or the presence of a secondary fault in the hanging-wall. There is no topographic expression for a secondary fault, but this may be because of the construction of ancient anthropogenic terraces that affected the uppermost 1 m of the hanging-wall. Nevertheless, the presence of cemented colluvium in the subsurface below uncemented colluvium shows that throughout the Pleistocene the surface springs at the fault plane were not restricted to the areas where cemented colluvial deposits are currently exposed at the surface. Groundwater was seasonally high enough to form large cemented areas along strike, most likely through multiple springs. Fault activity then most likely disrupted the groundwater flow path (e.g., Michetti et al., Reference Michetti, Esposito, Guerrieri, Porfido, Serva, Tatevossian and Vittori2007) causing the cessation of some springs; colluvial deposition then continued burying the cemented deposits.
The proposed model for the temporal development of the fault and formation of the cemented colluvium is presented in Figure 12. After fault initiation (Fig. 12a), the hanging-wall block was continually downthrown during successive ruptures throughout the Pleistocene, and the volume this created was filled with colluvium (Fig. 12b). Freeze-thaw physical weathering in the glacial periods throughout the late Pleistocene helped break and dislodge the brecciated footwall limestone (Tucker et al., Reference Tucker, McCoy, Whittaker, Roberts, Lancaster and Phillips2011). Mostly gravel-sized limestone fragments in rockfalls and debris flows were then deposited on the hanging-wall (Fig. 12b). The rate of colluvium deposition was higher than the fault’s slip rate, and no bedrock scarp was exposed. During late Pleistocene transitions towards interglacial periods, soil cover developed and seasonal snowmelt and precipitation raised groundwater levels and pore pressures. Because of the preferential pathway of the fault, groundwater then began issuing out into the hanging-wall at localised positions along strike (Fig. 12c). The brecciated footwall limestone may have also contributed to preferential fluid flow. At these spring positions, calcite cement then precipitated in between the colluvial gravels. During gravel cementation, the colluvium also fused to the bedrock footwall. In late Pleistocene interglacial periods (Fig. 12d), the increased temperature caused the water table to drop, and spring activity ceased. Fault ruptures continued, and the sedimentation rate of hanging-wall colluvium was lower than the fault’s slip rate allowing the bedrock fault plane to be exposed (Fig. 12d). Soil cover reduced because of the development of semiarid conditions. During each rupture, the cemented colluvium is uplifted along with the footwall exhuming the areas of hanging-wall where cementation has occurred. Repetition of glacial to interglacial phases (Fig. 12b–d) is then likely to have occurred. In the Holocene (Fig. 12e), fault ruptures continued to expose the fault scarp and cemented areas causing them to grow in height. Farming during historical times (Fig. 12f) then further exhumed the lower parts of the fault scarp by terrace construction to utilise water runoff. This also increases the height of colluvial sheets and increases the exposed size of the cemented lobe.
(colour online) Schematic diagrams showing phases of fault evolution and formation of the cemented colluvium. (a) Carbonate rock of the Mani geotectonic unit is fractured during the initiation of faulting. (b) Footwall derived colluvium is deposited on the hanging-wall by rockfall (RF) and debris flows (DF) predominantly during glacial conditions. No fault scarp is exposed. (c) Seasonal groundwater percolates through brecciated bedrock and the fault springing at localised positions along the footwall—hanging-wall boundary during a transitional period soon after a glacial maximum. Calcite precipitates between the hanging-wall colluvial gravel clasts at these positions. Erosion of the footwall and sedimentation on the hanging-wall reduces, and the fault scarp begins to be exposed by recurrent earthquakes. (d) Higher temperatures and a dry climate during interglacial conditions lower the groundwater table reducing spring activity and cement precipitation. The fault scarp continues to be exposed by recurrent earthquakes. Cemented colluvial sheets and lobes have become fused to the footwall and are also consistently uplifted during these extension events. Possible repetitions of phases b to d then occur. (e) During the Holocene, the fault scarp and cemented colluvial sheets and lobes grow from continued exposure by recurrent earthquakes. (f) Artificial terraces are constructed in the hanging-wall below the fault scarp during historical times further exposing the bedrock scarp.

CONCLUSIONS
Cemented colluvium located on the hanging-wall of the Lastros Fault forms sheets and lobes often attached to the fault plane. The cemented colluvium can be described as a breccia with predominantly limestone clasts within a carbonate cement matrix that contains varying amounts of mud/clay. This mud/clay content in combination with clast size and angularity can be used to distinguish between cemented colluvium, derived from rockfalls and debris flows, and fault cataclasite. The stable isotope values of carbon and oxygen from the cement show that the cement formed from the dissolution of limestone in meteoric groundwaters charged with soil zone CO2. The deposit can therefore be classified as a meteogene. The localised positons of the cemented colluvium along the fault are indicative of individual springs issuing water into the hanging-wall. Palaeotemperature calculations of the parent water from which the cement precipitated indicate a climate between 7°C and 10°C colder than today’s average annual temperature on Crete when corrected for altitude. This is indicative of a transitional period between glacial and intergalcial conditions, most likely in the late Pleistocene. Cemented colluvium is also present in the shallow subsurface of the hanging-wall below uncemented colluvium indicating an earlier phase of spring activity and high groundwater levels. The distribution of cemented colluvium and the stable isotope values can be used as a proxy for climatic conditions and landscape evolution.
ACKNOWLEDGMENTS
The authors would like to thank Dr. Andreas Mackensen from the Alfred Wegener Institute in Bremerhaven, Germany, for deriving the stable isotope compositions, and also Tobias Baumeister and Lauretta Kaerger for their help in the field. We also thank Manolis from the Zorbas Taverna in Pachia Ammos for his great hospitality. The thoughtful comments from an anonymous reviewer helped to improve the manuscript. Thanks also go to the editors, J. Urrutia Fucugauchi and Nicholas Lancaster, for further constructive comments.



