INTRODUCTION
It is of common knowledge that the production and distribution of radiocarbon (14C) on Earth is not constant over time, so 14C ages are not reliable calendar ages and therefore must be corrected through calibration curves (Stuiver et al. Reference Stuiver, Reimer, Bard, Beck, Burr, Hughen, Kromer, McCormac, van der Plicht and Spurk1998). These curves are constructed empirically and have been updated over the years with data from different regions of the globe extending the time range to 50,000 BP. The most recent curves are the IntCal13 and the SHCal13 for terrestrial samples from the Northern (Reimer et al. Reference Reimer, Bard, Bayliss, Beck, Blackwell, Bronk, Buck, Cheng, Edwards, Friedrich, Grootes, Guilderson, Haflidason, Hajdas, Hatté, Heaton, Hoffmann, Hogg, Hughen, Kaiser, Kromer, Manning, Niu, Reimer, Richards, Scott, Southon, Staff, Turney and van der Plicht2013) and Southern Hemispheres (Hogg et al. Reference Hogg, Hua, Blackwell, Niu, Buck, Guilderson, Heaton, Palmer, Reimer, Reimer, Turney and Zimmerman2013), respectively, the Marine13 for marine samples (Reimer et al. Reference Reimer, Bard, Bayliss, Beck, Blackwell, Bronk, Buck, Cheng, Edwards, Friedrich, Grootes, Guilderson, Haflidason, Hajdas, Hatté, Heaton, Hoffmann, Hogg, Hughen, Kaiser, Kromer, Manning, Niu, Reimer, Richards, Scott, Southon, Staff, Turney and van der Plicht2013), and the bomb peak curves (Hua et al. Reference Hua, Barbetti and Rakowski2013).
The marine curve reflects the depleted 14C concentration (marine reservoir effect—MRE) of the ocean and represents the global surface age, to be used after incorporation of local ΔR offsets (Stuiver et al. Reference Stuiver, Reimer, Bard, Beck, Burr, Hughen, Kromer, McCormac, van der Plicht and Spurk1998; Alves et al. Reference Alves, Macario, Ascough and Bronk2018). The need for distinct curves for the hemispheres is due to the discrepancies that occur between the atmospheric reservoirs, causing an offset of approximately 56 ± 24 14C yr (McCormac et al. Reference McCormac, Hogg, Blackwell, Buck, Higham and Reimer2004). The air/ocean interface exchange returns the carbonates dissolved in the ocean to the atmosphere, and since the oceanic surface is larger in the SH, it exhibits lower 14C activities relative to the NH (Levin et al. Reference Levin, Kromer, Wagenbach and Münnich1987; Rodgers et al. Reference Rodgers, Mikaloff-Fletcher, Bianchi, Beaulieu, Galbraith, Gnanadesikan, Hogg, Iudicone, Lintner, Naegler, Reimer, Sarmiento and Slater2011). This difference is not reduced by the wind currents, since the equatorial trade winds is subject to tropospheric upper level divergence associated with deep convective cores of the Intertropical Convergence Zone (ITCZ), preventing the homogenization of the atmospheric reservoir. For this reason, the existence of specific calibration curves for the two hemispheres is fundamental. In addition to natural effects that alter the activity of the radioisotope in the atmosphere and distribution of 14C on Earth, the anthropogenic effects must be considered. In the period from ca. 1850 AD on, the Suess effect, caused by the burning of fossil fuels since industrial revolution, diluted the radioisotope which result in a 2% reduction of its concentration in the atmosphere (Suess Reference Suess1955; van der Plicht Reference van der Plicht and Elias2007). As a consequence, the Suess effect turns the results of 14C dating relatively ambiguous at certain time intervals within this period. After 1950, due to the nuclear tests, the 14C levels in the atmosphere rose abruptly, reaching twice as much above the natural levels in some places of the globe (van der Plicht Reference van der Plicht and Elias2007). On the other hand, there was no complete homogenization of the CO2 in the atmosphere because of the ITCZ activity, so different curves were constructed for calibration with 14C measurements compiled for the period 1950–2010 by considering the ITCZ position (Hua et al. Reference Hua, Barbetti and Rakowski2013).
The samples used to build all these datasets need to be in isotopic equilibrium with the coeval atmosphere and therefore those with periodic growth or that leave some kind of annual records are of great importance for the construction of the calibration curves. Among the different types of materials used are the dendrochronologically dated tree rings. Within the IntCal curve dataset, trees are responsible for the youngest period, ranging from 13,900 cal BP to the present (Reimer et al. Reference Reimer, Bard, Bayliss, Beck, Blackwell, Bronk, Buck, Cheng, Edwards, Friedrich, Grootes, Guilderson, Haflidason, Hajdas, Hatté, Heaton, Hoffmann, Hogg, Hughen, Kaiser, Kromer, Manning, Niu, Reimer, Richards, Scott, Southon, Staff, Turney and van der Plicht2013). The SHCal13 curve is based on limited tree ring data from regions of SH for 0–2145 cal BP, with an extension to 50,000 cal BP using adjusted IntCal13 data and modeled by an average offset of 43 ± 23 yr (Hogg et al. Reference Hogg, Hua, Blackwell, Niu, Buck, Guilderson, Heaton, Palmer, Reimer, Reimer, Turney and Zimmerman2013). The 1950–2010 AD calibration curves were constructed with tree rings and atmospheric CO2 records (Hua et al. Reference Hua, Barbetti and Rakowski2013).
Despite the great diversity of tropical species, only a few points in South America were used to construct these curves, mostly using trees from temperate or boreal regions. One of the reasons is that no long chronologies could be established as fossil trees are rarely found in good preservation conditions. Of course, the other important issue is to guarantee that no rings are missing or false rings are misinterpreted. The main reason for growth or death of cells is the stress caused by seasonal frost and according to Cook and Kiriukstis (Reference Cook and Kairiukstis1989), tropical region species are seldom suitable for dendrochronology. However, a strong correlation of growth with rain season can produce reliable annual records in some species from tropical South America (Baker et al. Reference Baker, Santos, Gloor and Brienen2017). Studies based on species such as Cedrela sp., Araucaria angustifolia, Enterolobium maximum and Hymenolobium petraeum have shown encouraging results (Santos et al. Reference Santos, Linares, Lisi and Tomazello2015; Baker et al. Reference Baker, Santos, Gloor and Brienen2017; Linares et al. Reference Linares, Santos, Brandes, Barros, Lisi, Balieiro and de Faria2017). With the aim of validating dendrochronological records as reliable 14C datasets, the first step is to evaluate the known atmospheric 14C concentration in comparison to 14C-dated rings, preferably in a period when subtle variations can be perceived. In 14C dating, the bomb peak curve can be used as a fundamental tracer to validate annual growth rings.
Baker et al. (Reference Baker, Santos, Gloor and Brienen2017) tested the annual growth of a Cedrela species and the factors controlling ring formation, the bomb peak curve was used to test the periodicity of ring formation of Cedrela trees in four countries of South America. In Bolivia, Ecuador, and Venezuela, growth rings were proved to be annual, while in Suriname trees regularly formed two rings per year due to fact that rain seasons have peaks in January and June, with a bimodal distribution of precipitation (Baker et al. Reference Baker, Santos, Gloor and Brienen2017).
There are still very few research papers in Brazil regarding 14C dating with dendrochronology to validate the annual growth of tree species or use of data to refine the 14C calibration curve. Some research was done for this purpose for Araucaria angustifolia in the region of Minas Gerais, Brazil (Santos et al. Reference Santos, Linares, Lisi and Tomazello2015). Their results showed a remarkable agreement with the data of the rings dated by 14C with the compilation data set of Hua et al. (Reference Hua, Barbetti and Rakowski2013) for Zone 1-2, disclosing the potential of this subtropical tree species. Linares et al. (Reference Linares, Santos, Brandes, Barros, Lisi, Balieiro and de Faria2017) tested individuals from the northern region of Brazil (Porto Trombetas, Pará) of three different species: Dipteryx magnifica, Enterolobium maximum and Hymenolobium petraeum. The authors concluded that the 14C signal for E. maximum and H. petraeum exhibited an excellent correspondence with the Zone 3 curve of Hua et al. (Reference Hua, Barbetti and Rakowski2013) and suggested annual seasonality in growth ring formation (Linares et al. Reference Linares, Santos, Brandes, Barros, Lisi, Balieiro and de Faria2017). The Dipteryx magnifica, on the other hand, presented discrepancies in the 14C measurements that the authors attributed to possible difficulties in identifying ring boundaries with accuracy (Linares et al. Reference Linares, Santos, Brandes, Barros, Lisi, Balieiro and de Faria2017).
As pointed out by Baker et al. (Reference Baker, Santos, Gloor and Brienen2017) not only do the species need to be tested against the bomb peak curve, but also studies conducted in new locations in the tropics require first a validation of the annual growth of tree rings regardless of how the species studied behave in other locations. In the present work, we investigate the 14C concentration for an individual of the species Cedrela fissilis from the region of Minas Gerais, Brazil.
STUDY REGION
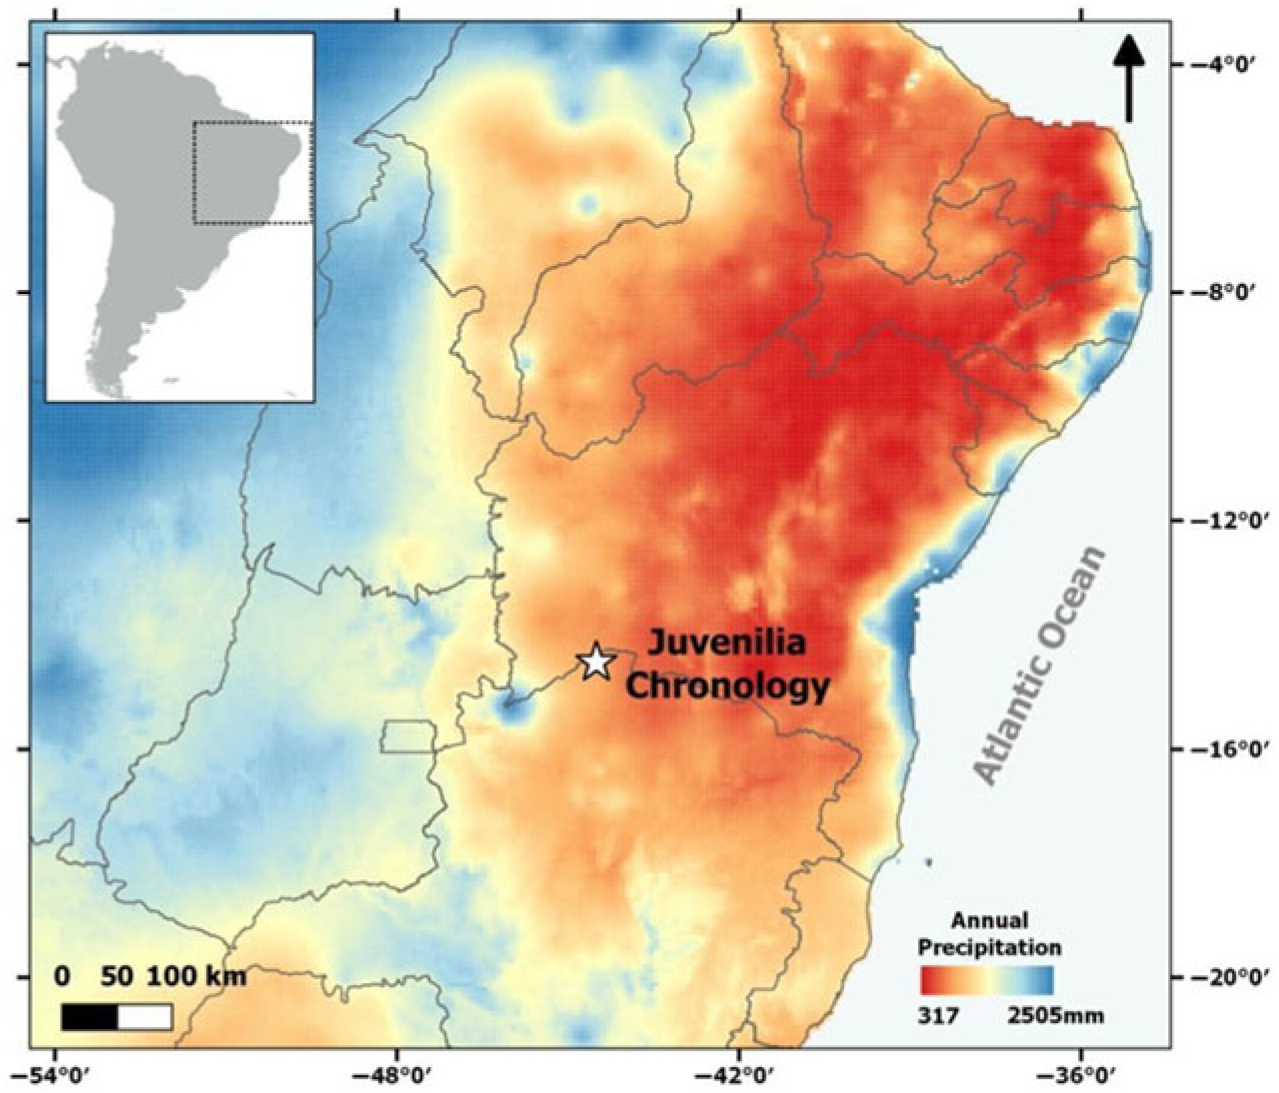
The tree used in this study integrates the “Juvenilia Chronology collection” (Pereira et al. Reference Pereira, Barbosa, Torbenson, Stahle, Granato-Souza, Santos and Barbosa2018; NOAA 2018) and was sampled in the northern Minas Gerais state, Brazil (14°30′10.08"S, 44°10′4.08"W at 507 m asl altitude), in a seasonally dry tropical forest fragment (Figure 1). The region corresponds to the southern limit of the “Brazilian Drought Polygon” and according with Köppen Climate Classification, the climate is a transition between two types of climate: Aw—tropical savannah with dry winter and BSh—hot semi-arid (Rubel and Kottek Reference Rubel and Kottek2010). The regional precipitation is due to activity of the South Atlantic Convergence Zone (SACZ), which is one of the main features of the South American Monsoon System during the austral summer, associated with intense convective activity in the Amazon region (Garreaud et al. Reference Garreaud, Vuille, Compagnucci and Marengo2009). The SACZ extends southeastward from the core of the continent to the South Atlantic (Vera et al. Reference Vera, Higgins, Amador, Ambrizzi, Garreaud, Gochis, Gutzler, Lettenmaier, Marengo, Mechoso, Nogues-Paegle, Silva Dias and Zhang2006). Once the monsoon season comes to an end, rainfall basically ceases from May to October.
Site location in the northern Minas Gerais state, Brazil. Colored shades (please, refer to online version) show average annual precipitation gradient (1970–2000) obtained from World Clim version 2 (Fick and Hijmans Reference Fick and Hijmans2017).

In Figure 2 we show the Climatological Normal (period 1961–1990) from the nearest meteorological station (Cariranha-BA; WMO station code: 83408), where we can observe the strong seasonality of rainfall in the region, the rainy season (from October to March) comprises 90.7% of the total annual precipitation (814 mm). The annual temperature is about 25.0°C, ranging between 15.3°C and 32.8°C over the entire year.
Climatological Normal from Carinhanha—BA Station (ID:83408), period 1961–1990, showing total monthly precipitation, average monthly temperature, minimum monthly temperature, and maximum monthly temperature.

The seasonally dry tropical forest formations are found in this ecotonal zone between caatinga (xeric woodland), cerrado (Brazilian savannah) and Atlantic rain forest, where the rainfall seasonality synchronizes plant growth with soil moisture availability, inducing the formation of annual rings (Murphy and Lugo Reference Murphy and Lugo1986; Worbes Reference Worbes1995; Stahle Reference Stahle1999). The species Cedrela fissilis has wide distribution in these forest formations and many authors report the potential of the Cedrela genus for tree-ring studies in the neotropics (Tomazello et al. Reference Tomazello, Botosso and Lisi2000; Brienen and Zuidema Reference Brienen and Zuidema2005; Dünisch Reference Dünisch2005; Brienen et al. Reference Brienen, Lebrija-Trejos, Zuidema and Martínez-Ramos2010, Reference Brienen, Helle, Pons, Guyot and Gloor2012; Granato-Souza et al. Reference Granato-Souza, Stahle, Barbosa, Feng, Torbenson, de Assis Pereira, Schöngart, Barbosa and Griffin2019; Pereira et al. Reference Pereira, Barbosa, Torbenson, Stahle, Granato-Souza, Santos and Barbosa2018).
METHODS
Dendrochronology
The samples from Juvenilia Chronology (Pereira et al. Reference Pereira, Barbosa, Torbenson, Stahle, Granato-Souza, Santos and Barbosa2018) were prepared following standard dendrochronological procedures and crossdating was identified using the skeleton plot technique (Stokes and Smiley Reference Stokes and Smiley1968). The tree CEFI113 from this collection was used for the validation of the rings (Figure 3); we selected dendrochronologically dated rings by observing some points in the bomb peak SH zone 1-2 curve. The selected rings correspond to the years 1958, 1960, 1963, 1965, 1970, 1975, 1980 and rings next to the bark (2014, 2015, and 2016).
Dated core of the tree CEFI113 showing the tree rings selected for 14C analysis (black arrows).

14C Measurements
To have their isotope ratio measured by the AMS technique, it is necessary that the samples are chemically treated to remove exogenous carbon and converted to a suitable matrix, in our case, graphite. All the preparation and treatment of the samples were carried out in Radiocarbon Laboratory of the Federal University of Fluminense, Brazil (LAC-UFF; Macario et al. Reference Macario, Oliveira, Carvalho, Santos, Xu, Chanca, Alves, Jou, Oliveira, Pereira, Moreira, Muniz, Linares, Gomes, Anjos, Castro, Anjos, Marques and Rodrigues2015). Physical treatment was carried out to remove external contaminants through washing with ultra-pure (UP) water and chemical treatments until the conversion of wood to graphite. The protocol used for organic samples in general in LAC-UFF is acid-base-acid (ABA). Samples are inserted into 13-mm vial tubes with a mass of 20–30 mg for the treatment. The ABA protocol consists of adding 1.0M HCl acid for 2 hr at 90ºC in order to remove the inorganic fraction present in the sample, the process is repeated until the liquid becomes clear. After a 1.0M NaOH base is added for 1 hr at 90°C temperature, the process is repeated until the liquid is clear. This washing removes the humic and fulvic acids corresponding to decomposition. Acidification is repeated to eliminate possible contaminants adhered (Goh and Molloy Reference Goh and Molloy1972; Hedges et al. Reference Hedges, Housley, Law and Bronk1989). In the treatment for tree rings, in addition to ABA, a bleaching step is necessary, which aims to extract holocellulose. This step is important because it extracts the best-preserved compounds from the wood (Leavitt et al. Reference Leavitt and Danzer1993; Hajdas et al. Reference Hajdas, Hendriks, Fontana and Monegato2017). Holocellulose is extracted with 1.0 M sodium hydrochloride (NaClO2) and 1.0 M hydrochloric acid (HCl) at 70°C for 3–4 hr, the process is repeated until the sample turns white (Santos et al. Reference Santos, Bird, Pillans, Fifield, Alloway, Chappell, Hausladen and Arneth2001; Southon and Magana Reference Southon and Magana2010; Santos and Ormsby Reference Santos and Ormsby2013). After bleaching, the holocellulose was rinsed 3 times with UP water and dried at 60°C. After combustion of the pretreated samples at 900°C for 3 hr, the CO2 evolved was cryogenically purified under vacuum lower than 10–3 Torr (Anjos et al. Reference Anjos, Macario, Gomes, Linares, Queiroz and Carvalho2013). Graphitization was performed following the Zinc (Zn), titanium hydride (TiH2) and iron (Fe) catalyst, with modified reduction at 550°C during 7 hr in a muffle (Xu et al. Reference Xu, Trumbore, Zheng, Southon, McDuffee, Luttgen and Liu2007; Macario et al. Reference Macario, Oliveira, Carvalho, Santos, Xu, Chanca, Alves, Jou, Oliveira, Pereira, Moreira, Muniz, Linares, Gomes, Anjos, Castro, Anjos, Marques and Rodrigues2015). The graphite samples were pressed in cathodes and measured in the Center for Applied Isotope Studies (CAIS) at the University of Georgia, USA (Cherkinsky et al. Reference Cherkinsky, Culp, Dvoracek and Noakes2010).
Calibration
The results were calibrated with the software OxCal v4.3 (Bronk Ramsey Reference Bronk2009) using the Bomb13SH1-2 curve (Hua et al. Reference Hua, Barbetti and Rakowski2013). Calibration was performed using the tree ring model V_sequence, in which the results are grouped, considering the chronological growth sequence (Bronk Ramsey Reference Bronk2008) (the ages of internal rings assumed to be older than that of external rings) and taking into account a priori information (from dendrochronology) of the estimated age gap between the rings (Bronk Ramsey et al. Reference Bronk, van der Plicht and Weninger2001).
RESULTS AND DISCUSSION
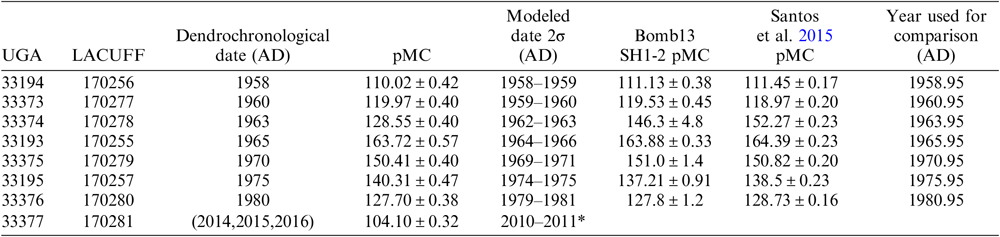
The obtained results for the Cedrela fissilis tree rings are shown in Table 1, where the percent modern carbon (pMC), the uncertainty, the dendrochronological dating of each ring and respective calibrated dates are presented. Table 1 also shows the corresponding pMC values of the Bomb13 SH1-2 curve and Santos et al. (Reference Santos, Linares, Lisi and Tomazello2015).
LAC-UFF and UGA codes, dendrochronological year (AD), pMC and cal ages (AD) for this work and corresponding pMC values of the Bomb13 SH1-2 curve and Santos et al. (Reference Santos, Linares, Lisi and Tomazello2015).

* Since the data from Hua et al. (Reference Hua, Barbetti and Rakowski2013) covers the period up to 2010.
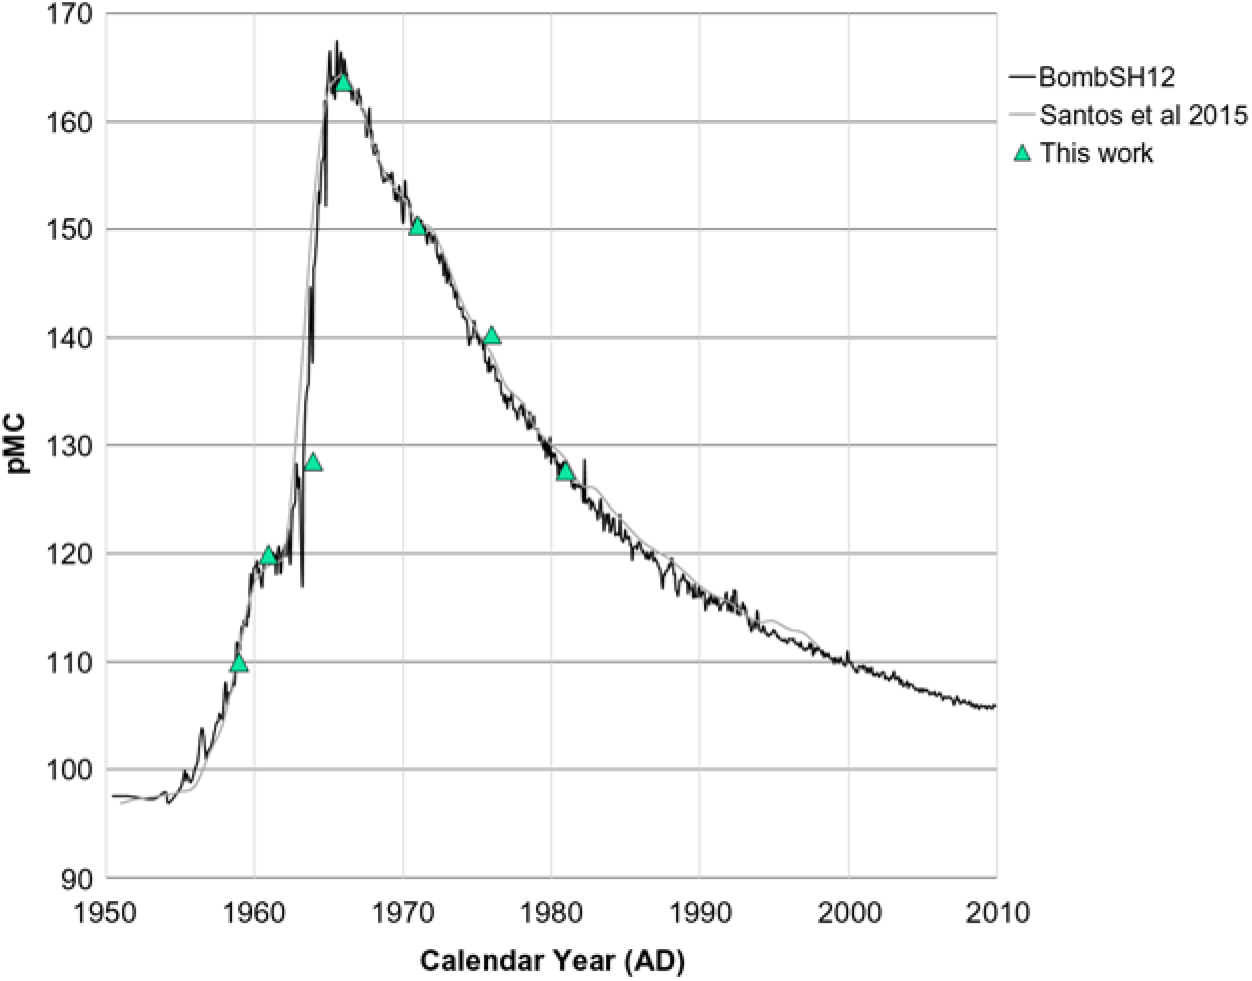
Plotting the results of the measured 14C concentration against the dendrochronologically dated years (Figure 4) it is possible to infer that the results follow the pattern of the atmospheric bomb peak curve Bomb13SH1-2. Our results are also comparable to those obtained from an Araucaria angustifolia tree by Santos et al. (Reference Santos, Linares, Lisi and Tomazello2015). Both results indicate that despite the bomb peak curve for zones 1–2 was developed from data from other regions, it successfully describes the pattern of 14C concentration in central Brazil after 1950. Although we have few points for an accurate statistical evaluation, we found a chi-square value of 1.0 for comparison with the Bomb13SH1-2 curve and 1.0 for Santos et al. (Reference Santos, Linares, Lisi and Tomazello2015) and a correlation value of 0.93 for the curve Bomb13SH1-2 and 0.89 for Santos et al. (Reference Santos, Linares, Lisi and Tomazello2015). We used the months of December of each year (due to the seasonality of the precipitation with peaks during the summer besides the greater availability of sunlight) to check for correlation with Bomb13SH1-2 curve and the data from Santos et al. Reference Santos, Linares, Lisi and Tomazello2015. For the year 1963 we can observe that in this study the pMC was a little lower than expected. At this point the curve has a rapid growth, any sampling greater than the exact ring size could result in a very different value. We can also see a slight variation for the year 1975 which can be associated with the decrease in 14C concentration. As the growth is associated with precipitation, there is always the possibility of eventual strong rains. However, the Araucaria angustifolia (Santos et al. Reference Santos, Linares, Lisi and Tomazello2015) grew in a region nearby and such event should have affected both individuals.
Plot of the data curve Bomb13SH1-2 (Hua et al. Reference Hua, Barbetti and Rakowski2013)—black line, with the data of Aruacária (Santos et al. Reference Santos, Linares, Lisi and Tomazello2015)—grey line, and this work—green triangles.

One of the purposes of improving precision and accuracy of 14C calibration curves is to enable better calibration of results from unknown samples. In the case of the bomb peak’s curve many studies depend upon the knowledge of the curve as input data for carbon exchange models (e.g. Sierra et al. Reference Sierra, Müller and Trumbore2014), validating sample materials for archaeological dating (Macario et al. Reference Macario, Alves, Carvalho, Oliveira, Bronk, Chivall, Souza, Simone and Cavallari2016) and forensic studies (Buchholz and Spalding Reference Buchholz and Spalding2010; Uno et al. Reference Uno, Quade, Fisher, Wittemyer, Douglas-Hamilton, Andanje, Omondi, Litoroh and Cerling2013).
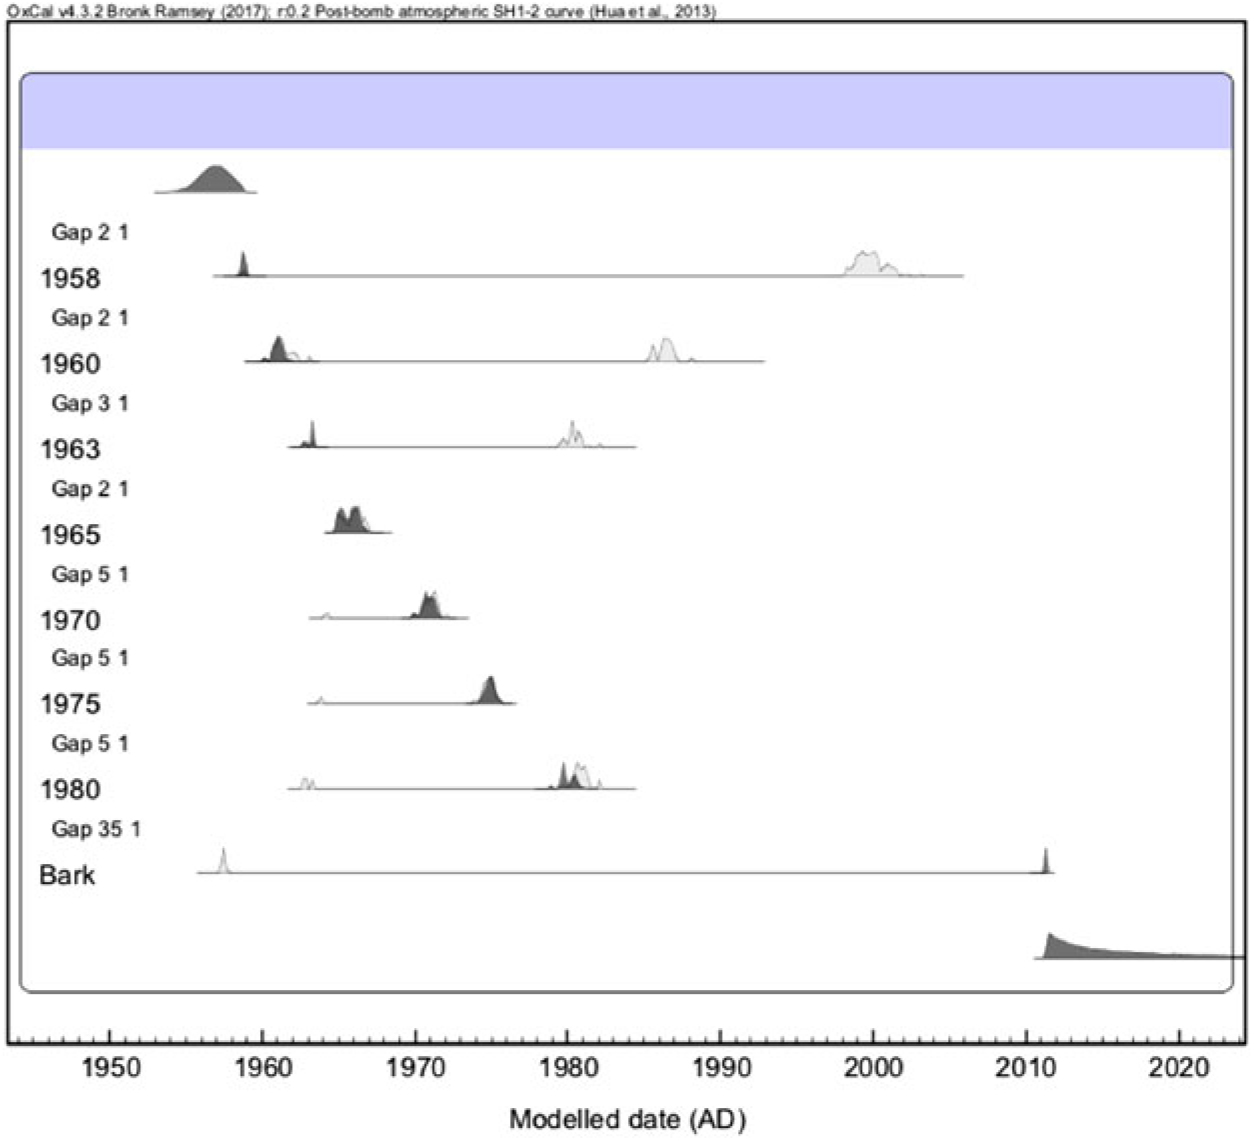
For some years there are ambiguities in the curve, and therefore the probability distributions have two separate ranges. For example, when observing the distribution for the dendrochronological year 1958, the intervals for 2σ of confidence consist of 1958, this being more unlikely, and 1998 to 2001 being more likely. However, whenever two samples with a known order are available, the ambiguity can be removed by using a sequence model (Bronk Ramsey Reference Bronk2009). The same way, sequence models can be used to test the validity of dendrochronologically dated rings. In order to verify the possibility of any missing or misinterpreted ring, we used a V_sequence model. The so-called wiggle matching has been largely used as a means to improve calibration of set of related samples (e.g. van der Plicht et al. Reference van der Plicht, Jansma and Kars1995; Speranza et al. Reference Speranza, van der Plicht and van Geel2000; Hogg et al. Reference Hogg, Higham, Lowe, Palmer, Reimer and Newnham2003; Galimberti et al. Reference Galimberti, Bronk and Manning2004). Through this kind of analysis, the isotopic concentration of the rings is ordered in time, considering the gaps provided by dendrochronologically reported years. The multiplot for the sequence is presented in Figure 5. Observing the plot, we see that the data are very consistent, obeying the same addition of 14C and decrease according to the dendrochronological years reported. Considering the model, it was possible to verify that the growth of this particular individual of Cedrela fissilis has a pattern of annual rings, compatible to the rainfall season for the region.
Multiplot of calibrated ages probability distributions, curve Bomb13SH1-2 (Hua et al. Reference Hua, Barbetti and Rakowski2013) using OxCal v4.3 with V_sequence model, Bronk Ramsey (Reference Bronk2009).

CONCLUSIONS AND FUTURE PERSPECTIVES
The Cedrela fissilis individual presented very consistent annual rings. It was also possible to verify that, although the SH zone 1–2 bomb peak curve does not have compiled data corresponding to the Brazilian region, the Cedrela presented the same percent modern carbon, also validating the curve for this region as it was done in Santos et al. (Reference Santos, Linares, Lisi and Tomazello2015). As a future perspective, it would be desirable to extend the chronology for the period prior to 1950, corresponding to the Suess effect. This will be possible in the near future using century-long chronologies that are currently under development for this region. With the validated annual growth, it is possible to measure the carbon concentrations of this important period where there are many fluctuations in carbon concentration. Once this is achieved, wiggle-matching can be applied to locate the inflection points and fit the chronology in the curve, improving and adding data that can be compiled in updates of the SHCal13.
ACKNOWLEDGMENTS
The authors would like to thank the Brazilian financial agencies CNPq (Conselho Nacional de Desenvolvimento Científico e Tecnológico, 307771/2017-2 and INCT-FNA, 464898/2014-5), FAPERJ (Fundação Carlos Chagas Filho de Amparo à Pesquisa do Estado do Rio de Janeiro, E-26/110.138/2014 and E26/203.019/2016) and FAPEMIG (Fundação de Amparo à Pesquisa de Minas Gerais, grant APQ-02541-14) for their support. This study was financed in part by the Coordenação de Aperfeiçoamento de Pessoal de Nível Superior - Brasil (CAPES) - Finance Code 001. This research was also directly benefited by the project PIRE NSF-FAPESP to F.W.C, grant 2017/50085-3. We thank the editors and reviewers for the comments and suggestions that helped to improve the quality of our paper.