1 Introduction
Annuities have been in the mainstay of economic research ever since Yaari (Reference Yaari1965) proved that non-altruistic individuals facing mortality risk should fully annuitize their assets. Annuities are life-insured financial products that pay out conditional on the survival of the individual. In contrast to regular financial products, annuities pay a premium that compensates the individual for the fact that unused assets flow to the life-insurance firm upon death of the annuitant. Recently, Davidoff et al. (Reference Davidoff, Brown and Diamond2005) have reasserted and extended Yaari's results by showing that full annuitization of assets remains optimal even if annuities are imperfect, in the sense that the premium is not actuarially fair. In fact, Davidoff et al. show in a partial equilibrium framework that full annuitization is optimal as long as the premium received on the annuities is positive.
In spite of the seminal contributions by Yaari and Davidoff et al., the true market for annuities is notoriously thin; indeed to such an extent that their unpopularity with the public has been dubbed the Annuity Puzzle. Inkmann et al. (Reference Inkmann, Lopes and Michaelides2011), for instance, show that in the UK <6% of households participate in the annuity market. Similar results hold for other countries, indicating that substantial amounts of welfare are being left on the table.Footnote 1
As households remain reluctant to annuitize their assets, the stimulation of annuity markets currently ranks high on policy makers' agendas because it seems to promise substantial welfare gains; especially in countries affected by an ageing population. Indeed, the OECD recently released a report (OECD, 2012) which argues that a road map for retirement income adequacy must be aimed at ‘fostering annuity markets […]’ and ‘improving protection against longevity risk by establishing a minimum level of annuitization […]’.
Taking the policy debate as a starting point, the aim of the current paper is to analyse the individual welfare consequences of stimulating annuity markets. In contrast to much of the extant literature, our objective is not to explain the nature of the Annuity Puzzle but to understand how general-equilibrium repercussions affect the individual welfare benefits of annuities.Footnote 2 In particular, a general-equilibrium analysis of annuity markets has to take into account that in the absence of annuities there would have been a transfer of assets (unintended bequests) from individuals who die to individuals who survive. Moreover, any change in savings behaviour induced by the higher return received on savings will have an impact on factor prices. Taking these factors into account, Pecchenino and Pollard (Reference Pecchenino and Pollard1997), Fehr and Habermann (Reference Fehr and Habermann2008, Reference Fehr and Habermann2010), Feigenbaum et al. (Reference Feigenbaum, Gahramanov and Tang2013) and Heijdra et al. (Reference Heijdra, Mierau and Reijnders2014) have shown that the magnitude of the general-equilibrium repercussions is potentially large enough to nullify and even reverse the beneficial welfare effects of annuities.
We build on these contributions by studying the impact, transitional and long-run effects of opening up an annuity market in a general-equilibrium overlapping-generations model. To this end, we use the imperfect-annuity-market models of Bütler (Reference Bütler2001), Hansen and İmrohoroğlu (Reference Hansen and İmrohoroğlu2008) and Heijdra and Mierau (Reference Heijdra and Mierau2012), but extend them to allow for endogenous human-capital accumulation along the lines of Ludwig et al. (Reference Ludwig, Schelkle and Vogel2012) and Heijdra and Reijnders (Reference Heijdra and Reijnders2012). Incorporating the human capital channel into the analysis is important for several reasons. First, it gives rise to an endogenous profile of labour productivity and wages over an agent's life cycle. Second, as we demonstrate in the paper, the human capital mechanism plays a non-trivial role for the magnitude of the general-equilibrium response to stimulating annuity markets. Third, it allows us to realistically consider how the optimal degree of annuitization is affected by demographic change.
We study the static as well as the dynamic properties of our model. This allows us to investigate how the impact of opening up an annuity market on individual welfare depends on an individual's age when the policy was enacted. Furthermore, using the dynamic model we also investigate how the impact of the annuity policy is affected by whether or not the demographic structure is at rest or in transition. This is important because the dynamics of the demographic structure imply that all economic policies are necessarily enacted outside of the economic and demographic steady states. Therefore, it is necessary to consider whether conclusions drawn in the demographic steady state also hold outside of it.
The main findings from our analysis are that the beneficial partial-equilibrium effects of stimulating the annuity market are counteracted by negative general-equilibrium repercussions. In particular, for low levels of annuitization the positive partial-equilibrium effect dominates but above a certain threshold the negative general-equilibrium effects play the major role. Balancing the positive partial-equilibrium and negative general-equilibrium forces we show that there generally exists some intermediate level of annuitization for which long-run individual welfare – our concept of optimality – is maximized. A general-equilibrium decomposition then highlights that the most important driver of these repercussions is the loss of the intergenerational transfers. In studying the transition to the optimal level of annuitization, we show that currently middle-aged individuals gain most from the annuity markets. Moreover, we establish that ignoring endogenous human-capital accumulation substantially overstates the negative general-equilibrium effects of stimulating annuity markets.
From a policy perspective our analysis highlights that while stimulating annuity markets somewhat is sound economic policy, one should caution not to overdo it. However, in light of the currently observed low levels of annuitization, some stimulation of this markets as suggest by the OECD is bound to be beneficial for current and future generations. For politicians seeking (re-) election stimulating annuity markets may be particularly tempting as the currently alive generations (and, therefore, voters) gain most from the policy.
In contrast to the highly stylized two-periods used in Pecchenino and Pollard (Reference Pecchenino and Pollard1997), Fehr and Habermann (Reference Fehr and Habermann2008) and Heijdra et al. (Reference Heijdra, Mierau and Reijnders2014) we focus on a many-period life-cycle model, which allows us to study how individuals at different stages of their life cycle are affected by the introduction of annuities. Feigenbaum et al. (Reference Feigenbaum, Gahramanov and Tang2013) consider a similar model but focus solely on the steady-state impact of annuities and, generally, take a more behavioural perspective. The paper most closely associated with ours is that of Fehr and Habermann (Reference Fehr and Habermann2010) who, however, focus on a policy of mandatory annuitization (as opposed to voluntary in our analysis) and do not consider how the positive partial-equilibrium and negative general-equilibrium can be balanced so as to create an annuity market of optimal size. Our model also highlights the importance of endogenous human-capital accumulation when studying the impact of annuities and while Fehr and Habermann's model relies on a demography that is permanently in its long-run equilibrium we also consider a non-stationary demographic structure.Footnote 3
Our paper also contributes to the debate on the optimal policy response to the absence of annuity markets. İmrohoroğlu et al. (Reference İmrohoroğlu, İmrohoroğlu and Joines1995), for instance, show that in the absence of annuity markets, a small social security system can provide welfare gains even if it crowds out capital because it supplies (partial) insurance against longevity risk. Recently, this view has been challenged by Caliendo et al. (Reference Caliendo, Guob and Hosseini2014) who show that because social security reduces accidental bequests, even a small social security system may not be beneficial if annuity markets are missing. Our paper adds to this debate by showing that welfare need not increase even if it were possible to directly remedy the absence of the annuity market.
The remainder of this paper is structured as follows. The next section introduces the model and discusses its parameterization. Section 3 provides the core of the paper and provides some robustness analysis. Section 4 goes on to study how the model findings are affected by the assumption of a stationary demography. The final section concludes and provides some thoughts on future research.
2 A primer on the ‘Tragedy of Annuitization’
In a recent paper, Heijdra et al. (Reference Heijdra, Mierau and Reijnders2014) employ a simple two-period Diamond-Samuelson overlapping generations model to demonstrate the paradoxical long-run welfare effects of introducing perfect annuity markets in a closed economy with non-altruistic individuals. The main result is what they call ‘The Tragedy of Annuitization’. Full annuitization of assets is privately optimal, but it typically is not socially beneficial due to: (a) loss of accidental bequests, and (b) adverse general equilibrium repercussions. Since the present paper in essence establishes the tragedy in the context of a much more complicated multi-period computable general equilibrium (CGE) model, it pays to briefly review the phenomenon in a two-period setting.
Individuals live for either one or two periods, are non-altruistic, and possess a lifetime utility function of the additive form:
 $$\Lambda _t \equiv \ln C_t^y + \displaystyle{{1 - \mu} \over {1 + \rho}} \ln C_{t + 1}^o,$$
where
 $C_t^y $
is youth consumption,
 $C_{t + 1}^o $
is old-age consumption, ρ is the pure rate of time preference, and μ is the survival probability. In the absence of annuities, the budget constraints for youth and old age are given by:
 $$C_t^y + S_t = w_t + Z_t^y, \quad C_{t + 1}^o = (1 + r_{t + 1} )S_t, $$
where w
t
is the wage rate, r
t
is the interest rate, S
t
denotes the level of savings, and
 $Z_t^y $
are transfers received from the government during youth. Since the agent faces mortality risk, he/she cannot hold negative savings (i.e., S
t
⩾ 0). This is because such loans would be unaccounted for in case of premature death. Combining the two budget constraints gives the consolidated lifetime budget constraint:
 $$C_t^y + \displaystyle{{C_{t + 1}^o} \over {1 + r_{t + 1}}} = w_t + Z_t^y. $$
In each period, a fraction of the population dies and their assets are collected by the government and reimbursed to the young in the form of transfers. This is the first mechanism behind the tragedy of annuitization: the death of individuals leads to a redistribution from old to young individuals, which – as is well known – leads an initially dynamically inefficient economy to move towards the Golden Rule steady state.
The individual chooses
 $C_t^y $
and
 $C_{t + 1}^o $
in order to maximize lifetime utility (1) subject to the budget constraint (3), taking as given the (rationally expected) macroeconomically determined factor prices (w
t
and r
t+1) and transfers (
 $Z_t^y $
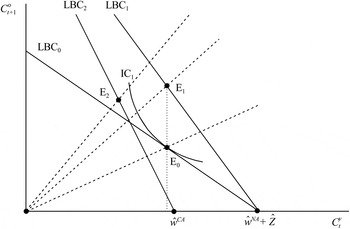
). This choice problem has been illustrated in Figure 1. In that figure, we assume that the economy is in a steady-state equilibrium featuring a wage rate
 $\hat w^{NA} $
, transfers equal to
 $\hat Z^y $
, and an interest rate equal to
 $\hat r^{NA} $
.Footnote
4
The initial budget constraint is given by LBC1 and features the slope equal to
 $ - (1 + \hat r^{NA} $
). The private optimum is at point E
0 where the indifference curve IC0 is tangent to LBC0. The slope of IC0 is equal to
 $ - (1 + \rho )C_{t + 1}^o /[(1 - \mu )C_t^y ];$
so in the uninsured equilibrium we find that the optimal consumption profile is characterized by the following Euler equation:
 $$\displaystyle{{C_{t + 1}^o} \over {C_t^y}} = \displaystyle{{(1 - \mu )(1 + \hat r^{NA} )} \over {1 + \rho}}. $$
The short- and long-run effects of annuitization.

This is the dashed ray from the origin passing though point E 0.
Now consider what happens if perfect annuity market is opened up. In such a market, the actuarially fair annuity rate is related to the regular interest rate according to
 $1 + r_{t + 1}^A = (1 + r_{t + 1} )/(1 - \mu )$
from which it follows that
 $r_{t + 1}^A \gt r_{t + 1} $
. It is privately optimal to fully annuitize assets in which case the lifetime budget constraint (3) is replaced by:
 $$C_t^y + \displaystyle{{C_{t + 1}^o} \over {1 + r_{t + 1}^A}} = w_t + Z_t^y. $$
In terms of Figure 1 nothing happens to the income endowment point of the shock-time young but the lifetime budget constraint rotates in a counter-clockwise fashion from LBC0 to LBC1. Since for the logarithmic felicity function the savings function is independent from the yield on assets, the new optimum for the shock-time young is at point E
1, which lies directly above point E
0. This is the traditional and often repeated utility-enhancing effect of annuitization: it expands the choice set of individuals facing longevity risk. Note that, since the shock-time young do not change their saving plans, the regular interest rate still features
 $r_{t + 1} = \hat r^{NA} $
so at point E
1 the slope of the lifetime budget equation is
 $ - (1 + \hat r^{NA} )/(1 - \mu )$
. Combined with the slope of the indifference curve,
 $ - (1 + \rho )C_{t + 1}^o /[(1 - \mu )C_t^y ]$
, we thus find that the optimal consumption profile with perfect annuities is characterized by the following Euler equation:
 $$\displaystyle{{C_{t + 1}^o} \over {C_t^y}} = \displaystyle{{1 + \hat r^{NA}} \over {1 + \rho}}. $$
The mortality rate no longer affects the intertemporal consumption decision because the agent is fully insured against the adverse effects of longevity risk. Note that (6) is represented by the dashed line from the origin passing though point E 1.
But from the next period onward the salubrious effects of annuitization start to unravel. Indeed, the generation born one period after the shock will no longer get transfers from the government as there are no unintended bequests any longer when people fully annuitize their assets. In terms of Figure 1 this leads to an inward shift of the lifetime budget constraint for such agents, i.e., to a reduction in the choice set. But this is not all that happens. Because the young receive no transfers they will save less. The macroeconomic capital intensity will fall, causing a reduction in the wage rate and an increase in the regular interest rate. This process converges in the long run and the optimal consumption point for a newborn in the new steady state (featuring
 $\hat w^{CA} $
and
 $\hat r^{CA} $
) is given by point E
2 in Figure 1. This is the tragedy in graphical terms: welfare is higher in point E
1 than in point E
2! The shock-time young gain ‘at the expense’ of the future young.
Of course the two-period model employed here is far too stylized to be confronted directly with the data. For that reason we must put a number of real-life features back into the model. In the remainder of this paper, we enrich the model in the following directions:
-
• Individual potentially live for 83 rather than two periods, i.e., the time grid is much finer with each period representing a year rather than a number of decades;
-
• Mortality is age-dependent as the demographic data strongly suggest;
-
• Annuity markets may not be actuarially fair and accidental bequests will not accrue to one age cohort only;
-
• Labour supply and the retirement decision are endogenous;
-
• Individuals accumulate human capital as they learn on the job and become more productive.
In such a setting, analytical results are no longer obtainable so from here on the paper proceeds on the basis of numerical simulations.
3 Model
We consider a closed economy populated by overlapping generations of finitely-lived individuals. They accumulate human capital over their life cycle, must decide when to retire, how much to consume and how much to save for retirement. The production sector consists of a representative firm, which produces output by using physical and human capital as inputs. The purpose of the government is to absorb and redistribute accidental bequests left by individuals due to the existence of an incomplete annuity market.
Our starting points are the models of Bütler (Reference Bütler2001), Hansen and İmrohoroğlu (Reference Hansen and İmrohoroğlu2008) and Heijdra and Mierau (Reference Heijdra and Mierau2012) in which individuals face an incomplete annuity market, in the sense that only a share of total assets can be annuitized. In contrast to these earlier models, we take into account that individuals accumulate human capital as a by-product of their labour supply. Most importantly, while earlier work has typically focused on the steady-state impact of annuity market imperfections, our model allows us to trace out the full transition path resulting from any changes in the exogenous variables and structural parameters of the model.
3.1 Production
We assume that a representative firm produces output, Y t , according to a Cobb–Douglas production function:
 $$Y_t = \Omega K_{t - 1}^{\varepsilon _k} N_t^{1 - \varepsilon _k}, \quad 0 \lt \varepsilon _k \lt 1,$$
where K t−1 is the aggregate physical capital stock in use at the start of period t, N t is the labour input measured in terms of efficiency units, Ω is the constant and exogenous level of factor productivity, and ε k is the capital share of output. The firm hires factors of production on the competitive market for inputs according to the following marginal productivity conditions:
 $$r_t + \delta ^k = \varepsilon _k \Omega \left( {\displaystyle{{n_t} \over {k_{t - 1}}}} \right)^{1 - \varepsilon _k}, \quad w_t = (1 - \varepsilon _k )\Omega \left( {\displaystyle{{n_t} \over {k_{t - 1}}}} \right)^{ - \varepsilon _k}. $$
where N t and K t−1 are aggregate per-capita values of N t and K t−1 (see below), r t is the interest rate, w t is the wage rate, and δ k is the depreciation rate of physical capital (0 < δ k < 1).
3.2 Demography
We consider a stable demographic structure with a constant population growth rate equal to π.Footnote 5 The total population at any time t is equal to P t , so that the law of motion of the aggregate population is given by:
 $$P_{t + 1} = (1 + \pi )P_t. $$
The initial size of a cohort born at time v is equal to P v,v and at time t (⩾v) P v,t members of this cohort are still alive. The size of the newborn cohort is determined by the births of the currently alive generations. The age-specific birth rate equals β i , where i = t − v.Footnote 6 In line with human fertility β i is zero up to a certain age, increases up to roughly age 30 and then fades out to become zero again at mid-40. The size of the newborn cohort at time t equals:
 $$P_{t,t} = \sum\limits_{i = 0}^{D - 1} {\beta _{i + 1} P_{t - i,t},} $$
where D is the maximum attainable age. The age-specific mortality rate is denoted by μ i and we assume it to be convexly increasing over the life cycle. Hence, the law of motion of an individual cohort is given by:
 $$P_{v,t + 1} = (1 - \mu _{t - v + 1} )P_{v,t}, \quad {\rm for}\quad t \in (v,v + D - 1),$$
where P v,v+D+1 = 0. To assure a stable demographic structure, we exogenously set the values of β i and μ i and let π adjust to keep the system in its demographic steady state (Lotka, Reference Lotka1998). The relative size of each cohort is given by:
 $$p_{t - v} = \displaystyle{{P_{v,t}} \over {P_t}}, $$
where we note that p t−v depends only on age (and not on time) due to the stability of the demographic structure.
3.3 Households
At time t, expected remaining-lifetime utility of an individual born at time v ( ⩽ t) is given by:
 $${{\open E}}\Lambda _{v,t} \equiv \sum\limits_{\tau = t}^{v + D - 1} U\left( {C_{v,\tau }^{\varepsilon _c} {\left[ {1 - L_{v,\tau }} \right]}^{1 - \varepsilon _c}} \right)(1 + \rho )^{ - (\tau - t)}{^{\tau - v}}_ {s = t - v} (1 - \mu _s),$$
where C
v,τ
is consumption, L
v,τ
is labour supply of working individuals (the time endowment equals unity), ρ is the pure rate of time preference (ρ > 0), ε
c
is the consumption preference parameter, and
 $\prod\nolimits_{s = t - v}^{\tau - v} {(1 - \mu _s )} $
is the conditional probability at time t (model age t − v) that the individual will still be alive at some later time τ (model age τ − v). The felicity function, U(x), is iso-elastic:
 $$U(x) = \left\{ {\matrix{ {\displaystyle{{x^{1 - 1/\sigma} - 1} \over {1 - 1/\sigma}}} \hfill & {{\rm for}\;\sigma \ne 1,} \hfill \cr {\ln x} \hfill & {{\rm for}\;\sigma = 1,} \hfill \cr}} \right.$$
where σ is the (constant) intertemporal substitution elasticity (σ > 0). Labour supply is chosen freely – as jobs are perfectly divisible – but it must be non-negative, i.e.:
 $$L_{v,\tau} \ges 0.$$
During the life cycle an individual may choose not to work at all for some time periods. Since we abstract from a social security system altogether, a person's retirement age, R v,t , can only be determined ex post, i.e., it is the highest age at which the individual reduced labour supply to zero.
The individual's stock of financial assets accumulates according to the following expression:
 $$A_{v,t} = (1 + r_{v,t}^A )A_{v,t - 1} - C_{v,t} + w_t L_{v,t} H_{v,t - 1} + TR_{v,t}, $$
where A
v,t−1 and H
v,t−1 are the stocks of, respectively, financial assets and human capital available at the start of period t,
 $r_{v,t}^A $
is the (potentially age-dependent) interest rate, and TR
v,t
are lump-sum government transfers.
Following Imai and Keane (Reference Imai and Keane2004), Kim and Lee (Reference Kim and Lee2007), Ludwig et al. (Reference Ludwig, Schelkle and Vogel2012) and Heijdra and Reijnders (Reference Heijdra and Reijnders2012) we assume that individuals accumulate human capital according to a Ben-Porath (Reference Ben-Porath1967) style learning-by-doing (LBD) specification:Footnote 7
 $$H_{v,t} = \gamma _{t - v} L_{v,t} H_{v,t - 1}^\eta + (1 - \delta _{t - v}^h )H_{v,t - 1}, $$
where γ
t−v
is the age-specific level of productivity in the learning process, η governs the returns to current holdings of human capital, and
 $\delta _{t - v}^h $
is the age-specific depreciation rate of human capital. Heijdra and Reijnders (Reference Heijdra and Reijnders2012) introduce an age-dependent human capital depreciation rate and argue that it captures economic (as opposed to biological) ageing. We assume that all individuals are endowed with the same level of initial human capital at birth.
Following Yaari (Reference Yaari1965) we postulate the existence of annuity markets, but in line with Davidoff et al. (Reference Davidoff, Brown and Diamond2005) we allow for the annuity market to be incomplete, in the sense that (a) asset holdings must be non-negative at all times,
 $$A_{v,t} \ges 0,$$
and (b) only a share θ of total assets can be annuitized (0 ⩽ θ ⩽ 1). Annuities are life-insured financial products that pay out conditional on the survival of the individual. In contrast to regular financial products, annuities pay a premium that compensates the individual for the fact that unused assets flow to the life-insurance firm upon death. From the analysis of Yaari and Davidoff et al. we know that – in the presence of lifetime uncertainty and in the absence of a bequest motive – individuals will hold savings as much as possible in the form of annuities.Footnote 8 The average rate of interest on total asset holdings faced by the individual is given by:
 $$1 + r_{v,t}^A = (1 + r_t )\displaystyle{{1 - (1 - \theta )\mu _{t - v}} \over {1 - \mu _{t - v}}}, $$
where r
t
is the real interest rate from (8) and θ is a parameter indicating the degree of incompleteness of the annuity market. Following Hansen and İmrohoroğlu (Reference Hansen and İmrohoroğlu2008) we interpret θ as the share of assets that can be annuitized.Footnote
9
Thus, of the total asset holdings A
v,t
a share θ is held in the form of actuarially fair annuities (yielding a return of (1 + r
t
)/(1 − μ
t−v
)) and a share 1 − θ is held in the form of regular assets (yielding a return of 1 + r
t
). In the remainder of this paper we shall refer to
 $r_{v,t}^A $
as the annuity rate of interest.
The specification of the interest rate in equation (19) allows for a very general treatment of different degrees of annuity market incompleteness:
-
• No annuitization (NA). For the case of θ = 0, individuals have no access to annuity markets, they can save at interest r t but upon dying all their savings are left as accidental bequests and are distributed over all surviving agents. Hence, TR v,t > 0.
-
• Incomplete annuitization (IA). If not all assets can be annuitized θ ∈ (0, 1), individuals leave accidental bequests, which are taxed away by the government and distributed over all surviving individuals. As before, TR v,t > 0.
-
• Complete annuitization (CA). The case of full annuitization is obtained if θ = 1, in which case there are no accidental bequests and TR v,t = 0.
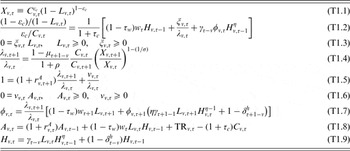
At time t an agent of vintage v holds initial stocks of financial assets A v,t−1 and human capital H v,t−1 and chooses paths for consumption C v,τ and labour supply L v,τ (for τ = t, t + 1, …, v + D − 1) in order to maximize (remaining-) lifetime utility (13) subject to the accumulation identities (16)–(17) and the inequality constraints (15) and (18). For convenience, the main first-order conditions for the household's optimization problem are gathered in Table 1. Equation (T1.1) defines the Cobb–Douglas subfelicity function, which incorporates a unitary intratemporal substitution elasticity between consumption and leisure. Equations (T1.2)–(T1.3) characterize the consumption–leisure choice at any moment in time. Note that ξ v,t – the Lagrange multiplier for the non-negativity constraint on labour supply – acts as an implicit tax on leisure. Two cases must be considered. First, in the interior case, labour supply is strictly positive (L v,t > 0) and it follows from (T1.3) that the implicit leisure tax is zero (ξ v,t = 0). In the planning period t, the labour supply decision is thus determined by the following trade-off:
 $$\displaystyle{{(1 - \varepsilon _c )/(1 - L_{v,t} )} \over {\varepsilon _c /C_{v,t}}} = \displaystyle{{(1 - \tau _w )w_t H_{v,t - 1} + \gamma _{t - v} \varphi _{v,t} H_{v,t - 1}^\eta} \over {1 + \tau _c}}. $$
Household plans

Notes: The initial conditions of a vintage v household at time t are represented by A v,t−1 and H v,t−1. There are two terminal conditions. First, λ v,v+D−1 = ν v,v+D−1 > 0, so that A v,v+D−1 = 0. Second, L v,v+D−1 = 0, so that φ v,v+D−1 = 0.
During the employment phase, the marginal rate of substitution (MRS) between leisure and consumption (left-hand side of (20)) is equated to the opportunity cost of time (right-hand side of (20)). The latter consists of the after-tax wage (the backward-looking term involving w
t
H
v,t−1) plus the imputed value of experience accumulation as a result of LBD (the forward-looking term involving
 $\gamma _{t - v} \varphi _{v,t} H_{v,t - 1}^\eta , $
where φ
v,t
is the shadow value of human capital – an asset price).
In the second case, if the household finds it optimal not to work at all (L v,t = 0) then this must be so because the implicit leisure tax is strictly positive (ξ v,t > 0) and high enough to equate optimal leisure consumption to the time endowment. The first-order condition for leisure in a non-working period reduces to:
 $$\displaystyle{{\xi _{v,t}} \over {\lambda _{v,t}}} = \displaystyle{{1 - \varepsilon _c} \over {\varepsilon _c}} (1 + \tau _c )C_{v,t} - (1 - \tau _w )w_t H_{v,t - 1} - \gamma _{t - v} \varphi _{v,t} H_{v,t - 1}^\eta, $$
where λ v,t is given by:
 $$\lambda _{v,t} = \varepsilon _c \displaystyle{{1 - \mu _{t - v}} \over {1 + \tau _c}} C_{v,t}^{ - 1 + \varepsilon _c (1 - 1/\sigma )}. $$
Ceteris paribus consumption, provided human capital declines substantially during the latter part of life there will be a period of retirement.
Equation (T1.4) in Table 1 characterizes the optimal time profile of consumption. With non-separable preferences (σ ≠ 1) consumption growth depends not only on the intertemporal discount factor, death probability, and degree of impatience (λ v,t+1/λ v,t , μ t+1−v , and ρ), but also on the leisure choice. Equations (T1.5)–(T1.6) and (T1.8) jointly determine the optimal path of financial assets, the intertemporal discount factor, and the Lagrange multiplier for the non-negativity constraint on financial assets, ν v,τ . Again two cases must be considered. First, if the borrowing constraint is non-binding in planning period t (A v,t > 0) then it follows from (T1.6) that ν v,t = 0 and from (T1.5) that the intertemporal discount factor is fully determined by the annuity rate of interest available to the agent:
 $$\displaystyle{{\lambda _{v,t + 1}} \over {\lambda _{v,t}}} = \displaystyle{1 \over {1 + r_{v,t + 1}^A}}. $$
In contrast, in the second case, if the household would like to borrow but is precluded from doing so by the constraint (18), then ν v,t is strictly positive, financial assets are of necessity equal to zero (A v,t = 0), and the intertemporal discount factor is given by:
 $$\displaystyle{{\lambda _{v,t + 1}} \over {\lambda _{v,t}}} = \displaystyle{{1 - \nu _{v,t} /\lambda _{v,t}} \over {1 + r_{v,t + 1}^A}}. $$
Written is this fashion it is clear that ν v,t /λ v,t can be seen as an implicit subsidy on financial asset accumulation. Of course, at the end of life, the borrowing constraint is inevitably binding, λ v,v+D−1 = ν v,v+D−1 > 0 and A v,v+D−1 = 0 – the rational non-altruistic agent who is lucky enough to reach the maximum attainable age does not leave any financial assets behind.
The expressions in (23) and (24) thus show that the intertemporal discount factor is affected by both features of the annuity market imperfection, namely the existence of a borrowing constraint (resulting in an implicit subsidy on saving during part of the life cycle) and the fact that the annuitization share θ may fall short of unity (ensuring that the overall annuity rate is less than actuarially fair).
Finally, equations (T1.7) and (T1.9) jointly determine the optimal path of human capital H v,τ and its shadow value φ v,τ . Several things are worth noting. First, since the optimal path of φ v,τ is affected by the path of the dynamic discount factor, the borrowing constraint on financial assets critically affects decision making regarding human capital accumulation. Second, since the agent is unable to supply labour and gain experience after death (L v,v+D = 0) it follows from (T1.7) that φ v,v+D−1 = 0 constitutes a terminal condition of the shadow value of human capital. Third, even though the shadow value of human capital goes to zero at the end of life, the stock itself typically does not. Hence, an inevitable feature of the human capital stock is the fact that it dies with its owner, i.e., it is embodied in the person who accumulates it.
Although quite complicated life-cycle patterns are in principle possible in our model, we demonstrate below that in a full (economic and demographic) steady state and for our adopted parameterization, individuals move through four distinct life-cycle regimes:
-
Regime 1: For 0 ⩽ t − v <F b the asset constraint is binding (ν v,t > 0, A v,t = 0) and labour supply is positive (L v,t > 0, ξ v,t = 0).
-
Regime 2: For F b ⩽ t − v <R the asset constraint is not binding (A v,t > 0, ν v,t = 0) and labour supply positive.
-
Regime 3: For R ⩽ t − v <F e the asset constraint is not binding and labour supply is zero (ξ v,t > 0, L v,t = 0).
-
Regime 4: For F e ⩽ t − v ⩽ D the asset constraint is binding and labour supply is zero.
We discuss these regimes in more detail below once we have also introduced the equilibrium conditions and the parameterization underlying our simulations.
3.4 Government
If access to annuities is limited or non-existent (i.e., 0 ⩽ θ <1), we have to take into account that individuals leave accidental bequests. We assume that the government taxes away these accidental bequests and distributes the proceeds among the surviving agents in the form of a lump-sum transfer. The government has no recourse to government debt, so that the balanced-budget constraint becomes:
 $$\sum\limits_{v = t - D + 1}^t {\,p_{t - v} TR_{v,t} =} (1 - \theta )(1 + r_t )\sum\limits_{v = t - D + 1}^t {\,p_{t - v} \displaystyle{{\mu _{t - v}} \over {1 - \mu _{t - v}}} A_{v,t - 1}} $$
we leave the structure of TR v,t very general so as to accommodate many possible redistribution regimes.
3.5 Equilibrium
At time t, the equilibrium consists of the set of individual choice variables, C v,t , L v,t , A v,t , and H v,t for v ∈ [t − D + 1, t], factor demands K t−1 and N t , factor prices w t and r t , and lump-sum transfers TR v,t , such that:
-
1. Factor demands for K t−1 and N t and factor prices w t and r t are consistent with the first-order conditions in (8).
-
2. The individual choice variables solve the household optimization program.
-
3. Aggregate per-capita assets (a t ), consumption (c t ), and quality-adjusted labour supply (l t ) equal the weighted sum of individual assets, consumption, and labour-supply weighted human capital, where the weights are given by the relative sizes of the cohorts:
(26) $$\matrix{ {a_{t - 1} = \sum\limits_{v = t - D + 1}^t {\,p_{t - v} A_{v,t - 1},}} & {c_t = \sum\limits_{v = t - D + 1}^t {\,p_{t - v} C_{v,t},}} & {l_t = \!\!\!\sum\limits_{v = t - R + 1}^t {\,p_{t - v} L_{v,t} H_{v,t - 1}.}} \cr} $$
-
4. Aggregate per-capita assets are equal to the aggregate per-capita capital stock: a t−1 = k t−1.
-
5. Aggregate per-capita labour demand equals aggregate per-capita labour supply: n t = l t .
-
6. The transfer scheme TR v,t satisfies the budget constraint (25).

In order to study the steady-state properties and transitional dynamics of our model we rely on the numerical routines developed in Adjemian et al. (Reference Adjemian, Bastani, Juillard, Mihoubi, Perendia, Ratto and Villemot2011). To that end, we must first assign values to the structural parameters of the model.
3.6 Parameterization
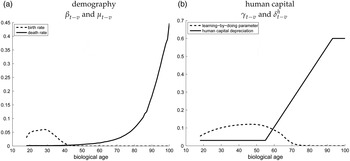
Individuals reach economic maturity at biological age 18 and their maximum attainable age (D) is 101. The instantaneous probability of death at any age is derived from the United States cohort born in 2006 using the Human Mortality Database.Footnote 10 From the Human Fertility DatabaseFootnote 11 we use data on the age-specific fertility rate for that same cohort. We depict the age-specific steady-state profiles of fertility, β t−v , and mortality, μ t−v , in the left-hand panel of Figure 2. Using these values for the fertility and mortality rates we can then establish that for the demographic structure to be stationary the population growth rate has to be equal to π = 1.031 · 10−3, i.e., a little over 0.1% per annum.
Age-dependent parameters.

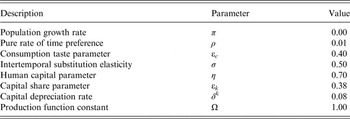
The remaining parameters of the utility function are set such that, in the benchmark steady state, individuals retire at biological age 66 and the interest rate on unannuitized assets equals 3.6% per annum. To this end, we let ρ = 0.01 and ε c = 0.40. This leaves the elasticity of intertemporal substitution (σ) as a free parameter and we set it equal to 0.5, which is in line with most empirical estimates. Given the central role played by σ in determining the savings response to changes in the interest rate, we provide a sensitivity analysis for the values of this parameter in the discussion below.
The parameters of human-capital accumulation function (17) are chosen as follows. Following the empirical study of Hansen (Reference Hansen1993), we allow the level of human capital to be hump shaped over the life cycle with its peak at biological age 58. To replicate this structure we adopt the following parametrization. First, we assume that there exist decreasing returns to the stock of human capital in the LBD mechanism and set η = 0.70. Second, we postulate that the LBD coefficient (γ
t−v
) follows a hump-shaped structure over the life cycle. Third, we assume that the rate of human-capital depreciation is constant (at
 $\delta _{t - v}^h = 0.03$
) for individuals younger than 56, whilst for older individuals
 $\delta _{t - v}^h $
is li
 $1.5\% $
nearly increasing at an annual rate of 1.5%. The profiles of γ
t−v
and
 $\delta _{t - v}^h $
are illustrated in the right-hand panel of Figure 2.
We set the capital share of output (ε k ) equal to 0.38 as suggested by Trabandt and Uhlig (Reference Trabandt and Uhlig2011). The depreciation rate of physical capital (δ k ) equals 0.08 and we normalize the aggregate level of productivity (Ω) to unity. Finally, for the benchmark steady state, there are no annuities (θ = 0) and we assume that the government distributes the proceeds from the accidental bequests equally over all cohorts, i.e., TR v,t = TR t . All age-invariant parameters are summarized in Table 2 and the profiles of the age-specific parameters are given in Figure 2.
Parameter values

3.7 Benchmark steady state
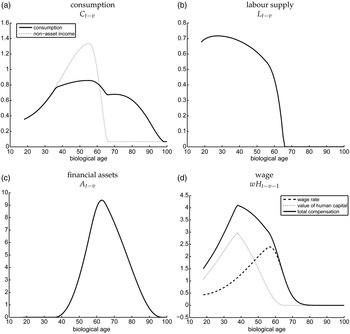
In the steady state, factor prices are constant (r t = r and w t = w) whilst the other variables depend only on the individual's age (C v,t = C t−v , L v,t = L t−v , A v,t = A t−v , and H v,t = H t−v ). In Figure 3, we display the initial steady-state profiles of consumption (panel a), labour supply (b), assets (c), and the individual wage (d). In the various profiles we can clearly see how the individual moves through the four life-cycle stages outlined above. Initially, the individual would like to borrow against future labour income but is prevented from doing so. Hence, assets are zero and the individual consumes all income (i.e., wages and government transfers). This is indicated in panel (a) where the dotted line maps out total non-asset income. At age F b the individual's labour income becomes sufficiently high to create an incentive to save so that financial assets slowly start to increase and consumption falls short of total non-asset income. In the run-up to retirement, individuals quickly start reducing labour supply with a sharp drop occurring just before R. Consumption experiences a kink at R because consumption and leisure are non-separable. After retirement, the individual gradually runs down assets and depletes them altogether at age F e after which consumption is exactly equal to the transfers received from the government.
Benchmark steady-state profiles.

Panel (d) of Figure 3 exhibits the impact of the human-capital accumulation function. The dashed line indicates the wage that individuals are receiving and the dotted line indicates the additional earning power gained by the fact that current labour supply leads to higher productivity. The total return to the hours worked is given by the sum of these two items and is indicated by the solid line. The figure shows that when supplying labour, the young benefit especially from a higher productivity later in life and older workers benefit most from the wage that they receive.
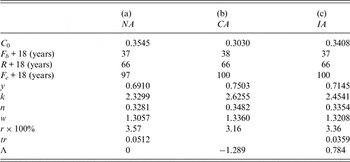
In column (a) of Table 3, we summarize the steady-state microeconomic and macroeconomic properties of the model. There we find that individuals face a borrowing constraint until age 37 after which they start accumulating financial assets for retirement. In line with the calibration, individuals retire at age 66. After that, they gradually run down their assets and at age 97 the asset constraint becomes binding again for those lucky enough to survive. From the macroeconomic part of the model we may note that the relative amount of assets redistributed in the economy is about 2.2% of the total amount of capital.
Stimulating annuity markets

Notes: The cases are: (a) No annuitization NA, θ = 0; (b) Complete annuitization CA, θ = 1; (c) Incomplete annuitization IA, θ = θ* = 0.39.
The final entry in the first column contains the loss or gain in utility compared with the case of no annuitization measured in consumption equivalents. In particular, we calculate the value of equation (13), which indicates the value of lifetime utility of a steady-state (newborn) individual, for the benchmark steady state and for the new steady state. We then calculate the percentage change in consumption (holding everything else constant) that would yield the same utility at the new steady state as in the benchmark steady state. For example, a
 $ + 1\% $
welfare change indicates that an individual at the new steady state would enjoy the same utility as at the benchmark steady state if consumption at the benchmark steady state would have been 1% lower every year. Hence, a positive value indicates an increase in welfare due to a change in the availability of annuities, while a negative value indicates a loss in welfare.
4 Stimulating annuity markets
Starting from the benchmark scenario in which there are no annuities we use this section to analyse the impact of a government policy aimed at stimulating the availability of annuities. The policy itself bears no costs and we let the government experiment with different degrees of annuity-market incompleteness. After establishing the steady-state impact of the new policy, we turn to an analysis of its transitional effects.
4.1 Steady-state impact
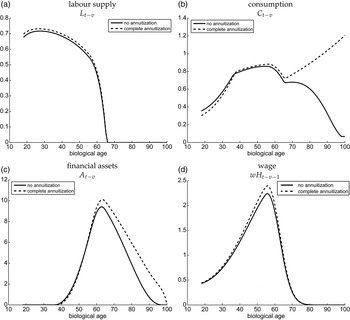
In Figure 4, we visualize the steady-state impact of a government policy aimed at assuring that everybody can completely annuitize all their assets. The solid line indicates the benchmark profiles and the dashed line indicates the profiles in which complete annuitization is possible. In panel (a), we can see that this policy has hardly any effect on either the intensive or extensive margin of labour supply. In panel (b), however, we observe that the policy has a very strong impact on the shape of the life-cycle consumption profile. Indeed, while consumption exhibits a hump-shaped profile in the absence of annuities, in the presence of annuities it is upward sloping after retirement. As can be seen in panel (c), assets still follow a hump-shaped profile but individuals no longer run out of assets at the end of their life. In panel (d), we study the impact of the annuity policy on the earning profile of individuals. The positive impact on labour supply documented in the upper right panel translates to a higher wage later in life due to the endogenous human-capital accumulation decision made by the individuals.
Complete annuitization.

In column (b) of Table 3 we see that the increase in asset accumulation displayed in panel (c) of Figure 4 leads to an increase in aggregate capital accumulation of nearly 13% (Δk/k = 0.127). Since the stock of employed human capital rises by a little over 6% (Δn/n = 0.061), physical capital becomes relatively abundant, which leads to a drop in the interest rate and an increase in the wage rate. Naturally, the policy of complete annuitization eliminates all transfers from accidental bequests and, therefore, tr = 0.
The most interesting consequence of the policy to stimulate annuity markets is confined to the last item in column (b). There we see that welfare of a steady-state (newborn) individual is lower in the presence of annuities. Hence, in stark contrast to the analyses of Yaari (Reference Yaari1965) and Davidoff et al. (Reference Davidoff, Brown and Diamond2005) we find that annuities actually decrease individual welfare when we take into account general equilibrium repercussions of a policy aimed at stimulating annuity markets.
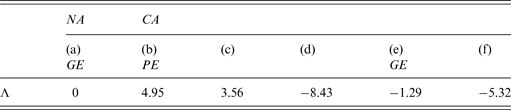
To appreciate this result, consider Table 4 in which we decompose the change in welfare into its different components as suggested by Heijdra and Mierau (Reference Heijdra and Mierau2012, p. 887). In column (a), we reiterate the welfare effect of an individuum in the initial equilibrium in which there are no annuities. In column (b), we then consider the welfare change that would arise if stimulating the annuity market would not have had any general-equilibrium consequences. In that case, there is a clear welfare gain, as predicted by the partial equilibrium analyses of Yaari (Reference Yaari1965) and Davidoff et al. (Reference Davidoff, Brown and Diamond2005). In column (c), we then start to add the general equilibrium implications of the stimulation policy by calculating the welfare change that would prevail if the factor prices would adjust to their new values. There we see that taking these effects into account already reduces the impact on welfare by a bit. In column (d), we reset the factor prices to their initial values but now calculate the welfare level that would have prevailed if we take into account that the availability of a complete annuity market abolishes the transfers received by the households. This exercise highlights that the loss of these transfers nullifies the welfare benefits from the positive welfare gains from the annuity policy. In column (e) we find that, taking into account partial- as well as general-equilibrium effects, a policy of stimulating annuity markets will actually decrease welfare of steady-state individuals.
General-equilibrium decomposition

Notes: NA and CA stand for, respectively, no annuitization (θ = 0) and complete annuitization (θ = 1). GE and PE denote, respectively, general equilibrium and partial equilibrium. The different cases are: (a) Base case; (b) Old factor prices and transfers, new annuity rate; (c) New factor prices and annuity rate, old transfers; (d) Old factor prices, new annuity rate and new (zero) transfers; (e) New factor prices, annuity rate, and new (zero) transfers; (f) GE solution with old labour productivity path H v,t .
In the final column (f) of Table 4, we reflect on the importance of the human capital channel by displaying the level of welfare that would prevail if all general equilibrium effects would have been taken into account but the life-cycle profile of human capital H v,t would have remained as it was in the benchmark. The relevant column reveals that the increase in human capital associated with the increase in labour supply acts as a buffer against the adverse impact of annuitization. Indeed, the loss in welfare would have been much greater if the human-capital channel would have been disregarded.
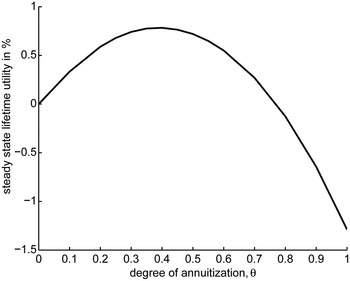
The opposing forces of the partial- and general-equilibrium effects identified in Table 4 beg the question: Is there some intermediate level of annuitization for which welfare is optimal?Footnote 12 In Figure 5 we perform a search for a such a welfare-optimizing level of annuitization by tracing out the levels of individual welfare for different degrees of annuitization, θ. There we see that for low levels of annuitization the partial-equilibrium effect dominates but that for levels of annuitization above θ* = 0.39, the general-equilibrium effects start to dominate. This implies that a policy of stimulating annuity markets should assure that not all assets held by the individuals are annuitized.Footnote 13
Optimal θ.

4.2 Transition to the optimum
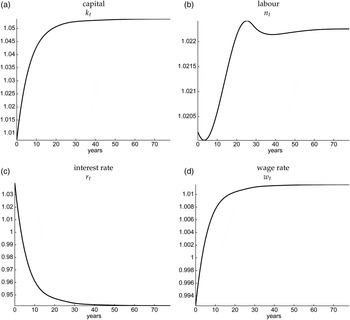
We now turn to the analysis of what the transition to the optimal level of annuitization described in the previous section would look like. To that end, consider Figure 6 in which we trace out the transitional paths of aggregate capital and labour per capita as well as factor prices. All variables have been scaled by their initial steady-state values. The figure shows that the transition of k t is monotonic, whilst N t immediately following its jump at shock-time, proceeds non-monotonically to its new steady-state value. Since the movements in capital are much larger than the ones in labour, however, the capital intensity, and thus factor prices, converge monotonically to their new steady-state values.
Transitional dynamics.

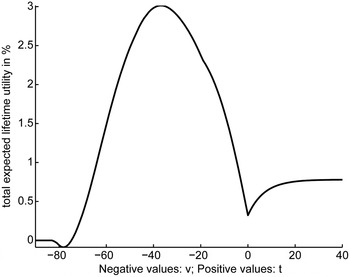
In Figure 7, we assess how the various cohorts alive at the time the policy was enacted are affected by the availability of annuities. In the figure, we map out welfare of individuals born before or after the policy was implemented. The policy was enacted at time t 0 = 0. Negative values along the horizontal axis state the generations index v whilst positive values state post-shock time t. Hence, a value of, for instance, − 40 indicates the level of welfare of an individual who was 58 years old at the time the policy was implemented (his model age is 40 and his biological age is therefore equal to 58). Conversely, 20 indicate the welfare level of an individual who enters the economy as a newborn 20 years after the policy was implemented. The graph highlights that the monotonic transition of the capital intensity and factor prices does not carry over to the utility profile of the different generations. Indeed, individuals who were 54 at shock-time (v = −36) gain most from the introduction of the policy.
Welfare of different generations – stationary demography.

To understand the variation of the welfare effects over the different generations it helps to distinguish three broad groups, namely (a) existing generations with positive financial assets (the middle-aged and old at the time of the shock), (b) the existing generations without any financial assets (the borrowing-constrained young at the time of the shock), and (c) the future newborn generations.
With respect to group (a) consider the individual asset profiles outlined in panel (c) of Figure 4 above. There we see that at age 63 individuals reach the maximum of their asset holdings. As they did not anticipate the reform, they are confronted with a windfall gain in which they suddenly get a much higher rate on their asset holdings. Effectively, these individuals gain twice – they received transfers throughout most of their lives and, in addition, suddenly get a much higher return on their assets. These combined benefits assure that they stand to gain a lot from the new policy. The individual welfare effect peaks at the lower age of 54, however, because these relatively young middle-aged individuals have a longer life during which to enjoy the annuity scheme.
With respect to individuals in group (b) we note that their welfare effect gets larger the older they are, i.e., the closer they are to the switching point F b where they start to save at the annuity rate, which is high at the time of the shock both because of the mortality premium but also because the real interest rate is high during the early transition phase. In contrast, by the time the youngest members of this group start to save, the mortality premium is still in place, but the interest rate has more or less settled down to its new steady-state level.
Finally, individuals born after the policy was enacted (members of group (c)) save against the new rate for their entire life, but may not yet fully benefit from the higher wage rate. Newborns entering the economy 40 years after the policy was implemented have the new steady-state level of welfare, which is higher than in the benchmark steady-state but substantially lower than that of many individuals alive at the moment the policy was implemented.
4.3 Robustness
The foregoing analysis has resulted in two important conclusions. First of all, stimulating annuity markets to the point where all assets held by individuals can be annuitized is detrimental for steady-state welfare and, therefore, there exists an optimal degree of annuitization of non-human assets that is <100%. Second of all, stimulating annuity markets to the point that it optimizes welfare has very unequal welfare effects over different cohorts. These are strong conclusions and we use this section to study their robustness. We find that in our context the most important parameter for the welfare analysis is the intertemporal elasticity of substitution. This parameter strongly affects the savings reaction to the altered return on assets and the loss of transfers. Moreover, we study whether and to what extent our conclusions depend on the type of redistribution scheme that is chosen for the accidental bequests.
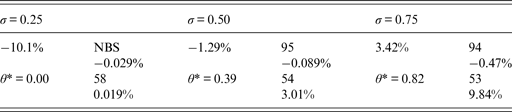
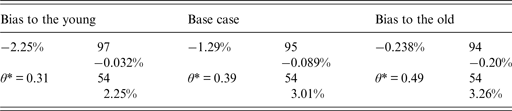
The robustness analysis over the intertemporal elasticity of substitution (σ) is taken up in Table 5. Along the top row we vary the values of σ. To understand the table entries consider, for instance, the cell in the middle of the table. In that cell we summarize all relevant outcomes using the original parameter values from Table 2. The percentage value in the left part of the cell indicates the change in welfare for the steady-state generation if annuity markets are stimulated such that all assets can be annuitized. As established above, for the original parameter values, this leads to a decline in steady-state welfare. The θ* value below the percentage value is the optimal size of the annuity market. In this case that is 0.39, indicating that households should not be allowed to annuitize more than 39% of their total asset holdings. In the right part of the cell, we study how stimulating the annuity market to its optimal size affects different generations. In this part of the cell, the value at the top indicates the age of the generation that loses most; the percentage value below it indicates how big that loss is. Similarly, the lower value indicates the age of the generation that gains most and percentage value indicates how big that gain is. As concluded above, the currently middle aged gain most, everybody else gains less or even loses out.
Robustness analysis for σ

Varying σ reveals that for a lower value of σ the loss in steady-state welfare from moving to a complete annuity market increases p t−v . Indeed, the total loss is so much larger that it is optimal for the annuity market to remain closed. As the annuity market remains closed, there is no difference in welfare in the transition toward the new policy. Going ahead and stimulating the annuity market anyway would result in a welfare gain for the currently middle aged but, depending on how much the market is stimulated, an individual in the new steady state would lose very heavily.Footnote 14 Proceeding from left to right we see that for higher values of σ the steady-state generation may actually gain from a policy that stimulates the annuity market to its maximum. This does not, however, imply that the annuity market should actually be stimulated to the maximum. After all, the opposing forces outlined above are still at work and the optimal size of the annuity market still turns out be less than 1 for σ = 0.75; a value at the high end of most empirical estimates.
In Table 6, we provide a robustness analysis over the regime used to distribute the accidental bequests left in the absence of a full annuity market. For this analysis we rely on two prototypical redistribution regimes: one in which the proceeds are distributed with a strong skew towards the young and one in which the proceeds are distributed with a strong skew towards the elderly. For the former, we see that the drop in welfare from fully stimulating the annuity market becomes lager and, consequently, the size of the optimal annuity market becomes smaller. In contrast, for the latter, we see the reverse with the welfare drop becoming smaller and the size of the optimal annuity market becoming larger. To appreciate these effects, remember that the young save a relatively larger share of their income. Hence, if they lose their transfers because the annuity market has been stimulated, they need to save more out of current income and, therefore, less assets are available for consumption early in life. This, in turn, decreases lifetime welfare. By limiting the size of the annuity market the young do not lose their transfers, but can still enjoy a higher return over a share of their assets.
Robustness analysis for the transfer scheme

In Table 7, we pave the way for the analysis of the time-varying demographic structure in the next section. In the first row of this table, we study how the optimal degree of annuitization is influenced by the underlying demographic structure. In particular, we analyse what the optimal degree of annuitization would have been if, instead of the current mortality and fertility profiles, we would have used the profiles of either 1950 or 2100.Footnote 15 From a demographic perspective we find that in 1950 life expectancy at birth was 68, while in 2100 it is forecasted to be 84. Comparing the various cell entries reveals a negative relationship between mortality and the optimal degree of annuitization. Indeed, all else unchanged, using the life expectancy of 1950 leads to a lower optimal degree of annuitization while using the forecasted life expectancy leads to a higher optimal degree of annuitization. Intuitively, this negative relationship is a direct consequence of the higher need for retirement savings that is associated with a lower mortality rate.
Robustness analysis for life expectancy

1 Benchmark human capital depreciation schedule.
2 High human capital depreciation schedule.
3 Low human capital depreciation schedule.
Although the negative relationship between mortality and the optimal degree of annuitization is intuitively appealing, we caution the reader not to interpret it as implying that as populations age also annuitization rates should increase. Indeed, in the final row of Table 7 we add an important feature to the analysis by letting the depreciation rate of human capital (
 $\delta _{t - v}^h $
) vary alongside the mortality rate. As was stressed by Heijdra and Reijnders (Reference Heijdra and Reijnders2012), the age-dependent depreciation schedule for human capital captures the concept of economic ageing. Intuitively, old age is assumed to be accompanied by loss of skills and a general slowing down of information processing ability and other such tasks. It is conceptually different from biological ageing because that has to do with the rising probability of death as one ages. But there nevertheless may be a positive correlation between the two types of ageing.
For comparison purposes, we set the critical age from which human capital depreciation starts to vary with age such that the proportion of the life cycle in which human capital is depreciating is the same for the 1950, benchmark and 2100 scenarios. This leads to a cut-off age of 51 for the 1950 scenario and 63 for the 2006 scenario (compared with 57 in the benchmark). By varying the human-capital depreciation schedule in such a fashion, the age at which individuals decide to retire also adjusts. That is, while in the benchmark scenario they retire at age 66, in the 1950 scenario they retire at age 60 and in the 2100 scenario at age 71.
Using these new values of human-capital accumulation and redoing the exercise of row 1 reveals a much less pronounced relationship between mortality and the optimal degree of annuitization. Indeed, in this case there is less difference between the current optimal degree of annuitization (0.39) and the one for 2100 (0.40). These findings imply that it is not the relationship between mortality and the degree of annuitization per se, but the relationship between the shares of the life cycle spent in retirement and the degree of annuitization. If mortality and human capital adjust jointly, that share stays constant and so does the optimal degree of annuitization. We end this section with a note of caution that the scenario considered here is quite optimistic as it implies that an additional year of life expectancy leads to an additional 8 months of work. In reality this will probably be less and therefore, the optimal future degree of annuitization will be higher than the current one.
5 Time-varying demography
For the final analysis of the paper we consider the impact of focusing on a time-varying instead of a steady-state demography. That is, while in the analysis up until this point we have used realistic values for the mortality as well as the fertility rates, we have not taken into account that these vary substantially over time. In reality, however, they do change with the (total) fertility rate steadily dropping from its maximum of 3.6 in 1958 to its current value of 1.9. In addition, life expectancy at birth (as an indicator of mortality) has increased by more than a decade over the last 60 years. Taken together, these ever changing values of the demographic structure imply that the economy is permanently on some transitional path. This in turn implies that any economic policy is necessarily implemented with the economy outside of its demographic and economic steady states. Hence, in what follows we consider the consequences of stimulating the annuity market when the economy is neither in its demographic nor its economic steady state.
To this end, we start from a scenario in which the economy is in both its demographic as well as its economic steady state in 1950. From there on we feed the observed values for the (age-specific) fertility and mortality rates into the model, which assures that the economy is constantly adjusting to the changing demographic structure. For the development of fertility we assume that fertility rates remain constant on their level of 2008.Footnote 16 For the development of mortality after 2008 we perform a Lee and Carter (Reference Lee and Carter1992)Footnote 17 decomposition from 1950 to 2008 and then forecast its development onward to 2100. In particular, mortality rates are decomposed according to:
 $$\ln MR_{t,j} = a_j + b_j d_t, $$
where a j and b j are age-specific constants and d t is a time-dependent drift parameter evolving according to a unit-root process with drift d t such that:
 $$d_t = \zeta + d_{t - 1} + \varepsilon _t, \quad \varepsilon _t {\rm \sim} N(0,\;\sigma _\varepsilon ),$$
where ζ is a constant and ε t is the error term. Using the process described in (27) and (28) we estimate the parameters until 2008 and then forecast the mortality up to 2100. Using this procedure we find that life expectancy gradually increases from 76 years in 2008 to 84 years in 2100.
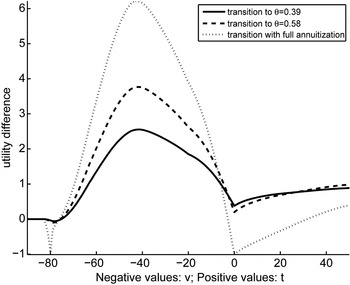
In order to study our policy of interest and to compare the results with the previous section, we let there be no annuity market until 2010. From then onward we then let the government stimulate the annuity market such that either a 39% share can be annuitized, a 58% share, or everything. The former two values are the optimal values (without the adjustment of the human capital depreciation schedule) for the 2010 and 2100 scenario, respectively, and the final value is the optimum if general-equilibrium would not be taken into account.
We visualize the welfare impact of the various scenarios in Figure 8 where we trace out the 39% scenario in the solid line, the 58% scenario in the dashed line and the full annuitization scenario in the dotted line. We indicate the policy implementation time as time 0, all currently alive cohorts are to the left of time 0 and future generations to the right. As can be seen the highest long-run steady-state welfare is reached when the annuity market is stimulated to its long-run optimal value as identified in Table 7. The lowest welfare is reached when the annuity market is stimulated to the maximum, and when the annuity market is stimulated to its current optimum welfare is between the two other long-run welfare values. Interestingly, the welfare ranking is reversed when we focus on the welfare of the transition generations. In that case, we see that the currently middle-aged cohort gains most if annuity markets are stimulated to their maximum. They gain less if the annuity market is stimulated to its long-run optimum value and least if it is stimulated to its 2010 optimum.Footnote 18
Welfare of different generations – time-varying demography.

The graph indicates that when implementing macroeconomic policies it is important to consider how the demographic structure changes in the future. Indeed, if future demographic developments are ignored intermediate generations gain less than they potentially could from stimulating annuity markets.
6 Discussion
At the end of section 2 we stated up front which real-life features we have allowed to play a role in our theoretical model and quantitative exercise. Of course, the list was not exhaustive, i.e., in order to keep the analysis tractable we left out features that are relevant and may qualify our conclusions. For example, a caveat of the current analysis is that our model does not allow for the inclusion of an operative bequest motive. Using a partial-equilibrium life-cycle model, Lockwood (Reference Lockwood2012) goes so far as to suggest that a bequest motive could fully eliminate the private benefits of annuitization. However, the partial-equilibrium analysis of Pashchenko (Reference Pashchenko2013) shows that, even after allowing for a bequest motive, individuals should still annuitize a substantial part of their assets, while, in practice, they do not do so. Hence, whereas the omission of a bequest motive may influence the quantitative results of our paper, we are confident that our main conclusions also apply to a world in which operative bequest motives do exist. After all, the existence of a bequest motive does not eliminate accidental bequests. Hence, the stimulation of annuity markets in such a world will still reduce transfers received by the young. Which, in turn, will set off the general-equilibrium repercussions described in our paper. The size of the effect will depend on the amount of assets that individuals reserve for intentional bequests. Naturally, enriching the model with an endogenous bequest motive remains an interesting area for future research.
As a second example, we are fully aware of the fact that the human capital process adopted in this paper could be generalized further. For example, if individuals allocate their time between working and schooling – the ‘learning-or-doing’ model of Heckman (Reference Heckman1976) and many others – then a reduction in government transfers may induce them to work more and to spend less time on education. In the absence of on-the-job learning (or with a weak LBD effect) this would lead to a reduction in their human capital.Footnote 19 While we recognize the restrictiveness of our approach in this area, we nevertheless feel that adding the human capital feature to the discussion about the (non)desirability of annuitization is an important step forward. Indeed, we do know that people invest in physical and human capital, and we do know that annuities and ageing affect both types of investment decisions. A further fleshing out of the human capital accumulation process is clearly desirable but beyond the scope of the present paper.
7 Conclusion
In this paper, we studied the impact, transition, and long-run effects of stimulating annuity markets in a dynamic general-equilibrium overlapping-generations model. We found that the beneficial partial-equilibrium benefits of annuitization as found in the seminal contributions of Yaari (Reference Yaari1965) and Davidoff et al. (Reference Davidoff, Brown and Diamond2005) are counteracted by negative general-equilibrium effects arising mainly from the loss of accidental bequests. By balancing the positive partial-equilibrium and negative general-equilibrium forces we show that there generally exists some intermediate level of annuitization, such that the welfare of the long-run steady-state individual is maximized. In studying the transition to this optimum level of annuitization, we found that currently middle-aged individuals stand to gain most from the stimulation of annuity markets. Moreover, we showed that when implementing a macroeconomic policy such as the stimulation of annuity markets it is important to consider how the demographic structure will change in the future. Finally, we have highlighted the centrality of the interplay between human-capital accumulation and annuity market policy, especially when the demographic structures develop over time.
While in the current paper we have focused purely on how a government policy of stimulating annuity markets affects the welfare of individuals, we have not considered how such a policy may interact with other government policies such as social security. In this regard, an interesting application of our model is to consider whether the moderating effect of imperfect annuity markets on the steady-state impact of social-security reforms identified in Bruce and Turnovsky (Reference Bruce and Turnovsky2013) also applies to the dynamics induced by such reforms.
In terms of economic policy, our analysis implies that governments should be cautious when stimulating annuity markets as the immediate positive gains for the currently alive middle-aged individuals may come at a high cost for future generations. However, with current levels of annuitization being extremely low, some stimulation of these markets as suggested by the OECD is bound to have a beneficial impact on both currently alive and future generations.