Introduction
The diversity of poultry genetic resources in the world is decreasing. This is manifested by 38 percent of the reported breeds being classified as at-risk status (Hoffmann, Reference Hoffmann2010). Diversity is important as it serves as a reservoir of genes needed for changing environmental conditions and production enhancement. It is also the main source of genes to meet the changing preferences of consumers, adaptation to different production practices, and tolerance or resistance to emerging diseases. However, conservation of 1 273 reported poultry breeds is financially infeasible (FAO, Reference Rischowsky and Pilling2007; Boettcher et al., Reference Boettcher, Tixier-Boichard, Toro, Simianer, Eding, Gandini, Joost, Garcia, Colli and Ajmone-Marsan2010).
Six out of 243 recorded local poultry breeds in Asia can be found in the Philippines (FAO, Reference Rischowsky and Pilling2007; DAD-IS, 2011). Farmers prefer native chickens as they can survive better in local conditions with available feed resources. They need minimal management to produce meat and eggs which are both used for household consumptions and local markets (Magpantay et al., Reference Magpantay, Supangco, Pacificador, Sevilla, Lambio and Gayeta2006). The population ratio of native chickens to commercial varieties shows a declining trend during the last decade (BAS, 2011). These can be due to the changes in production systems (Rege and Gibson, Reference Rege and Gibson2003), socio-economic preference (FAO, Reference Rischowsky and Pilling2007), occurrences of catastrophe (FAO, Reference Rischowsky and Pilling2007; Lamont, Reference Lamont2009; Hamer, Reference Hamer2010) and indiscriminate crossing of breeds (Hiemstra et al., Reference Hiemstra, Drucker, Tvedt, Louwars, Oldenbroek, Awgichew, Kebede, Bhat and da Silva Mariante2006). However, prioritization of the breeds for conservation must be done to justify financial feasibility (Boettcher et al., Reference Boettcher, Tixier-Boichard, Toro, Simianer, Eding, Gandini, Joost, Garcia, Colli and Ajmone-Marsan2010). This needs comprehensive information and knowledge on the level of diversity within and between breeds, which can be done through molecular and phenotypic techniques. Molecular characterization provides reliable information but is highly complicated and expensive (Al-Atiyat, Reference Al-Atiyat2009). It should also be supplemented with phenotypic information in order to be useful for any decision making regarding conservation and utilization (Davila et al., Reference Davila, Gil, Resino-Talavan and Campo2009; Zanetti et al., Reference Zanetti, de Marchi, Dalvit and Cassandro2010). In the absence of molecular data, the discriminate and cluster analysis of phenotypic characteristics can be used as alternative techniques in determining genetic groups (FAO, 2012; Boettcher et al., Reference Boettcher, Tixier-Boichard, Toro, Simianer, Eding, Gandini, Joost, Garcia, Colli and Ajmone-Marsan2010). This can provide information on phenotypic distances between breeds or genetic groups of animals which can be used towards prioritization of breeds or groups for conservation, and studies have proven its effectiveness as an alternative method (Barbosa et al., Reference Barbosa, Regazzi, Lopes, Breda, Torres and Filho-Torres2005; Abdelqader, Wollny and Gauly, Reference Abdelqader, Wollny and Gauly2008; Al-Atiyat, Reference Al-Atiyat2009; FAO, 2009a; Dana et al., Reference Dana, Dessie, van der Waaij and van Arendonk2010).
Among the regions in the country, Western Visayas has the largest population of native chickens in the Philippines (BAS, 2011). There have been studies dealing with native chickens for the standardization of DaragFootnote 1 chickens (Cocjin et al., Reference Cocjin, Lambio, Hipolito, Gonzales, Linga, Tomambo, Roxas, Arenga and Casiple1999, Reference Cocjin, Roxas, Casiple and Arenga2001, Reference Cocjin, Roxas, Arenga and Casiple2004, Reference Cocjin, Roxas, Arenga and Casiple2007; Lopez, Reference Lopez2008; Tomambo et al., Reference Tomambo, Cocjin, Roxas, Casiple and Arenga2010). Additional data on diversity of other genetic groups of native chickens is important for future breeding programs. The uniqueness of native chickens from Antique, Iloilo, Guimaras and Negros Occidental based on protein polymorphisms should be supplemented with phenotypic data to confirm their distinctiveness (Roxas, Villanueva and Lambio, Reference Roxas, Villanueva and Lambio1996; Davila et al., Reference Davila, Gil, Resino-Talavan and Campo2009; Groeneveld et al., Reference Groeneveld, Lenstra, Eding, Toro, Scherf, Pilling, Negrini, Finlay, Jianlin, Groeneveld and Weigend2010; Zanetti et al., Reference Zanetti, de Marchi, Dalvit and Cassandro2010). Thus, this study was conducted to determine the phenotypic clusters or groups and analyse the diversity of native chickens in Western Visayas, Philippines.
Materials and methods
Sampling sites, selection of farmers and number of chicken characterized
This study employed purposive sampling in selected provinces of Aklan, Antique, Capiz, Guimaras, Iloilo and Negros Occidental in Western Visayas. Forty-five farmers from three different municipalities of each province were identified, through the help of the personnel from the office of municipal agriculturist and the farmer technicians of Magsasaka at Siyentipiko para sa Pag-unlad ng Agrikultura (MASIPAG) and with allied people organizations (POs) in some areas. This was to limit collecting data from closely related flocks (Mwacharo et al., Reference Mwacharo, Nomura, Hanada, Jianlin, Hanotte and Amano2007). The flock size considered for characterization had to have at least one rooster and five hens.
One rooster and two hens at their active reproductive age, with dominant plumage colour and pattern were taken from each farmer for characterization, with a total of 810 chickens selected for characterization in this study.
Data collection
The data, which included selection practices and means of identifying native chicken genetic groups, were collected through personal interviews with the farmer respondents using a structured questionnaire. Phenotypic traits like plumage colour and pattern; feather distribution and morphology; colours of the earlobe, skin and shank; shapes of the head, breast, and body; comb type, skeletal variants, live weight, egg weight, age at first laying and annual egg production were also collected based on the guidelines set by the FAO (2012), Cuesta (Reference Cuesta2008) and FAO & UNEP (1986). This information was gathered following the procedures explicitly described by Cabarles et al. (Reference Cabarles, Lambio, Vega, Capitan and Mendioro2012) in their study “Distinct morphological features of traditional chickens (Gallus gallus domesticus L) in Western Visayas, Philippines”.
Statistical analysis
Cluster analysis
Cluster analyses are a set of algorithms used to analyse data and group data according to similarities, and is used to assign individual chickens into groups according to the set of traits considered. The qualitative traits, morphometric traits, reproductive performance, survival rate and growth performances were subjected to two-step cluster analyses to determine the combination of traits with higher discriminating values and number of possible groups. Only the live weight, egg weight, age at first egg laying, annual egg production and head shape were found to have good discriminating values. These data were further subjected to discriminate analysis to determine canonical discriminating function, group membership and cluster size. The hierarchal cluster analysis was used to determine phenotypic distances using the squared Euclidean distances which were illustrated using a dendrogram.
Comparison of native chicken groups
Native chicken groups were identified based on the data for live weight, egg weight, age at first laying and annual egg production. This data was subjected to one-way analysis of variance (ANOVA). Significant differences were further analysed using the Duncan's Multiple Range Test. The Kruskall-Wallis test was used to analyse the differences in occurrences of head shapes; whereas the least significant difference (LSD) for rank was used to determine significant differences between the groups.
Phenotypic diversity indices
The phenotypic diversity indices for plumage colour and pattern, feather morphology and distribution, earlobe colour, skin colour, shank colour, head shape, breast shape, body shape, comb type, skeletal variants and live weight of different groups were determined using the Simpson's diversity index (SID). The SID was computed using the equation (Hunter and Gaston, Reference Hunter and Gaston1988; Magurran, Reference Magurran2004; Price, Reference Price2004):
 $${\rm SID}=1 - \left[{\displaystyle{{\sum\nolimits_{i=1}^S {n_i \lpar n_i - 1\rpar } } \over {N\lpar N - 1\rpar }}} \right]$$
where: SID = Simpson's index of diversity; N = total number of observations of representative population; n i = number of observations belonging to i th category; S = total number of categories for characterized traits.
The index value ranges from 0–1; where 0 means perfectly homogenous and 1 as perfectly heterogeneous or the highest diversity. On the other hand, the equality of distribution for the above phenotypic traits was determined using the Simpson's equality of distribution (ED) equation (Beals, Gross and Harrel, Reference Beals, Gross and Harrel1999):
 $${\rm ED=}\left[{\displaystyle{1 \over {\sum\nolimits_{i=1}^S {\,pi^2 } }}} \right]\times\displaystyle{1 \over S}$$
where: ED = Simpson's equality of distribution; pi = proportion of the ith category in relation to total number of categories for the trait; S = total number of categories for the trait.
The ED index ranges from 0 to 1; with 0 as uneven distribution and 1 as equally distributed.
Results and discussion
Selection practices and groups of native chickens
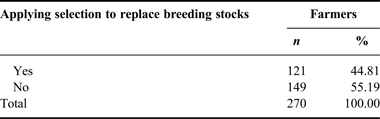
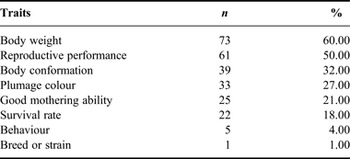
Tables 1 and 2 shows the distribution of farmers who practiced selection and the traits they considered when selecting their native chicken breeding stocks.
Distribution of farmers who practice selection in raising their native chickens.

Distribution of farmers who practice selection as to their preferred traits for their native chickens breeding stocks (multiple response; n = 121).

Selection practices and means of identifying local names
The data showed that of the farmers questioned, 44.81 percent selected their breeding stocks, with the majority (60 percent) preferring body weight, while the rest considered reproductive performance (50 percent), body conformation (32 percent), plumage colour (27 percent), good maternal behaviour (21 percent) and survival rate (18 percent) as bases for selecting their breeding stocks. Some farmers also preferred chickens that regularly roosted in hen houses and hens which laid eggs in nest boxes. Only one of the farmers considered the breed or strain during selection. These findings indicate that nearly half of the farmers were aware of the importance of breeding stock selection; in addition, they were also concerned with the improvement of body size and reproductive performance of native chickens. These findings were similar to the report on famers in Southern Tagalog (Magpantay et al., Reference Magpantay, Supangco, Pacificador, Sevilla, Lambio and Gayeta2006).
Groups of native chickens
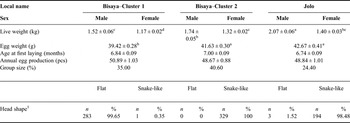
Table 3 shows the phenotypic differences among the groups of native chicken in Western Visayas, Philippines.
Phenotypic differences between groups of native chickens in Western Visayas, Philippines.

a,b,c,dDifferent superscripts within row indicate significant differences (P < 0.01).
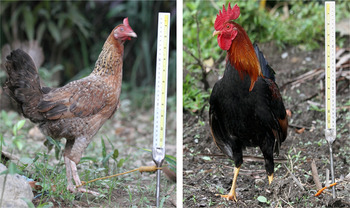
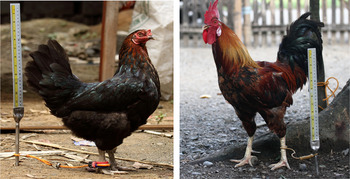
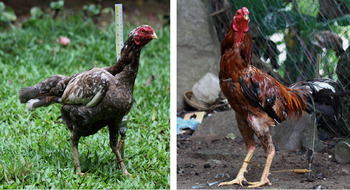
Cluster analysis was done using the head shapes, live weight, egg weight, age at first laying, and annual egg production of native chickens as discriminating variables. The results revealed that Bisaya chickens can be further divided into two groups, leading to three major groups. These are the Bisaya–Cluster I (Figure 1), Bisaya–Cluster II (Figure 2) and Jolo (Figure 3) chickens.
The hen (left) and rooster (right) of Bisaya–Cluster I which were smaller in body size and possessing flat head shape.

The hen (left) and rooster (right) of Bisaya–Cluster II which were bigger than those of Bisaya–Cluster I but smaller than Jolo and possessing snake like head shape.

The hen (left) and rooster (right) of Jolo which were the largest and had snake like head.

The Jolo rooster was the heaviest (P < 0.01) having 2.07 ± 0.06 kg live weight, this was followed by Bisaya–Cluster II with 1.74 ± 0.05 kg and Bisaya–Cluster I with 1.52 ± 0.06 kg. The live weight of hens ranged from 1.17 ± 0.02 to 1.40 ± 0.03 kg with Jolo hens the heaviest and the Bisaya–Cluster I as the lightest. Hens of Bisaya–Cluster II (1.32 ± 0.02) had an intermediate live weight. The observed variations in live weight may be due to the genotypes of each group. Jolo chickens were introduced by Muslim sailors from Jolo through the “pauwak”Footnote 2 . They are bigger, noted for their stamina and leaner than the Bisaya chickens. The improvement in live weight of Bisaya–Cluster II was probably due to the crossbreeding of Jolo with Bisaya–Cluster I. Farmers in the region may have opted to improve this trait and therefore found it necessary to acquire Jolo chickens for this purpose.
There was no significant (P > 0.05) difference among the native chickens in terms of age at first laying and annual egg production. The delayed onset of egg laying can be a natural response of hens to fluctuating availability of feeds in a scavenging production system (Zaman, Sorensen and Howlider, Reference Zaman, Sorensen and Howlider2004; Mapiye et al., Reference Mapiye, Mwale, Mupangwa, Chimonyo, Foti and Mutenje2008). Ershad (Reference Ershad2005) reported that hens raised under intensive management lay their first egg at four to five months rather than at seven months of age as observed in this study. The egg weight of Jolo (42.67 ± 0.41 g) and Bisaya–Cluster II (41.63 ± 0.30 g) were comparable but significantly higher (P < 0.01) than those of Bisaya–Cluster I (39.42 ± 0.28 g). These variations were shown to be directly related to the hens' live weight. Heavier hens laid larger eggs as explained by Wolanski et al. (Reference Wolanski, Renema, Robinson, Camey and Fancher2007).
All the Bisaya–Cluster II and Jolo chickens had snake-like heads whereas Bisaya–Cluster I had a flat head shape. According to Dana et al. (Reference Dana, Dessie, van der Waaij and van Arendonk2010) head shape is one of the important morphological characteristics that can be used to discriminate differences between populations. The findings of this study corroborated this observation, with the occurrence of snake-like heads among Bisaya chickens possibly due to its crossing with Jolo chickens. The outstanding growth performance of the Bisaya–Cluster II may have encouraged more farmers to breed them. This was confirmed by 40.60 percent of the characterized chickens belonging to Bisaya–Cluster II.
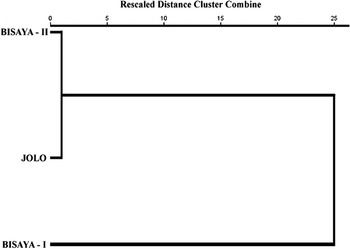
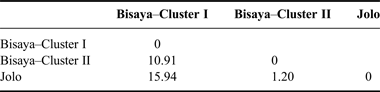
Table 4 presents the squared Euclidean distances of different groups of native chickens in Western Visayas, Philippines while Figure 4 shows the dendrogram obtained through the squared Euclidean distances of the hierarchal cluster analysis for the three major groups of native chickens in Western Visayas, Philippines. The result showed a closer squared Euclidean distance unit of 1.20 between Jolo and Bisaya–Cluster II. The distances between Bisaya–Cluster I to Bisaya–Cluster II and Jolo were 10.91 units and 15.94 units, respectively. The close distance between Jolo and Bisaya–Cluster II was due to their similarity in head shape. This conforms to the observation of Dana et al. (Reference Dana, Dessie, van der Waaij and van Arendonk2010) when using head shape as a discriminating variable. The closer distance of these two groups was further strengthened by the comparable live weight of hens and egg weight.
Dendrogram obtained through the squared Euclidean distances of hierarchal cluster analysis for the three major groups of native chickens in Western Visayas, Philippines.

Squared Euclidean distances between different groups of native chickens in Western Visayas, Philippines.

This is in terms of similarity of live weight, egg weight, age at first laying, annual egg production and head shape.
The multivariate cluster analysis employed in this study also revealed the discrete differences of native chicken groups in this region. Similar studies conducted in other countries using this technique showed analogous results. Using this technique, Abdelqader, Wollny and Gauly (Reference Abdelqader, Wollny and Gauly2008) and Al-Atiyat (Reference Al-Atiyat2009) were able to identify groups within local and specialized chickens in Jordan. This result was similar to those conducted among the local chickens in Cambodia (FAO, Reference Dinesh, Geerlings, Solkner, Thea, Theme and Wurzinger2009).
Phenotypic diversity of different groups of native chickens
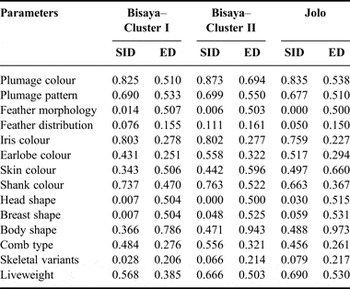
Table 5 shows the Simpson's diversity indices for selected phenotypic parameters of different groups of native chickens in Western Visayas, Philippines. The frequency and percentage distributions of these phenotypic traits are shown in Supplementary Table S1.
Simpson's diversity index (SID) and equitability of distribution (ED) for selected phenotypic traits of different groups of native chickens in Western Visayas, Philippines.

Plumage colour and pattern
The results showed that the Simpson's diversity index for plumage colour of Bisaya–Cluster I, Bisaya–Cluster II and Jolo were 0.825, 0.873 and 0.835, respectively. These indicate relatively heterogeneity of groups in this trait; however, Bisaya–Cluster II (0.694) had higher equitability of distribution (ED) than the Bisaya–Cluster I (0.510) and Jolo (0.538) chickens. These findings imply that chickens from Bisaya–Cluster II had more variations in plumage colour than those belonging to the other groups. The reason for this variation was probably due to the dominance of a particular colour within the group and selection preferences of farmers.
Diversity index for plumage colour pattern was somewhat lower than that in the plumage colour. The Bisaya–Cluster II had a higher diversity (0.699) than Bisaya–Cluster I (0.690) and Jolo (0.677) chickens. The equitability of distribution ranged from 0.510 to 0.550. Observed differences between plumage colour and colour pattern may be due to limited types of the latter than the former. The prevailing colour patterns may possibly have been more adapted to the present environment of the chickens. The number of occurrences was close across groups indicating a few types of plumage colour patterns dominating the groups of native chickens in the region. Other colour patterns were noted with the number of chickens with these additional colour patterns being fewer.
Feather morphology and distribution
It was found that the feather morphology (0.000–0.014) and distribution (0.050–0.111) of native chickens in the region were homogenous to normal (Table 5). The results indicate that mutations in these traits were very minimal; however, ED in feather morphology was average (0.500–0.507) while that in feather distribution was unevenly distributed (0.150–0.161). The higher ED in feather morphology can be attributed to their limited types; probably due to the limitation of the equation in determining equitability of distribution. The presence of several categories enables the ED to detect the evenness of distribution as observed in feather distributions.
Colours of the iris, earlobe, skin and shank
Results showed moderately greater diversity in iris colours of Bisaya–Cluster I (0.803) and II (0.802) than that of Jolo (0.759) chickens (Table 5). However, the ED was closer to uneven distribution (0.227–0.278). This implies that the occurrence of various iris colours increase the diversity level but the greater number of chickens having amber, golden brown, sunburst and flame than those observed with other colours reduced the ED. The absence of additional colours in chickens from other groups further lowers the equitability distribution. The diversity of iris colours can be attributed to the amount of carotenoid ingested and utilized, gene action and effects of other colour modifying genes. Its distribution may be due to its prominence among the native chickens in Western Visayas.
In terms of earlobe colour, it was found that the diversity level among Bisaya–Cluster II (0.558) and Jolo (0.517) was slightly above the average; whereas that of Bisaya–Cluster I (0.431) was below average. Furthermore, the distribution was not equal given the ED which ranged from 0.251 to 0.322. This indicates that there were some earlobe colours which were not observed in other groups. The lower ED was due to a greater number of chickens having red and reddish with white earlobes than those having other colours. The observed differences may be due to chickens that inherited the most dominant earlobe colours from their parental lineages, the Gallus gallus. The mutation of other colours was not prominent; probably because of some associated traits that limits their adaptation to the local conditions and available feed resources.
The diversity in skin colour was below the average which ranged from 0.343 to 0.497; whereas the ED was above average (0.506–0.660). Lower diversity index was due to limited skin colour and the greater magnitude of chickens having only one colour. The above average ED was due to fewer numbers of chickens having the other colours. The Jolo chickens had a relatively higher ED due to the near equal distribution of chickens of two major skin colours compared with the other groups. The observed diversities and distributions of skin colour may be attributed to its dominance over the specific group.
It was also found that the diversity in shank colour ranged from 0.663 to 0.763 with those from Bisaya–Cluster II being relatively higher than the Jolo chickens. On the other hand, the ED for Bisaya–Cluster I, Bisaya–Cluster II and Jolo chickens were 0.470, 0.522 and 0.367, respectively. These results indicated that diversity in shank colour is greater but the non-existence of other colours in some groups decreases its equitability of distribution. This lower ED signifies the minimal number of chickens having colours other than the dominant one.
Shapes of head, breast and body
Results showed that the head shapes were homogenous (0.000–0.030; Table 5). The Bisaya–Cluster II and Jolo chickens were homogeneous for having a snake-like head while the Bisaya–Cluster I was homogeneous for having a flat head. Its ED was in the average of 0.500–0.515. Dana et al. (Reference Dana, Dessie, van der Waaij and van Arendonk2010) commented that this trait can be used as a discriminating variable considering its specificity of occurrence among the groups of Ethiopian local chickens. This proposition agrees with the findings of this study. The average ED can be attributed to the distribution which was concentrated only in one of two categories.
Native chickens in Western Visayas had wedge-shaped breast (0.007–0.059) while the ED ranged from 0.504 to 0.531. The detected prominence of a wedge-shaped breast was due to the interaction of multiple genes as pointed out by Moiseyeva et al. (Reference Moiseyeva, Romanov, Nikiforov, Sevastyanova and Semyenova2003). This may be of great importance considering the flighty nature of these chickens, as the wedge-shape reduces friction between the breast and wind when flying. Average ED indicates an unequal distribution within the group of chickens possessing convex and wedge-shaped breast. Wedge-shaped breast can be one of the indicators for differentiating Bisaya and Jolo chickens from commercial lines/breeds.
The diversity index for body shapes was closer to average among the Bisaya–Cluster II (0.471) and Jolo (0.488) than that of Bisaya–Cluster I (0.366). It was also found that the ED of Bisaya–Cluster II (0.943) and Jolo (0.973) were nearly equal. These results indicate that occurrences and distributions of blocky and wedge body shapes were nearly equal. Body conformation can be attributed to accumulated types of genes in different body parts (Somes, Reference Somes and Crawford1990). It is possible that the majority with wedge-shaped breasts, which were found in the uplands came about by natural selection. Combinations of wedge-shaped breast and body may also have enhanced the flying ability of native chickens when threatened by danger.
Comb type, skeletal variants and liveweight
The findings on comb type showed that Bisaya–Cluster II (0.556) had slightly above average diversity than the Bisaya–Cluster I (0.484) and Jolo (0.456) chickens (Table 5). The observed ED was closer to unequally distributed which ranged from 0.206 to 0.217. These results indicate that single and pea combs were dominant among the native chickens in the region.
Results revealed that native chickens were homogenous for normal skeletal variants as revealed by its diversity indices (0.028–0.079) and ED (0.206–0.217).
As to live weight, results showed that the Bisaya–Cluster II and Jolo chickens had a wider range of live weight which reached more than three kilograms. Diversity analysis also revealed that these groups had a relatively higher diversity (0.666–0.690) than the Bisaya–Cluster I (0.568). However, a greater distribution of chickens was detected within the weight levels of 1.00–2.00 kg as supported by ED of 0.385–0.530. Those in Bisaya–Cluster I was within 1.00–1.50 kg. Somewhat higher numbers of Jolo chickens were in the weight level of 2.51–3.00 kg than of Bisaya–Cluster II but 1.53 percent of the latter had a live weight of more than 3.00 kg. The findings indicate that there is greater variation in Jolo chickens which can be exploited if a farmer aims to improve adult body weight. Jolo chickens are bigger than Bisaya chickens and some farmers may possibly have applied crossbreeding of these groups to produce the Bisaya–Cluster II with an improved body weight (Table 1).
Conclusions
Findings of this study revealed higher phenotypic diversity of native chicken genetic resources in Western Visayas, Philippines. This indicates the potential source of genetic materials for breeding purposes. The Bisaya–Cluster II and Jolo chickens can possibly be considered for breeding stock, if farmers and/or other interested parties opted to develop native chicken breeds with heavier slaughter weight. The native chickens belonging to the Bisaya–Cluster I also showed their capability in egg production. Since, native chickens in rural areas are free-range; appropriate conservation techniques must be studied to preserve some of the traits prominent to each genetic group for future use. Further studies of molecular analysis are encouraged to determine if there is gene flow between groups and as a basis in decision-making toward conservation and utilization of these genetic resources.
Acknowledgements
The author express his deepest gratitude to the Department of Science and Technology – Philippine Council for Agriculture, Forestry and Natural Resources Research and Development (DOST-PCARRD), Central Philippine University (CPU), and Commission on Higher Education (CHED) for the financial support in conducting this study. The support of Magsasaka at Siyentipiko para sa Pag-unlad ng Agrikultura (MASIPAG) and those of local government officials of the different sampling sites in Western Visayas, Philippines during the field visit and data collection are likewise acknowledged.
Statement of Interest
The author hereby declares that there is no conflict of interest involved in this study.
Supplementary material
Supplementary materials of this paper is available at http://journals.cambridge.org/agr