INTRODUCTION
Participatory varietal selection (PVS) is being increasingly used in crop improvement to allow farmers to test and identify varieties (e.g. Sperling and Scheideggers, Reference Sperling and Sceidegger1995; Virk et al., Reference Virk, Chakraborty, Ghosh, Prasad and Witcombe2005; Reference Virk, Chakraborty, Ghosh and Harris2006; Witcombe, Reference Witcombe1999). It increases farmers' awareness of new varieties and enables them to save and exchange the seed of those that they prefer (Grisley and Shamambo, Reference Grisley and Shamambo1993; Sperling and Loevinsohn, Reference Sperling and Loevinsohn1993; Witcombe et al., Reference Witcombe, Petre, Jones and Joshi1999). Following the terminology of Snapp (Reference Snapp1999), on-farm PVS trials can be of two types: mother trials (that include the full set of varieties) and baby trials (that include one or more varieties alongside the control). Many variations of the mother-baby trial design are used by researchers (Witcombe et al., Reference Witcombe, Joshi, Gyawali, Musa, Johansen, Virk and Sthapit2005).
On-farm variety trials have the advantage of testing varieties in the real environment where they will ultimately be grown. However, they are often unbalanced because of the failure of some trials grown under rainfed conditions in farmers' fields and because limited quantities of seed of new varieties dictate in what year and on what scale they enter into the trials. The statistical analysis of such unbalanced mother trials is more complex than for the more balanced data typical of on-station trials. However, analysis of data from paired-plot (new variety versus local control) baby trials only requires a paired t-test (Eskridge, Reference Eskridge, Kang and Gauch1996; Joshi and Witcombe, Reference Joshi and Witcombe1996). A combined analysis of either the mother or the baby trials that were conducted over several years, locations and farmers involves both fixed and random factors. Fixed effects are those where levels are determined or set by the experimenter, e.g. varieties and districts in our case. Random effects are where the levels of the effects are assumed to be randomly selected from an infinite population of possible levels, e.g. years. While linear fixed effect models are analysable by general linear modelling (GLM), mixed models are more efficiently handled by the residual (or restricted) maximum likelihood (REML) technique (Allan and Rowlands, Reference Allan and Rowlands2001; Littell et al., Reference Littell, Nilliken, Stroup and Wolfinger1996; Searle et al., Reference Searle, Casella and McCulloch1992). REML provides efficient estimates of treatment effects that have more than one source of error in a multilevel data structure, e.g. in on-farm trials there is information at the district, village and farm level. The analysis also allows multi-layered data information to be combined from multiple experiments conducted over time and space. Hence, REML is more appropriate than GLM for PVS trials that have complex-unbalanced strata of data in mixed models (Coe, Reference Coe, Mauricio and Reeves2002). Despite this, few researchers have used REML analysis for PVS trials (Coe, Reference Coe, Mauricio and Reeves2002; Omanya et al., Reference Omanya, Weltzein-Rattunde, Sogodogo, Sanogo, Hanssens, Guero and Zangre2007; Virk and Witcombe, Reference Virk and Witcombe2008).
Through PVS we offered new wheat varieties to farmers in Bangladesh over three years to identify alternatives to the widely grown but old variety, Kanchan (released in 1983). We examine the utility of the REML procedure in analysing these unbalanced trials using mixed models and compare these results with the extent of adoption of the new varieties by farmers.
MATERIALS AND METHODS
Experimental sites
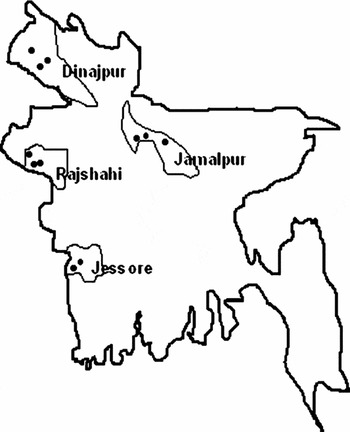
The experimental sites were in four diverse districts of Bangladesh: Dinajpur (25°38′N; 88°41′E, 38 m asl) and Rajshahi (24°22′N; 83°36′ E, 17 m asl) in the north west, Jessore (23°11′N; 89°14′E, 7 m asl) in the southwest and Jamalpur (24°56′N; 89°55′E, 19 m asl) in the north of the country (Figure 1). The on-farm experiments were conducted in three villages in each district: Daulatpur, Jogdal and Hatiari in Dinajpur district; Duary, Basantapur and Santoshpur in Rajshahi district; Valukghar, Jalalpur and Bandabila in Jessore district; Raier Bakai, Sthall and Norkona in Jamalpur district.
A sketch map of Bangladesh indicating the locations of the project districts and villages.

Dinajpur and Jamalpur districts are the major wheat-growing areas of Bangladesh. However, the soils (pH 4.5–5.5) in Dinajpur suffer from micro-nutrient deficiencies that cause spike sterility. High rainfall in Jamalpur causes sprouting of grains in the spike and farmers prefer early maturing varieties. The soils here have pH ranging from 5.0 to 6.5. Rajshahi represents the Barind zone with low rainfall, and alkaline soils of poor fertility. The soils in Jessore are calcareous brown flood plain type with a pH of 7.8.
Varieties for PVS
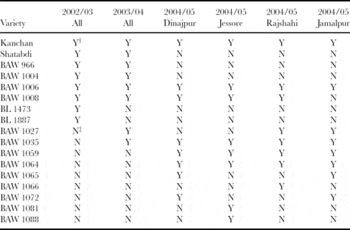
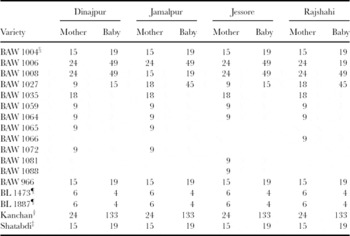
A total of 17 varieties were tested in the PVS trials. Although there were seven test entries and a control variety (Kanchan) each, these trials were highly unbalanced as varieties were dropped because of poor performance and new varieties were added as seed became available (Tables 1 and 2).
The wheat varieties tested in the mother and baby trials in each year in four districts in Bangladesh from 2002/03 to 2004/05.

†Y = variety tested.
‡N = not tested.
Total number of mother and baby trials conducted for each wheat variety in four districts across three years (2002/03 to 2004/05).

†Most grown farmers' control variety released in 1983.
‡Released in 2000.
§Rejected for its lodging susceptibility in 2003/04.
¶Rejected for poor performance in 2002/03.
Experimental design and evaluation
A mother and baby design was used in testing the varieties (Snapp, Reference Snapp1999; Witcombe, Reference Witcombe2002). Each mother trial always had eight entries in a single replicate of which one was always Kanchan as a control. In the first two years only, Shatabdi was also a control. The trials were replicated across farmers and each farmer was given a trial with different randomization. In 2002/03 the mother trial design was four districts × two villages × three farmers (24 replications); in 2003/04 and 2004/05 the mother trials were in four districts × three villages × two farmers (24 replications in each year). The farmers who were given the trials varied across the years.
The mother trials were conducted using farmers' management. The mother trials in farmers' fields were grown in 5 m × 4 m plots with row spacing of 20 cm and thick planting within rows. A seed rate of 120 kg ha−1 was used. One set of each mother trial was also conducted on research stations (at Dinajpur, Jamalpur, Rajshahi and Jessore) in a randomized complete block design with three replications. The on-station trials were fertilized with 100N:26P:33K:20S kg ha−1 and irrigated 2–3 times. Two-thirds of the N (urea) and all other fertilizers were applied as a basal dose and the remaining N was top dressed after the first irrigation.
Both on-station and on-farm mother trials were researcher designed and completely supervised by the researchers who also recorded all quantitative data. In addition to quantitative data, matrix ranking for several traits was done by farmers at physiological maturity and at the post-harvest stage. Each year, farmers scored the eight varieties in the mother trials on a 1 to 8 scale; 1 = lowest and 8 = highest score for grain yield, maturity, chapatti making quality and overall preference. The trials were evaluated by 30 farmers in each village at the pre- and post-harvest stages.
Baby trials corresponded to the two designs described by Witcombe (Reference Witcombe2002): in Design I, one new variety was grown alongside the control variety, and in Design II, two new varieties were grown side by side with a local control by a farmer under the farmer's management. In 2002/03, Design I trials were replicated across four districts × two villages and two farmers (16 replications) for each of seven new varieties with Kanchan as the control (total 112 trials and 224 individual plots). In 2003/04, Design II was replicated across four districts × three villages × one farmer (12 replications) for each of 15 all possible pairs of six new varieties with Kanchan as the control (total 180 trials and 540 invdividual plots). In 2004/05, Design I was replicated across four districts × three villages × 20 farmers (240 replications) for each of two pairs of varieties selected from the previous year's trials with Kanchan as the control (total 240 trials = 480 individual plots). The farmers who conducted the baby trials varied across years.
Baby trials were evaluated using household level questionnaires (HLQ) following Witcombe (Reference Witcombe2002). Yield data and plot size were recorded by researchers, and grain yield recorded as kg plot−1 was converted to t ha−1.
Assessment of adoption of varieties
Baseline information on varietal diversity was collected through participatory rural appraisal (PRA) tools in four villages in the four districts in August-September 2002. A multidisciplinary team of two agricultural economists, an agricultural engineer, an Agriculture Extension Officer, three agronomists, two breeders, a soil scientist and a plant pathologist, conducted the baseline PRA. Four discussion groups were conducted (one per village) that involved 25 farmers per group and included large, medium, small, marginal and tenant farmers. The PRA covered many topics but only the results for varietal diversity of wheat are presented here. Farmers were asked what were the popular varieties of wheat in their village and the proportion of wheat land that each variety covered.
The varietal adoption surveys were conducted in 2004/05 (three seasons after the start of the PVS) using HLQs to collect information on variety adoption. In each of the 12 villages where the mother trials were grown 30 farmers were interviewed; 10 were participating farmers who grew either a mother or a baby trial; 10 were farmers who did not grow a trial but who had participated in training or demonstrations by researchers; and 10 were new farmers who had had no previous interaction with the researchers. The only female farmers were eight out of the 30 farmers sampled in Dinajpur district
Statistical analysis
All statistical analyses for quantitative and qualitative traits excluded BAW 1004, BL 1473 and BL 1887 since these three varieties had already been rejected by farmers in the first two years.
Quantitative traits. There were a total of 768 farmer plots for analysis in the mother trials and 1244 in the baby trials. Two combined analyses of variance across three years and four districts were computed, one for the mother and one for the baby trials for grain yield, time to heading, 1000-grain weight and overall scores. The analysis of unbalanced data was performed for the mixed model using residual (or restricted) maximum likelihood (REML) analysis of GenStat 8. The REML algorithm estimates the variance components using residual maximum likelihood, and then uses these variance parameter estimates to form the generalised least squares estimates of the treatment effects and the best linear unbiased predictors (BLUPs) of the random effects along with their standard errors (DeLacy et al., Reference DeLacy, Basford, Cooper, Bull, McLaren, Cooper and Hammer1996; Piepho, Reference Piepho1994).
In our case, varieties were fixed effects because they could be repeated and were summarized by individual means and standard errors. Similarly, districts were treated as fixed effects since they represent zones and the interest was to compare mean values of districts widely placed in Bangladesh. In contrast, the influence of years on the measured traits in a trial is a random effect and the interest is to quantify the variability in a trait due to the year effect rather than comparing individual years. Similarly, farmers within villages represented a random sample of farmers from any village. Years or farmers within villages are considered to be a random sample from a normal distribution, so they are summarized as variance components and as predicted means (BLUPs).
The REML mixed model for all the traits measured in the mother and baby trials had two parts:
(i). Fixed model = Constant + Variety + District + Variety × District
(ii). Random model = Year + Farmer
Analysis of the mixed model with the REML procedure combines both parts (i) and (ii) of the model.
The major interest was to compare the varietal fixed effects and to determine the interaction of varieties with the fixed effects of districts so as to identify district- or zone-specific adaptation. Therefore, year × variety interactions were not estimated.
Average standard errors of the difference among variety means within a district were used to compute the least squares differences (Snedecor and Cochran, Reference Snedecor and Cochran1973).
Logistic regression analysis for qualitative traits. The logistic regression is useful for categorical response variables, unlike the continuous variables used in ordinary regression. Ordinal logistic regression can be used when there are three or more categories with natural ordering of levels. However, when there are only two classes of data that have a binomial distribution a binary logistic regression is used.
Data from baby trials were available for three qualitative perceptions (grain yield, maturity and chapatti making quality) from the HLQ evaluations. These data were recorded as ‘less’, ‘same’ and ‘more’ in comparison to the control (Kanchan). These classes of data equate to 1, 2 and 3 classes in that order for an ordinal regression analysis. For each variety the total counts in each class were used for the analysis. The means of the counts in each category were used as the reference points in the logistic regression and the analysis was computed for each district separately.
The output from logistic regression analysis provided coefficients of regression, standard errors, t-values and p-levels for testing their significance. The log odds ratio or the estimated coefficient of a factor measures the difference between the given level of a factor (i.e. ‘more’ or ‘less’ in our case) compared to the reference level (i.e. ‘same’ in our case) and is: (log odds of a variety ‘A’ being high versus low)/(log odds of the control being high versus low). The antilog of the log odds ratio (or coefficient of regression) gives the odds ratio which can be used to compare a new variety with the control directly as the odds ratio (r) of a variety will be ((r−1) × 100) times higher than the control. We computed the odds ratios for each variety for comparison with the control (Kanchan). Estimated regression coefficients of zero or an odds ratio of 1 both imply that the factor has no effect.
Binary logistic regression was used to analyse the two-category data on the intention of farmers to ‘grow’ (yes) or ‘not grow’ (no) any variety in the following year. These data were available for five varieties (BAW 1006, BAW 1008, BAW 1027, BAW 966 and Shatabdi) tested in 2002/03 to 2004/05. Counts of ‘yes’ and ‘no’ for the varieties in each district separately and pooled over all districts for all three years were used in the analysis.
Variety-on-variety regression for genotype × environment (G × E) interaction. A comparison of the overall mean yield of a new variety with the overall mean of a standard control can be misleading when there are substantial G × E interactions. In the more common regression analysis for G × E interactions individual variety means are regressed onto environmental indexes that use means of all of the varieties in the trials. However, in the present case, the interest centres on a comparison of the new variety with a standard control so a regression of the performance of the new variety on that of the standard control is more appropriate (Simmonds, Reference Simmonds1979). The standard variety mean values across trials provides an environmental index that is independent of the test variety (the commonly used mean of all of the varieties in the trial is not completely independent). These regressions were computed separately for the mother and the baby trials. The results for the two best varieties (from both the REML analysis and from adoption data) are presented.
RESULTS
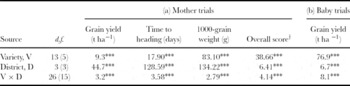
Combined REML analysis of variance of mother or baby trials revealed significant variation among varieties and districts for all traits (Table 3). There was also a significant variety × district interaction for all traits in mother trials and for grain yield in baby trials because of the differential response of varieties to the environments in the four districts.
Significance of the main effects and their interactions tested by chi-squared (Wald statistic/d.f.) values in the overall REML analysis for (a) the mother trials for four traits of the wheat varieties and (b) for the baby trials for the grain yield of the wheat varieties, 2002/03 to 2004/05.

***p < 0.001.
†Overall score by matrix scoring of eight varieties on 1 = lowest and 8 = highest scale.
The district mean grain yields of all varieties in mother (baby) trials were: 3.76 (2.52) t ha−1 for Jamalpur, 3.20 (3.10) t ha−1 for Rajshahi, 4.20 (3.17) t ha−1 for Dinajpur and 3.66 (3.31) t ha−1 for Jessore. Thus the mean grain yields in mother trials compared to the baby trials were 32% higher in Dinajpur, 49% in Jamalpur, 11% in Jessore and 3% in Rajshahi. The on-station mother trials received higher inputs than those on farmers' fields, which could have biased their overall mean yield upwards. However, the lower yields of the baby trials better represented the actual farmers' practices.
The variety mean grain yield ranks across districts were different due to a high level of variety × district interaction (Tables 3, 4). However, the identification of region-specific varieties is difficult because of the highly unbalanced structure of trials with varieties that showed significant interactions having been tested only in one year (BAW 1059 and BAW 1065) or tested only in two years (Shatabdi).
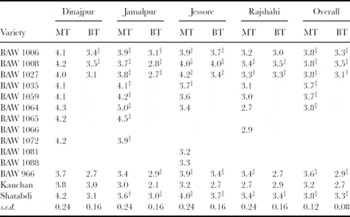
District-wise mean grain yield (t ha−1) of wheat varieties tested in mother (MT) and baby (BT) trials for three years (2002/03 to 2004/05). Blank cells indicate variety was not tested.

†Significantly superior to Kanchan at p < 0.05.
‡Significantly superior to Kanchan at p < 0.01.
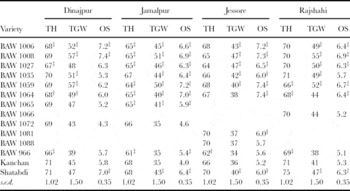
When performance in individual districts was considered, none of the varieties yielded significantly more than Kanchan in Dinajpur in mother trials, but BAW 1006 and BAW 1008 were superior in baby trials (Table 4). In Rajshahi, BAW 1006, BAW 1008 and Shatabdi significantly out-yielded Kanchan in both mother and baby trials, but BAW 966 did so in mother trials only (Table 4). In Jamalpur and Jessore, there were several varieties superior to Kanchan for grain yield in both mother and baby trials, e.g. BAW 1006, BAW 1008 and BAW 1027 (Table 4). These varieties also had bolder grains and higher overall preference scores than Kanchan and flowered at the same time (Table 5).
Mean values by district for time to heading (TH in days), thousand-grain weight (TGW in g) and overall score (OS on 1 to 8 scale) of wheat varieties tested in mother trials in four districts over three years (2003–2005).

†Significantly earlier to flower and with higher grain weight and overall preference than Kanchan at p < 0.05.
‡Significantly earlier to flower and with higher grain weight and overall preference than Kanchan at p < 0.01.
When performance across all districts was considered, all new varieties and Shatabdi were significantly superior to Kanchan for grain yield. Of the new varieties, BAW 1006 and BAW 1008 were the most promising for all districts; in mother and baby trials BAW 1006 was 19% and 22% higher yielding than Kanchan, and BAW 1008 was 19% and 30% higher yielding (Table 4). They also had higher overall scores and 1000-grain weight than Kanchan in all districts but significant to non-significant earlier flowering (two to three days earlier in Dinajpur and Jamalpur) in different districts (Table 5).
Ordinal logistic regression
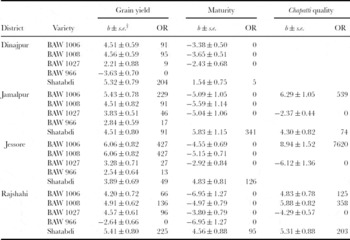
For grain yield, four new varieties (BAW 1006, BAW 1008, BAW 1027 and Shatabdi) were perceived by farmers to be superior to Kanchan in each of the four districts (Table 6). Of these all, apart from Shatabdi, were perceived to be earlier to mature. This differed from the quantitative yield data in both the mother and the baby trials where, for example, there were no significant differences between Kanchan and the new varieties in Dinajpur (Table 4). Farmers perceptions on chapatti making quality showed that BAW 1004 and BAW 1006 were consistently superior in three of the four districts while BAW 1027 was poor (Table 6).
Logistic regression coefficients and odds ratios (OR) for qualitative perceptions recorded in baby trials. Varieties with non-significant parameters are omitted. Blank cells show that estimates were non-significant. All regression coefficients (b) are relative to Kanchan control variety and only significantly positive (increases) estimates for grain yield and chapatti quality, and negative (decreases) for maturity are given.

†Regression coefficients (b) >1.96 times the standard error are significant at p < 0.05.
Overall, BAW 1006 and BAW 1008 were identified as superior varieties both by the REML analysis for quantitative traits and the logistic regression for qualitative perceptions in all districts.
Binary logistic regression
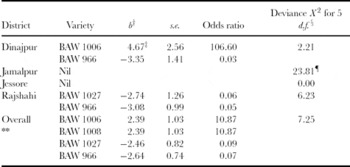
The binary regression model that tested the significance of whether farmers would grow a variety again varied for its goodness of fit in different districts (Table 7). In the overall analysis, BAW 1006 and BAW 1008 were the most preferred varieties with higher odds ratios, as farmers wanted to grow them again (Table 7). Of these two, only BAW 1006 was significantly preferred in a within-district analysis (Table 7).
Parameters of binary logistic regression (only given for the significant regressions (b)) and odds ratios for varieties for the ‘Yes’ or ‘No’ counts of farmers' replies in baby trials in 2003, 2004, 2005 if they would grow a variety next year.

†Regression coefficients (b) >1.96 times s.e. are significant at p < 0.05.
‡Probability of significance < 0.10.
§Deviance when significant would reject H0 hypothesis of an adequate fit of a model.
¶Significant at p < 0.01.
Variety-on-variety regression
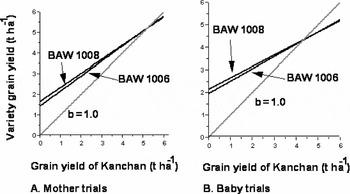
In both mother and baby trials BAW 1006 and BAW 1008 had significant regression slopes < 1.0 and intercept > 0 in comparison to Kanchan. Hence they performed better in the low-yielding environments than Kanchan, and may have specific adaptation to the lower-yielding fields cultivated by more resource-poor farmers.
On-farm diversity
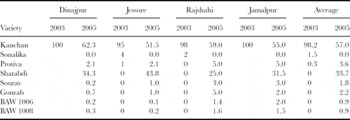
Baseline PRAs in 2002/03, in the four study districts, revealed that Kanchan (an old variety) was being cultivated on 95–100% of wheat area. The areas under other improved varieties such as Protiva, Gaurab and Sourab were negligible (less than 1% for each). Sonalika (a very old variety) was grown on very small areas in Jessore and Rajshahi (less than 5%). Farmers were thus practicing a near varietal monoculture that gave a high risk of disease epidemics.
In a short period of three years (2002/03 to 2004/05) the area of Kanchan decreased significantly in each of the four districts with an overall decline from 98% to 57% of the area (Table 8). Among the new varieties that replaced Kanchan, the released variety Shatabdi was the most adopted because seed was relatively easily available. The new PVS varieties BAW 1006 and BAW 1008 had started to spread and the area of each was comparable to the released varieties Protiva, Gourab and Sourav (Table 8).
Trends in adoption of new wheat varieties (% of total wheat area) in the PVS villages in 2004/05 compared to 2002/03 in four districts, Bangladesh.

DISCUSSION
REML analysis of on-farm trials
In the PVS trials farmers were given a choice of both released and unreleased varieties (Witcombe et al., Reference Witcombe, Joshi, Joshi and Sthapit1996) that were tested in mother and baby trials. As is often the case for on-farm trials, unlike on-station trials, they were highly unbalanced (Table 1).
The REML procedure uses the full set of data with missing cells for varieties and computes predicted means for each entry adjusted for the site and year effects. The adjustments allow for the fact that some farmers obtain higher average yields than others. Entries that are tested on ‘good’ farms will have their means biased upwards compared with those tested on ‘poor’ farms. The predicted means adjust for these biases and should be used instead of raw means (Coe, Reference Coe, Mauricio and Reeves2002). The REML analysis removes the limitation of comparing a control and a new variety grown together and allows a combined analysis of the baby trials across all entries with a variable number of farmers and makes it possible to compare varieties among themselves and with the control variety.
REML analysis and other analyses
The results of REML analysis were confirmed by the logistic regression analysis on the perception data, where varieties BAW 1006 and BAW 1008 were preferred by farmers for grain yield, as well as maturity and chapatti making quality. Hence, quantitative yield data could be replaced with more easily recorded farmers' scores or perceptions of varieties. Virk and Witcombe (Reference Virk and Witcombe2008) also found that actual yields and perception scores for yields identified the same varieties. The overall binary regression analysis also confirmed their acceptability as significantly more farmers said they would grow them next year compared with those who would not.
However, when these two analyses (REML for quantitative data and logistic regression for perceptions) were compared by district perception data showed more significant differences. For example, although there were no significant differences between varieties for grain yield in Dinajpur in both the mother and baby trials (Table 4) several varieties differed significantly from Kanchan for yield perceptions and included two of the best varieties overall, BAW 1006 and BAW 1008 (Table 6). This additional sensitivity of perception data is an advantage of participatory trials since over-sensitivity can be ruled out by validation with adoption intentions (binary regression) (Table 7) and actual adoption data (Table 8).
The resource-poor farmers of Bangladesh require varieties with specific adaptation to low fertility soils. The variety-on-variety analysis for genotype × environment interaction showed that the two promising new varieties (BAW 1006 and BAW 1008) were significantly less responsive in the high-yielding environments but were higher yielding in the low-yielding environments than Kanchan, and hence were more adapted to the marginal environments (Figure 2). These two varieties were released in Bangladesh in 2005; BAW 1006 as BARI Gom 23 or Bijoy; and BAW 1008 as BAR Gom 24 or Prodip).
Regression of two varieties on to Kanchan in mother and baby trials conducted in four districts of Bangladesh, 2003 to 2005. The regression equations for the mother trials were: BAW 1006 = 1.4 ± 0.3 + 0.7 x ± 0.1x; BAW 1008 = 1.7 ± 0.3 + 0.7x ± 0.1. The regression equations for the baby trials were: BAW 1006 = 2.0 ± 0.2 + 0.5x± 0.1; BAW 1008 = 2.2 ± 0.2 + 0.5x ± 0.1.

REML analysis and adoption of varieties
Any analysis of on-farm trials is powerful enough if it can identify varieties that are preferred and adopted by farmers. We applied this criterion to the REML analysis and studied the adoption patterns of the identified varieties.
The adoption of REML-identified new varieties increased the replacement rate of the old variety Kanchan as its area fell significantly from 98 to 57% of the total wheat area. Varieties BAW 1006 and BAW 1008 each occupied about 1% of the area of wheat even before their release in 2005. In 2004/05, participating farmers of the four project districts saved 5 and 6 tonnes of seed of the two new varieties BAW 1006 and BAW 1008, and farmer-to-farmer seed spread had already begun (Ortiz-Ferrara et al., Reference Ortiz-Ferrara, Chand, Bhatta, Mudwari, Thapa, Sufian, Saikia, Chatrath, Witcombe, Virk and Sharma2007).
We have demonstrated that the REML analysis removes the two major problems of analysing the data from on-farm trials, i.e. mixed modelling of factors and non-orthogonality of the data. The use of REML will help to exploit fully the power of PVS trials in which varieties are tested widely over many more locations, though with irregularities, than conventional on-farm testing and where the multilayered data have mixed effect factors. Our results from the REML analysis were confirmed by other analyses and from the rapid adoption of the REML identified varieties by farmers. Using these analyses we found that at least two varieties were most promising and preferred by farmers, and these were later released in Bangladesh. The newly identified varieties have specific adaptation to the lower-yielding environments of the fields of resource-poor farmers. A wider application of REML analysis will remove bottlenecks in handling PVS trial data and encourage the adoption and institutionalization of the PVS process.
Acknowledgements
This paper is an output from a project funded by the UK Department for International Development (DFID) and administered by CIMMYT Nepal and CAZS-Natural Resources for the benefit of developing countries in South Asia. The views expressed are not necessarily those of DFID. The authors gratefully acknowledge Dr D. Harris of CAZS-NR for his suggestions and all those farmers of Bangladesh who participated.