
1. Introduction
1.1. Background
Vortex shedding in the wake of a circular cylinder has been studied extensively due to its importance in engineering. Consequently, many studies have been devoted to the transition from a two-dimensional (2-D) to a three-dimensional (3-D) wake (Williamson Reference Williamson1988b, Reference Williamson1996; Zhang et al. Reference Zhang, Fey, Noack, König and Eckelmann1995; Jiang et al. Reference Jiang, Cheng, Draper, An and Tong2016; Rao, Thompson & Hourigan Reference Rao, Thompson and Hourigan2016; Jiang, Cheng & An Reference Jiang, Cheng and An2018). Vortex shedding occurs when the Reynolds number (Re) exceeds 46, and the transition of the wake from two-dimensional to three-dimensional occurs as the Reynolds number exceeds a critical value between 140 and 190 in experimental studies. The Reynolds number is defined as Re = UD/ν, where U, D and ν are the free-stream velocity, the diameter of the cylinder and the kinematic viscosity of the fluid, respectively. Through the use of the end suction technique to minimise the end effects, Miller & Williamson (Reference Magnaudet, Fabre and RiveroReference Miller and Williamson1994) reported that 2-D laminar vortex shedding exists up to a Reynolds number of 205. The critical Reynolds numbers for 3-D wake transition obtained using linear stability analysis and direct numerical simulations range from 190 to 200 (Thompson, Hourigan & Sheridan Reference Thompson, Hourigan and Sheridan1996; Henderson Reference Henderson1997; Rao et al. Reference Rao, Thompson, Leweke and Hourigan2013b; Jiang et al. Reference Jiang, Cheng, Draper, An and Tong2016).
With the increase of the Reynolds number, the wake develops through mode A and B wake structures. The flow transition starts from mode A with deformed primary vortices whose wavelengths measure approximately 3–4 diameters (Williamson Reference Williamson1996; Leweke & Williamson Reference Leweke and Williamson1998). The primary vortex deformation in mode A results in vortex loops and streamwise vortex pairs. Mode A is unstable due to the dislocation of vortices. Zhang et al. (Reference Zhang, Fey, Noack, König and Eckelmann1995) reported that, in a mode A wake, vortex dislocation causes so-called ‘vortex adhesion’ to the cylinder surface at vortex dislocation positions. The vortex dislocation in mode A causes a reduction in the vortex shedding frequency. When the Reynolds number is between 230 and 260, the wake is in mode B, which is characterised by finger-shaped streamwise vortices (Williamson Reference Williamson1988b, Henderson Reference Henderson1997). The wavelength of the spanwise 3-D feature of the mode B wake is approximately one diameter (Williamson Reference Williamson1996). Vortex dislocation of the mode A wake causes variation in the vortex shedding phase along the cylinder and further affects spanwise integrated fluid forces (Williamson Reference Williamson1996).
Vortex dislocation is a natural phenomenon in a mode A wake but can also be generated in the 2-D laminar flow regime through the introduction of an artificial disturbance. Vortex dislocation due to end effects causes wake transition from two-dimensional to three-dimensional at a lower Reynolds (Miller & Williamson Reference Miller and Williamson1994) and changes the vortex shedding frequency through the inclination of vortices (Williamson Reference Williamson1988a). Williamson (Reference Williamson1992) produced artificial vortex dislocation at  $Re = 120$ using a ring with a slightly larger diameter than the cylinder, and found a strong similarity between the artificially produced dislocation and the natural dislocation within the transition flow regime. When flow passes a step cylinder (a cylinder whose diameter changes suddenly at its middle point) or a tapered cylinder, the difference between the vortex shedding frequencies on two sides of the step causes vortex dislocation (Parnaudeau et al. Reference Parnaudeau, Heitz, Lamballais and Silvestrini2007; Morton & Yarusevych Reference Morton and Yarusevych2010; Ji et al. Reference Ji, Yang, Yu, Cui and Srinil2020).
The interference between vortex shedding from two parallel cylinders has been investigated extensively. Studies on flow past two tandem cylinders are focused on the effects of the gap between the two cylinders on the vortex shedding flow (Sumner Reference Sumner2010). When two cylinders are in a tandem arrangement in a fluid flow, vortex shedding occurs only from the downstream cylinder if the gap is small, or from both cylinders if the gap is greater than a critical value (Carmo, Meneghini & Sherwin Reference BlackburnReference Carmo, Meneghini and Sherwin2010a,Reference Carmo, Meneghini and Sherwinb; Tong, Cheng & Zhao Reference TomboulidesReference Tong, Cheng and Zhao2015). If vortex shedding only occurs behind the downstream cylinder, the flow transition to three-dimensional is delayed in comparison to that of a single cylinder (Papaioannou et al. Reference Papaioannou, Yue, Triantafyllou and Karniadakis2006).
Due to the geometric simplicity and symmetry of spheres, they are the most studied objects for investigating fundamental mechanisms of the interaction between flow and 3-D objects. Flow past a sphere is axisymmetric for  $Re$ below 200, transitions to steady, non-axisymmetric flow when
 $Re$ is between 210 and 270 and becomes dynamic when the Reynolds number is greater than 270 (Johnson & Patel Reference Johnson and Patel1999). When the Reynolds number is greater than 270, hairpin vortices are shed from the sphere (Ormières & Provansal Reference Ormières and Provansal1999). The numerical study by Mittal (Reference Mittal1999) found planar symmetry in the unsteady wake of a sphere with respect to a plane passing through the sphere axis in the streamwise direction for Reynolds numbers up to 350. Most numerical studies on flow past spheres have been focused on the highly organised, periodic vortex shedding at Reynolds numbers less than 400 (Poon et al. Reference Poon, Ooi, Giacobello and Cohen2010; Behara, Borazjani & Sotiropoulos Reference Behara, Borazjani and Sotiropoulos2011; Rajamuni, Thompson & Hourigan Reference Rajamuni, Thompson and Hourigan2018, Reference Rajamuni, Thompson and Hourigan2019).
1.2. Rational and scope
So far, there has been little attention paid to the interaction between a circular cylinder and a sphere in fluid flow. Studies of sphere–cylinder interactions in a fluid flow provide a fundamental understanding of fluid forces on a 3-D object (sphere) that are caused by vortex shedding. In this study, flow past a circular cylinder and a downstream sphere with the same diameter is investigated numerically for Reynolds numbers between 100 and 300, which are in laminar and 2- to 3-D wake transition regimes (Sumer & Fredsøe Reference Sumer and Fredsøe2006). The main aims of this study are: (i) an investigation into the influence of the gap between the cylinder and the sphere on vortex shedding from the cylinder and the dislocation of vortices – the typical wake characteristic in the 2- to 3-D wake transition regime and (ii) to quantify the frequency and magnitude of the forces on the downstream sphere caused by vortex shedding from the upstream cylinder. To achieve the above aims, simulations are conducted for cylinder–sphere gaps between 0 and 3 diameters.
2. Numerical method and its validation
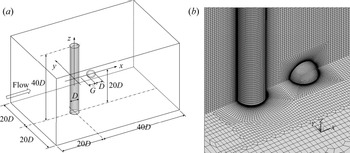
Figure 1(a) shows a sketch of the computational domain for simulating flow past a circular cylinder with a downstream sphere. The length of the cylinder is 40D and the gap between the cylinder and the sphere is  $\tilde{G}$. A Cartesian coordinate system is defined with its x- and z-directions following the flow direction and the spanwise direction of the cylinder, respectively, and the origin is located at the centre of the cylinder. The computational domain sizes for simulating the cylinder–sphere system in the x-, y- and z-directions are 60D, 40D and 40D, respectively, and the cylinder centre is located 20D downstream of the inlet boundary. The computational domain size used in this study is much larger than the required domain size for flow past a cylinder reported in previous studies. Tezduyar & Shih (Reference Tezduyar and Shih1991) reported that the wake, the Strouhal number and the force coefficients can be well predicted if the outlet boundary is 14.5D downstream a cylinder at
 $Re = 100$. The minimum distance between the outlet boundary and the cylinder for achieving accurate results reduces as
 $Re$ increases (Sohankar, Norberg & Davidson Reference Sohankar, Norberg and Davidson1998). In addition, the distance between the two lateral boundaries and the cylinder must be at least 8D (Behr et al. Reference Behr, Hastreiter, Mittal and Tezduyar1995).
(a) A sketch of flow past a cylinder and a downstream sphere. (b) Computational mesh near the cylinder and sphere for G = 1 (only one quarter of the mesh on the wall surfaces and two planes are shown).

The fluid flow is simulated by solving the 3-D incompressible Navier–Stokes (NS) equations. The length (xi), the gap (G), the velocity (ui), the time (t) and the pressure (p) are non-dimensionalised as  ${x_i} = {\tilde{x}_i}/D$,
 $G = \tilde{G}/D$,
 ${u_i} = {\tilde{u}_i}/U$,
 $t = \tilde{t}U/D$ and
 $p = \tilde{p}/({U^2})$, respectively, where U is the incoming flow velocity, the variables with and without a tilde represent the dimensional and non-dimensional variables, respectively, (x 1, x 2, x 3) represent (x, y, z) and ui is the fluid velocity in the xi-direction. The non-dimensional NS equations are
 \begin{gather}\frac{{\partial {u_i}}}{{\partial {x_i}}} = 0,\end{gather}
 \begin{gather}\frac{{\partial {u_i}}}{{\partial t}} + {u_j}\frac{{\partial {u_i}}}{{\partial {x_j}}} ={-} \frac{{\partial p}}{{\partial {x_i}}} + \frac{1}{{Re}}\frac{{{\partial ^2}{u_i}}}{{\partial {x_j}\partial {x_j}}},\end{gather}
where  $Re = UD/\nu $ is the Reynolds number and ν is the kinematic viscosity of the fluid. The NS equations are solved by the Petrov–Galerkin finite element method developed by Zhao, Cheng & Zhou (Reference Zhao, Cheng and Zhou2009) with boundary conditions specified below. On the inlet boundary, the velocity is uniform and the pressure gradient in the streamwise direction is zero. On the outflow boundary, the pressure is zero and the velocity gradient in the x-direction is zero (Papaioannou et al. Reference Papaioannou, Yue, Triantafyllou and Karniadakis2006; Rajamuni et al. Reference Rajamuni, Thompson and Hourigan2018). No-slip boundary conditions are employed on the surfaces of the cylinder and the sphere. On the four side boundaries, the symmetric boundary condition is used, i.e. the velocity component is perpendicular to the boundary, and the gradients of the other velocity components, along with pressure in the perpendicular direction to the boundary, are zero.
The finite element method subdivides a large system into smaller, simpler elements that are called finite elements. Eight-node linear hexahedral finite elements are used in this study and the total element number ranges from 7.8 million for G = 0 to 9.1 million for G = 3. The numbers of elements on the surfaces of the cylinder and sphere are 48 000 and 3456, respectively. Figure 1(b) shows the computational mesh on the surfaces of cylinder and sphere and two symmetric planes. The numbers of elements along the circumferences of the cylinder and the sphere are both 96. The non-dimensional mesh size in the radial direction on the wall surfaces is 0.002, resulting in a maximum wall unit y + less than 0.5 for  $Re = 300$. The wall y + is defined as
 ${y^ + } = {u_f}\Delta r/\nu $, where uf and r are the friction velocity and the size of the first layer elements from the wall in the radial direction, respectively.
Zhao et al. (Reference Zhao, Thapa, Cheng and Zhou2013) conducted a detailed validation of the present numerical model for simulating flow past a cylinder for  $Re = 100$ to 500. Thapa et al. (Reference Thapa, Zhao, Cheng and Zhou2015) successfully predicted biased gap flow past two side-by-side cylinders for
 $Re = 500$ using the present numerical model. Their numerical results correlated well with the experimental data by Alam et al. (Reference Alam, Moriya, Takai and Sakamoto2003). The validation of the present numerical model in the simulation of flow past an isolated sphere is shown in appendix A. Mesh dependency and domain size dependency studies are conducted in appendix B to demonstrate that the mesh has been sufficiently dense.
3. Results of flow past a cylinder with a downstream sphere
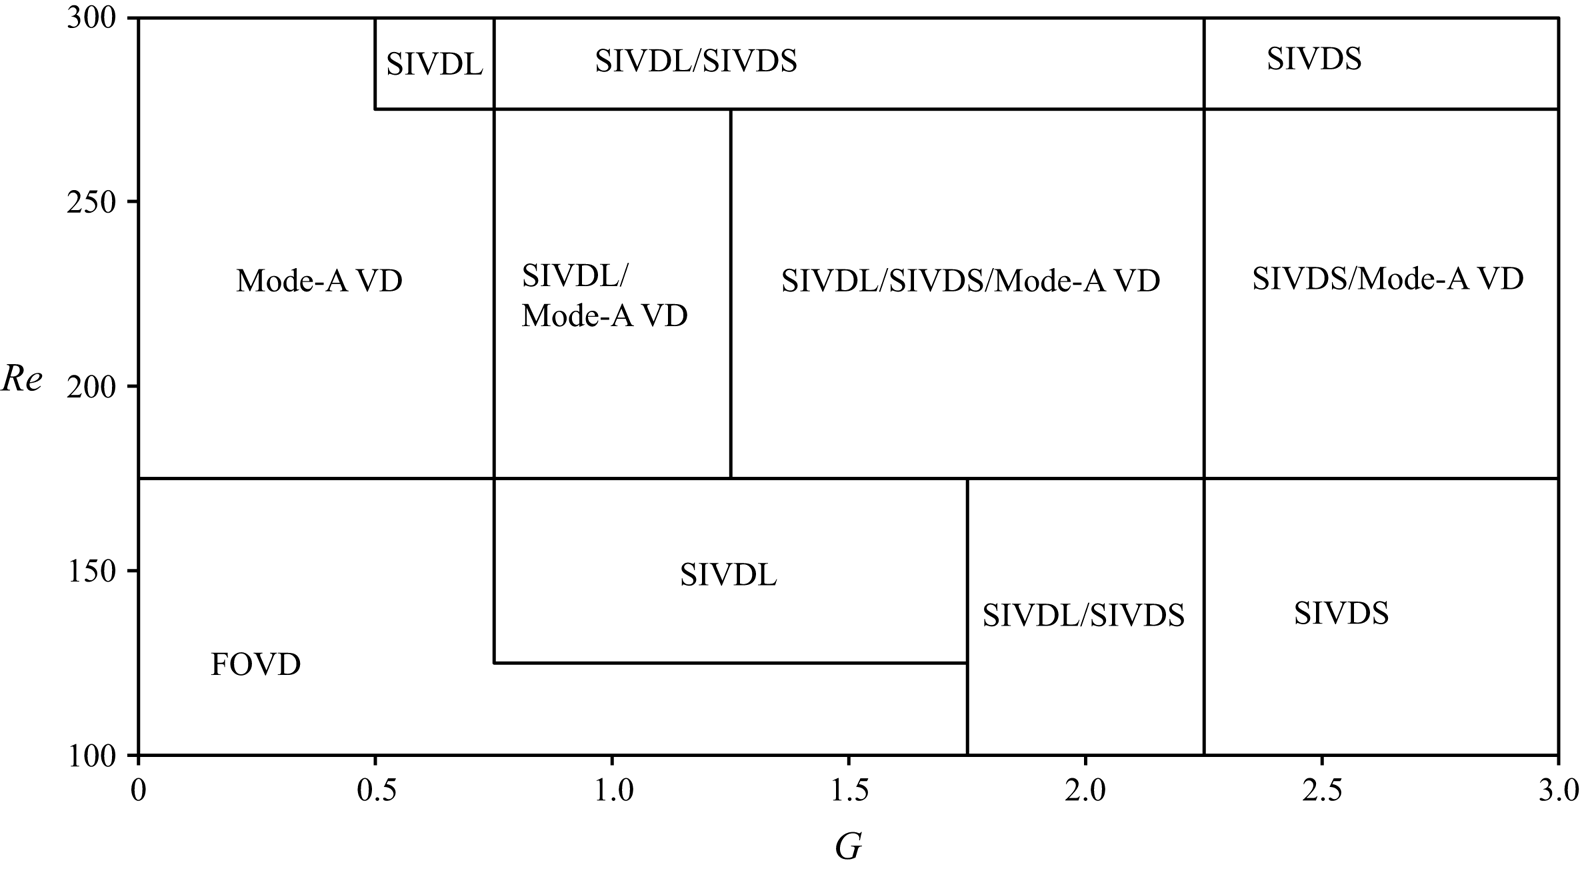
The sphere is found to affect the vortices generated from the cylinder in two ways. If the non-dimensional gap between the sphere and the cylinder (G) is large enough, vortices are shed from the cylinder and become disconnected after they pass the sphere. This phenomenon is called sphere-induced vortex disconnection (SIVDC). SIVDC occurs immediately behind the sphere and has little effect on the formation of the vortices in the wake. When G is in the regime of sphere-induced vortex dislocation (SIVDL), the sphere causes vortex dislocation within the vortex formation region along the cylinder span. Consequently, when SIVDL occurs, the sphere affects the formation of vortices and vortex shedding. Flow passing an isolated cylinder at  $Re = 200$ and 250 is in mode A, where vortex dislocation occurs. This type of vortex dislocation in mode-A wake is defined as mode-A-VD. For a cylinder–sphere system, mode-A-VD can coexist with SIVDC or SIVDL at
 $Re = 200$ and 250. Here, the wake pattern is dependent on the cylinder-to-sphere gap and the Reynolds number. Figure 2 maps the identified vortex dislocations on the G--
 $Re$ plane. In § 3.1, the formation mechanisms of the two types of SIVDC/SIVDL will be discussed in detail with a focus on SIVDL. A discussion of the effects of vortex shedding on the fluid force on the cylinder and the sphere will be given in §§ 3.2 and 3.3, respectively.
Mapping of the vortex dislocation/disconnection on the  $G\text{--}Re$ plane.

3.1. Effects of the sphere on the vortex shedding flow
The minimum simulated non-dimensional time is 500 for all cases. The flows at  $Re = 100$ and 150 are first discussed in order to clearly identify the influence of the sphere on the vortex shedding flow without the influence of strong streamwise vortices. The vortices are visualised using the iso-surfaces of the second eigenvalue (
 ${\lambda _2}$) of the symmetric tensor
 ${\boldsymbol{S}^2} + {\boldsymbol{\varOmega }^2}$, where
 $\boldsymbol{S}$ and
 $\boldsymbol{\varOmega }$ are the symmetric and antisymmetric parts of the velocity gradient tensor (
 $({\bf \nabla }\boldsymbol{u})$), respectively (Jeong & Hussain Reference Jeong and Hussain1995). The matrices
 $\boldsymbol{S}$ and
 $\boldsymbol{\varOmega }$ are defined as
 ${S_{ij}} = {\textstyle{1 \over 2}}({u_{i,j}} + {u_{j,i}})$ and
 ${\Omega _{ij}} = {\textstyle{1 \over 2}}({u_{i,j}} - {u_{j,i}})$, respectively. In figure 3, the wakes for
 $Re = 100$ and various gaps at t = 500 are represented by iso-surfaces of
 ${\lambda _2} ={-} 0.2$ and contours of spanwise vorticity (
 ${\omega _z}$) at a time when the sectional lift coefficient of the cylinder at z = 0 is at its maximum value. The sectional lift force (FLs) in the y-direction per unit length on a spanwise location z is calculated by integrating the pressure and shear stress over the circumference at z, and the sectional lift coefficient (CLs) is then defined as
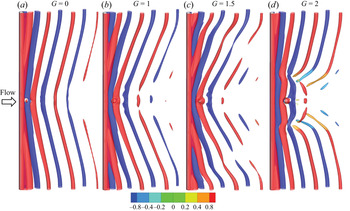
 ${C_{Ls}} = {F_{Ls}}/(\rho D{U^2})$. Primary vortices in the wake of the cylinder are inclined and their inclination angle is largest at G = 1.5. The inclination of vortices occurs as a result of disturbances to the wake e.g. end conditions (Williamson Reference Williamson1988a), a ring around the cylinder surface (Williamson Reference Williamson1992) and step change of cylinder diameter (Dunn & Tavoularis Reference Dunn and Tavoularis2006). For G = 0, 0.5, 1 and 1.5, vortices behind the sphere are not disconnected, while for G = 2 to 3, vortices are disconnected after they pass the sphere. After being disconnected, the vortices on the two sides of the disconnection point have the same pattern, and the wake is symmetric about x--y-plane. The vortex disconnection after vortices pass the sphere is defined as SIVDC.
Iso-surface of  ${\lambda _2} ={-} 0.2$ and contours of spanwise vorticity ωz at the time of maximum sectional lift coefficient at z = 0 for
 $Re = 100$.

When flow passes through two parallel tandem cylinders with a very small gap between them, the wake is in the ‘symmetric in the gap’ (SG) regime (Carmo et al. Reference Carmo, Meneghini and Sherwin2010b; Rao et al. Reference Rao, Thompson, Leweke and Hourigan2013a), where the two cylinders behave as a single body and vortices are shed only from the downstream cylinder (Zdravkovich Reference Zdravkovich1987). The motion of the vortices between the sphere and the cylinder is also affected by the gap. It can be seen from figure 3(a) that the sphere is near the centre of a negative vortex. After half of a vortex shedding period, the sphere is surrounded by a positive shear layer. For G = 0, the sphere does not cause any vortex disconnection behind the sphere. The wake at G = 0 is defined as a free of vortex disconnection/dislocation (FOVD) regime, because the sphere does not cause vortex dislocation or disconnection. A downstream sphere at a small distance from the cylinder only affects the formation of the vortices but not the generation of the shear layer from the surface of the cylinder, as a result, it does not cause vortex dislocation.
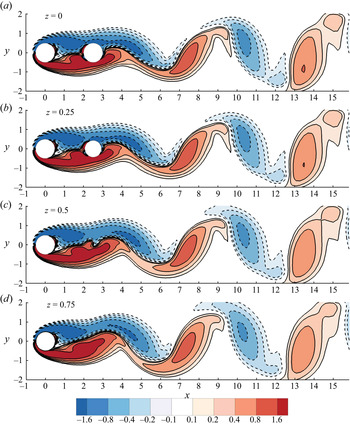
At G = 1.5, the two separated shear layers in the gap presented on the x--y-plane in figure 4 are similar to the two shear layers in the gap between two tandem cylinders within the alternate gap flow (AG) regime (Carmo et al. Reference Carmo, Meneghini and Sherwin2010a). In the FOVD regime, the vortices immediately above and below the sphere combine with the vortices generated from the sphere, as illustrated in figure 3(a–c). As a result, vortex dislocation was not observed behind the sphere. This can be further illustrated through the contours of vorticity in the z-direction (ωz) on the planes of  $z = 0$, 0.25, 0.5 and 0.75 shown in figure 4. The weak variation of the positions and strength of vortices at different z-locations in figure 4 is an indication that the vortices are not dislocated by the sphere. In figure 4, the free-of-dislocation vortices can be further explained by the reattachment of separated shear layers to the sphere that enables the formation of vortices behind the sphere. Vortex dislocation does not exist near z = 0 because the sphere does not affect the separation of shear layers from the cylinder and due to the reattachment of shear layers to the sphere, the shear layers retain their strength for forming vortices. The case G = 1.5 is the boundary between FOVD and SIVDC. SIVDC occurs after vortices pass the sphere at G = 2 to 3, where vortex shedding happens in front of the sphere. If vortex shedding occurs in front of the sphere, the shear layers generated from the sphere surface are too weak to form strong vortices, as a result, SIVDC occurs at z = 0. Once SIVDC occurs, streamwise vortices form behind the SIVDC position under the similar mechanisms as streamwise vortices in mode A wakes (Williamson Reference Williamson1992, Reference Williamson1996). SIVDC is accompanied by the formation of streamwise vortices.
Contours of vorticity in the z-direction on z = 0, 0.25, 0.5 and 0.75 planes at t = 500 for  $Re = 100$ and G = 1.5 at maximum sectional lift coefficient.

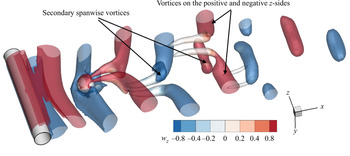
To clearly view SIVDC, figure 5 demonstrates the wake generated from the central part of the cylinder span for  $(Re,G) = (150,\; 2.5)$. After vortices pass the sphere, they are separated into two parts, and streamwise vortices form at the vortex disconnection positions. Behind the sphere, the streamwise vortices weaken during the progression downstream, and secondary spanwise vortices are generated near z = 0, which are out of phase with the vortices on the negative and positive z parts. The vortices are not the same as the interlocking, Ω-shaped hairpin vortices in the wake of an isolated sphere (Giacobello, Ooi & Balachandar Reference Giacobello, Ooi and Balachandar2009; Poon et al. Reference Poon, Ooi, Giacobello and Cohen2010).
SIVDC represented by the iso-surfaces of  ${\lambda _2} ={-} 0.2$ with the contour of
 ${\omega _z}$ for
 $(Re,G) = (150,\; 2.5)$.

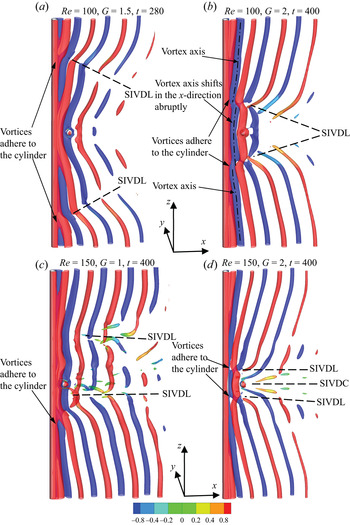
Figure 6 illustrates the new form of vortex dislocation that occurs within the vortex formation region for  $Re = 100$ and 150 using iso-surfaces of λ 2 and contours of spanwise vorticity. Chopra & Mittal (Reference Chopra and Mittal2019) found that the non-dimensional length of the vortex formation region for Re = 100 and 150 is between 2 and 2.5 (estimated from figure 9 of the reference). SIVDL is found at G = 2 for Re = 100 and G = 1 and 1.5 for Re = 150. Immediately behind the cylinder, vortices are dislocated at two locations; the positive and negative z sides, respectively in figure 6(a,b,d). The vortex dislocation weakens the spanwise vortices and, consequently, the sectional lift coefficient reduces locally. It is interesting that vortex dislocations occur at positive and negative z sides of the sphere instead of the actual location of the sphere. In figure 6(c), the distance of the vortex dislocation from z = 0 on the positive z side of the cylinder is greater than that of the negative z side. This is different from the vortex dislocation triggered by a ring or a step, which occurs where the ring or the step is located. In addition, SIVDL in the vortex formation region does not occur when the distance between the cylinder and the sphere is either very small or very large. In this study, the vortex dislocation generated within the vortex formation region at the positive and negative z sides of the sphere is named SIVDL.
Wake represented by iso-surface of λ 2 = −0.2 and contours of ωz for  $Re = 100$ and 150.

It can be seen in figure 6 that, at the positions where SIVDL occurs, the inclination angle of vortices changes dramatically. If SIVDL occurs, the vortices beyond the SIVDL position in the spanwise direction are more inclined. At  $(Re,G) = (150,1)$, SIVDL occurs asymmetrically, resulting in an asymmetric distribution of the sectional lift coefficient along the cylinder. In figure 6(c), SIVDL on the negative z part of the cylinder span is stronger because it causes a larger phase jump between two sides of the position of SIVDL. In figure 6(a–c), vortices immediately behind the central part of the cylinder do not have any dislocations. However, in figure 6(d), vortices near the cylinder centre are disconnected by the sphere, resulting in the coexistence of SIVDC and SIVDL. It can be seen in figure 6 that SIVDL divides each vortex into three continuous parts: two side parts and a central part. If SIVDC coexists with SIVDL, the central part is further broken down by SIVDC as shown in figure 6(d). The adhesion of the vortices to the cylinder surface at dislocation locations in figure 6 is the same as that reported by Zhang et al. (Reference Zhang, Fey, Noack, König and Eckelmann1995).
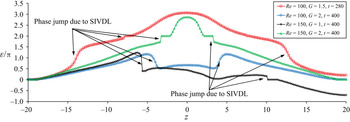
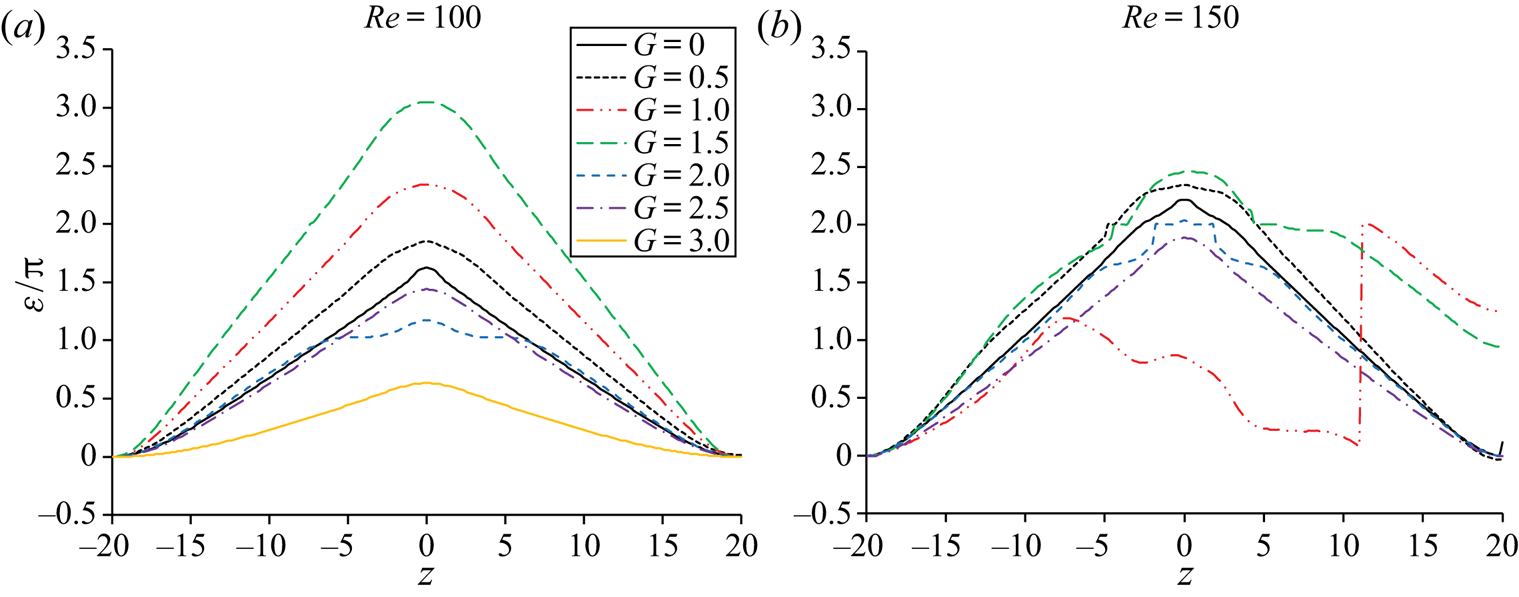
The inclination of the vortices causes variations in the phase of vortex shedding along the cylinder span. The phase jump of vortex shedding caused by dislocation can be backed by the abrupt shift of the vortex axis in the x-direction illustrated in figure 6(b). To quantify the phase change of the lift coefficient caused by SIVDL, the phase angles of the lift coefficient (defined as ε) along the z-direction are calculated, and the corresponding results to cases in figure 6 are presented in figure 7. The phase angle at a time t is calculated using recorded sectional lift coefficients within two periods of time from t − T to t + T. The lift coefficient at the end of  $z ={-} 20$ is used as the reference when the phase angle is calculated. To calculate the phase difference between two oscillatory lift coefficients CL 1(t) and CL 2(t), the cross-correlation coefficient between them is calculated using n periods of data by
 \begin{equation}{C_{12}}(\tau ) = \frac{1}{{nT}}\int_0^{nT} {[{C_{L1}}(t) - {{\bar{C}}_{L1}}] \cdot [{C_{L2}}(t + \tau ) - {{\bar{C}}_{L2}}]\,\textrm{d}t/({{C^{\prime}}_{L1}}/{{C^{\prime}}_{L2}})} ,\end{equation}
where T is the oscillation period of the lift coefficient and τ is the time lag. The value of  ${C_{12}}(\tau )$ oscillates with a period the same as T, and the time lag which corresponds to the maximum value of the correlation coefficient
 ${C_{12,max}}$ (defined as τm) can be converted to the phase difference by
 $\varepsilon = 2\mathrm{\pi }{\tau _m}/T$ in radians. In figure 10, the phase varies along the cylinder span mainly due to the inclination of the vortices. The phase calculated based on the above-mentioned method is between
 $- \mathrm{\pi }$ and
 $\mathrm{\pi }$. If the phase changes from
 $\mathrm{\pi }$ to
 $- \mathrm{\pi }$ with the increase of z,
 $2\mathrm{\pi }$ is added into the phase to make the curve continuous at the changing point. The locations where the phase angle of the lift coefficient jumps in figure 7 and the locations of SIVDL shown in figure 6 match each other. The phase jump (the sudden change of phase at a vortex dislocation position) varies from about
 $\mathrm{\pi }/4$ to approximately
 $\mathrm{\pi }$ for the cases shown in figure 7.
Phase jump of the lift coefficient caused by SIVDL corresponding to the cases in figure 6.

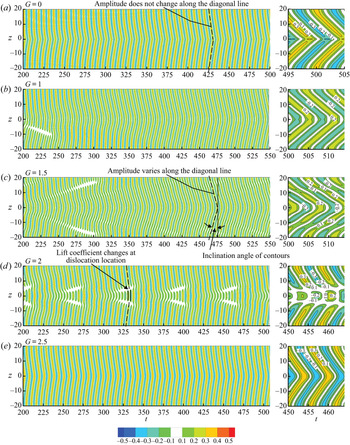
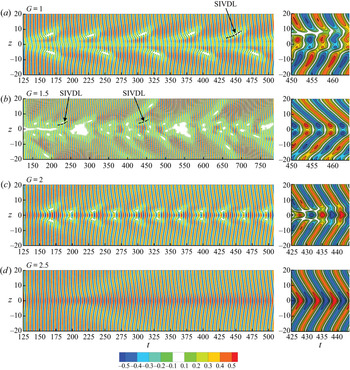
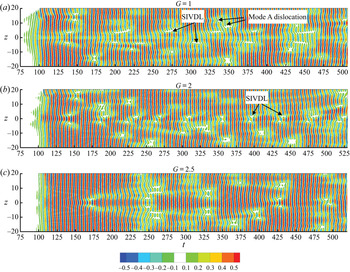
Variations of the phase of the vortex shedding along the cylinder span due to the inclination of the vortices causes variations in the lift coefficient along the cylinder span. The temporal evolution of the sectional lift coefficient along the whole cylinder span for Re = 100 is presented using contours of CLs on the t–z plane in figure 8. After periodic vortex shedding has been established, all the contour lines are in a chevron pattern and their inclination angle is dependent on the gap G. When the contours of the lift coefficient are in a perfect chevron pattern without any distortion (after t = 200 in figure 8(a,e), and after t = 400 in figure 8b), the lift coefficient at any z-location is periodic. For G = 1 and 1.5, the transition of flow to well-established vortex shedding flow takes a longer time than for other gaps. The small lift coefficient of some areas indicated in figure 8(d) is caused by vortex dislocation on the two spanwise sides of the cylinder centre. Vortex dislocation weakens the vorticity in the spanwise direction and, consequently, the lift coefficient is reduced. The inclination of the vortices behind the cylinder changes the phase of vortex shedding and the resultant oscillatory lift coefficient varies along the cylinder span. The variation of the phase of the lift coefficient along the cylinder span correlates with the inclination of the contour lines of the lift coefficient in figure 8.
Contours of sectional lift coefficient on the t–z plane for  $Re = 100$ and G = 1 to 2.5.

As the Reynolds number is increased from 100 to 150, the distribution of the lift coefficient along the cylinder span becomes asymmetric with respect to z = 0 at G = 1, and the vortex shedding becomes aperiodic for some gaps, as shown in figure 9, which presents the contours of the lift coefficient on the t–z plane for  $Re = 150$ and G = 0.5 to 2.5. An almost zero lift coefficient is found to occur periodically at G = 1 in figure 9(a). The contours are out of phase with respect to the z = 0 line, indicating that the vortex shedding is out of phase. At
 $Re = 150$ and G = 1.5, the occurrence of an almost zero lift coefficient near the centre of the cylinder becomes irregular. As G is increased to 2, the occurrence of the near zero lift coefficient becomes periodic again and the non-dimensional distance between the vortex dislocation positions and the centre of the cylinder is decreased to approximately 2.53 when compared to that for G = 1 and 1.5. At G = 2.5, the contour lines in figure 9(d) are parallel to each other (except the part near z = 0) and lift coefficient oscillates periodically along the whole cylinder span.
Contours of the sectional lift coefficient on the t–z plane for  $Re = 150$ and G = 0.5 to 2.5.

The disconnection of contour plots in figures 8 and 9 only occurs when SIVDL of vortices occurs within the vortex formation region immediately behind the cylinder. The link between vortex dislocation and the frequency of the lift coefficient will be explained in detail in the following discussion.
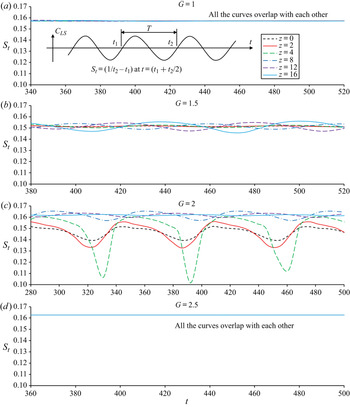
At a spanwise location of the cylinder, the local vortex shedding frequency is the same as the frequency of the sectional lift coefficient. The zero-crossing method used for calculating local the vortex shedding frequency based on the recorded sectional lift coefficient is illustrated through the time history of the sectional lift coefficient (CLS) in figure 10(a). After the zero-crossing points of the sectional lift coefficient are identified using the time histories, an instantaneous non-dimensional period (T) of the vortex shedding is the time interval between two consecutive zero-crossing points and the instantaneous non-dimensional frequency (St, also called the Strouhal number) is the reciprocal of the vortex shedding period, i.e. St = 1/T. The fundamental mechanism of vortex dislocation is the phase variation of vortex shedding due to either natural instability in the transition regime or artificial disturbance (Williamson Reference Williamson1992). Figure 10 shows the time histories of vortex shedding frequency at locations of z = 0, 2, 4, 8, 12 and 16 along the cylinder span for Re = 100 and G = 1, 1.5, 2 and 2.5. At G = 1 and 2.5 the vortex shedding frequencies of the six spanwise locations are the same after the periodic vortex shedding is established. However, the vortex shedding frequency varies along the cylinder span at G = 1.5 and 2.
Time histories of vortex shedding frequency for  $Re = 100$.

The vortex shedding frequency is found to oscillate over time with a very small amplitude as (Re, G) = (100, 1.5) after the flow becomes stabilised at t = 400. By observing figures 8(c) and 10(b) it can be seen that periodic oscillations of the vortex shedding frequency make the contour lines in figure 8(c) slightly curved and the sectional lift coefficient vary along the cylinder span. At G = 1.5, the time-averaged vortex shedding frequencies over t = 380 and 500 of all the spanwise locations are nearly the same, despite the vortex shedding frequency oscillating over time with a small amplitude.
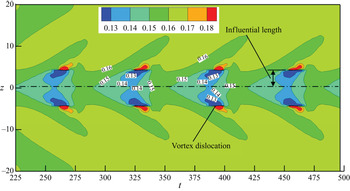
The strongest variation of the vortex shedding frequency along the cylinder span occurs at G = 2 in figure 10(c). The vortex shedding frequencies near the cylinder centre at z = 0, 2 and 4 oscillate over time with large non-dimensional amplitudes of 0.012, 0.024 and 0.058, respectively. The mean values of the vortex shedding frequency at these three locations are approximately 10 per cent smaller than those near the end of the cylinder. The reduction of the vortex shedding frequency in the central part of the cylinder can be further evidenced by contours of the vortex shedding frequency on the t–z plane in figure 11, where the vortex shedding frequencies central to the cylinder are lower than those near the ends due to SIVDL. In addition, the vortex shedding frequency near the cylinder centre varies over time periodically, and as it nears the vortex shedding frequency outside the central part, dislocation disappears, and vortex shedding frequencies on the whole cylinder span synchronise (for example at t = 350). The periodic synchronisation and desynchronisation of the vortex shedding frequencies of the central and side parts of the cylinder is a key feature of the wake with SIVDL.
Contours of vortex shedding frequency on the t–z plane for  $Re = 100$ and G = 2.

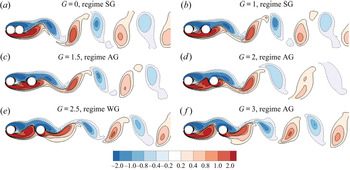
The mechanism of vortex dislocation on the two sides of the cylinder centre is the same as for flow past a two-stepped cylinder (Dunn & Tavoularis Reference Dunn and Tavoularis2006; Morton & Yarusevych Reference Morton and Yarusevych2010; Ji et al. Reference Ji, Yang, Yu, Cui and Srinil2020), where the dislocation and local reduction of the lift coefficient are caused by the sudden change of cylinder diameter. The periodic occurrence of SIVDL can be further explained through an observation of the flow across the x--y-plane shown in figures 12 and 13. The vortex shedding at z = 0 resembles that for flow past two tandem cylinders. The vortex shedding for flow past two tandem cylinders is in the single extended-body regime if there is no vortex shedding from the upstream cylinder. However, it is in the co-shedding regime if vortices are shed from both cylinders (Sumner Reference Sumner2010). Carmo et al. (Reference Carmo, Meneghini and Sherwin2010a,Reference Carmo, Meneghini and Sherwinb) defined three flow regimes for flow past two tandem cylinders: SG at very small gaps; AG where two vortices in the gap expand and shrink alternatively; and WG (wake in the gap), where vortex shedding occurs from the upstream cylinder. The vortex shedding frequency of regime AG is much lower than those in regimes SG and WG. When the gap is at the boundary between AG and WG, the flow is unstable. Igarashi (Reference Igarashi1981) identified a pattern D wake (another name for AG) where the vortices in the gap are unstable and vortex shedding from the upstream cylinder was detected intermittently. All the SG, AG and WG regimes are observed on the z = 0 plane and indicated in figure 12. SIVDL occurs at the AG regime, where the two vortices in the gap are unstable.
Contours of vorticity  ${\omega _z}$ on the x--y-plane for
 $Re = 100$ and different gaps at the maximum sectional lift coefficient of the cylinder at z = 0.

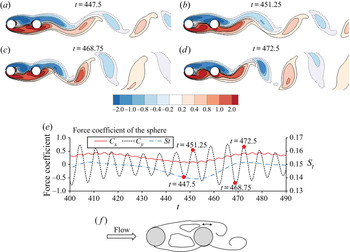
(a–d) Contours of vorticity ωz on the z = 0 plane for  $Re = 100$ and
 $G = 2$. (e) Time histories of the force coefficient and frequency of the force of the sphere; (f) a sketch of pattern D flow for two tandem cylinders reproduced from Igarashi (Reference Igarashi1981).

Figure 13 illustrates the evolution of flow patterns represented by contours of vorticity ωz across the x--y-plane for the AG regime when  $Re = 100$ and G = 2. Every vortex generated from the upstream cylinder in figure 13 is about to be shed from the cylinder before it approaches the downstream sphere. The shear layers that are separated from the cylinder and reattached to the sides of the sphere form vortices in the wake of the sphere. The vortex shedding flow patterns resemble an ‘unstable pattern D wake’ for flow past two tandem cylinders shown at the bottom of figure 13. The vortex shedding frequency at the centre of the cylinder changes with time in figure 13(e), but the vortex shedding flow pattern does not change. The vortex shedding frequency at t = 447.5 is reduced significantly by approximately 15 % in comparison to that at t = 468.75 (see figure 13e). As a result, there is a big difference between the vortex shedding frequencies at the central and end parts (see figures 10 and 11), and vortex dislocation occurs.
Reduction in the vortex shedding frequency is caused by the adhesion of vortices to the cylinder surface at vortex dislocation positions, which is very similar to the vortex adhesion in natural dislocation reported by Zhang et al. (Reference Zhang, Fey, Noack, König and Eckelmann1995) (see figure 5 in the reference). The variation of location where the lift coefficient is nearly zero in figure 8(d) is the evidence that the position of SIVDL changes over time. The influential length of the sphere is defined as the maximum distance between a vortex dislocation point and the centre of the cylinder, as indicated in figure 11.
SIVDL occurs periodically, (see figures 10 and 11) and whenever SIVDL disappears, vortex adhesion disappears and the vortices become continuous and inclined for  $Re = 100$ and 150. Inclination of the vortices is caused by variations in the vortex shedding phase along the cylinder span, and the degree of inclination can be quantified by the change rate of phase angle with respect to z. Variations in the phase angle of the lift coefficient, which is defined as ε along the z-direction, for Re = 100 and 150 are shown in figure 14. For the cases where there is no SIVDL, the phase angle does not change with time. If SIVDL exists, dislocation of vortices occurs periodically, and the lift contour lines are continuous for approximately three or four periods each time when dislocation disappears, as shown figures 8 and 9. Only three periods of data when SIVDL temporally disappears and the lift contour lines are continuous, are used to calculate the phase angle in each case. Positive phase ε at a location means that the phase of the location lags the phase at
 $z ={-} 20$. It can be seen that, when moving from one end towards the centre of the cylinder, the phase difference of the lift coefficient increases relative to that at the end of
 $={-} 20$.
Variation of the phase of the lift coefficient along the cylinder span for  $Re = 100$ and 150.

The phase angle changes with z nearly linearly, except near the two ends of the cylinder where there is an effect from the boundary condition, and near the centre where the sphere affects the flow. The change rate of the phase angle with respect to z (defined as  $\chi = \textrm{d}\varepsilon /\textrm{d}z$) affects the Strouhal number (St). Williamson (Reference Williamson1988a) suggested that the inclination of vortices reduces the Strouhal number and, consequently, the measured Strouhal number should be modified as
 \begin{equation}{S_{tu}} = {S_t}/\cos (\gamma ),\end{equation}
where Stu is the modified Strouhal number, and  $\gamma $ is the angle between the inclined vortices and the cylinder. If we use
 $\textrm{tan(}\gamma \textrm{)}$ to represent the degree of inclination of the vortices, it should be a linear function of
 $\chi $
 \begin{equation}\textrm{tan(}\gamma \textrm{)} = C\chi ,\end{equation}
where C = 0.795 is a fitted constant. The method for finding out constant C is explained in detail in appendix C. After  $\chi $ is obtained using numerical results and
 $\gamma $ is calculated using (3.3), the modified Strouhal number can be calculated using (3.2).
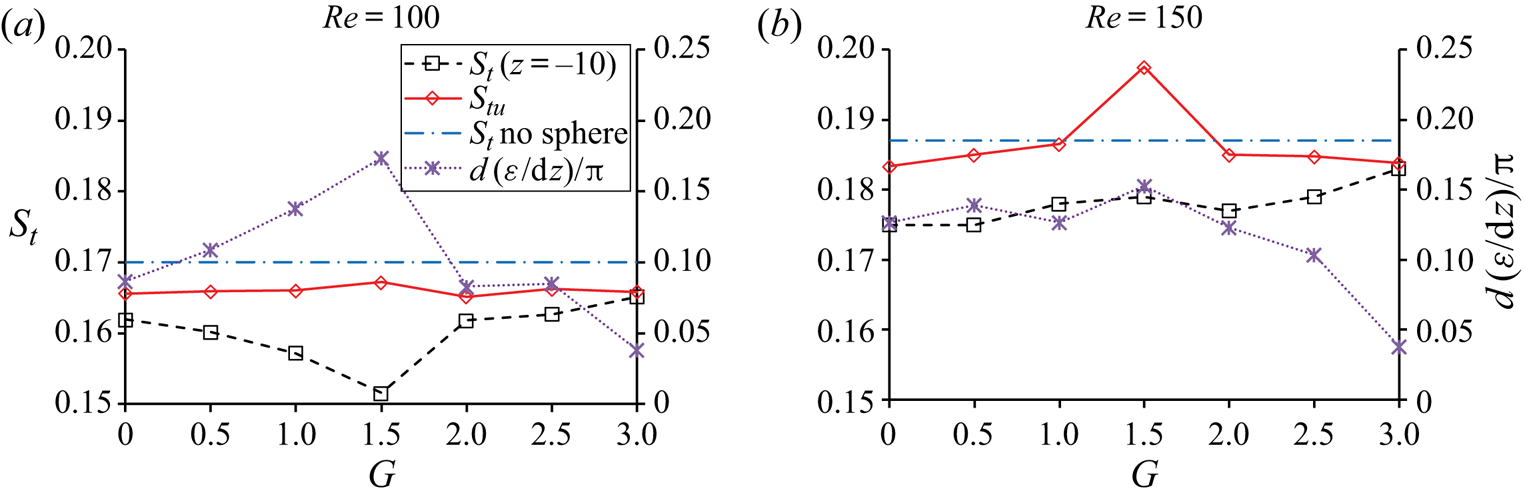
The relationship between  $\chi $, St and Stu is illustrated in figure 15. The Strouhal numbers within
 $z ={-} 5$ and
 $- 10$ are the same if SIVDL does not exist. Both the Strouhal number St at
 $z ={-} 10$ and
 $\chi $ are found to vary with G in figure 15. Any increase in
 $\chi $ causes a decrease in St and vice versa. After the modification using (3.2) and (3.3), Stu varies very little with G, except in the case of
 $(Re,G) = (150,1.5)$, where the lift coefficient changes very irregularly, as shown in figure 9(c). The variation of Stu with G is evaluated by
 ${S^{\prime}_{tu}}/{\bar{S}_{tu}}$, where
 ${S^{\prime}_{tu}}$ and
 ${\bar{S}_{tu}}$ are the standard deviation and averaged value of Stu based on samples of all the simulated gaps. Without considering
 $(Re,G) = (150,1.5)$,
 ${S^{\prime}_{tu}}/{\bar{S}_{tu}} = 0.0037$ and 0.0059 for Re = 100 and 150, respectively. Although Stu is nearly independent on G, all its values for
 $Re = 100$ are approximately 2.4 per cent smaller than that of a cylinder without a sphere. Compared with that for
 $Re = 100$, Stu for
 $Re = 150$ is closer to St without a sphere, except for G = 1.5.
Variation of the Strouhal number and dε/dz with G for  $Re = 100$ and 150.

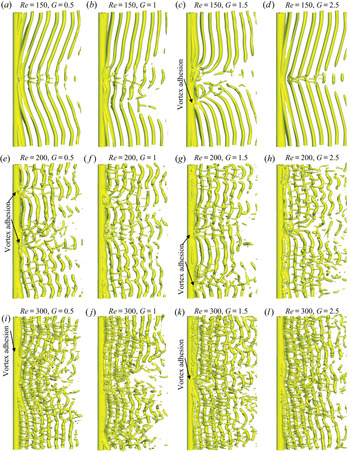
The above discussion demonstrates that in the 2-D flow regime ( $Re = 100$ and 150), SIVDL in the vortex formation zone immediately behind the cylinder only occurs at one location on each side of the cylinder centre. The instability caused by SIVDL does not spread towards each end of the cylinder after vortex dislocation, and no further dislocation is observed. When Re is increased to 200 and 250, SIVDL coexists with the natural vortex dislocation caused by mode A wake. Figure 16 shows the flow structures represented by the iso-surface of
 ${\lambda _2} ={-} 0.2$ for
 $Re = 150$, 200 and 300. The wake at
 $Re = 200$ in figure 16 is in mode A with wavy primary vortices whose wavelength is approximately 3 diameters. Mode A wake is accompanied by waviness in the primary vortices and the generation of streamwise vortices, which become stronger with the increase of the Reynolds number. At
 $Re = 300$, the wake is characterised by finger-shaped spanwise vortices with a wavelength of approximately 1 diameter (Williamson Reference Williamson1996).
Iso-surfaces of  ${\lambda _2} ={-} 0.2$ for
 $Re = 150$, 200 and 300.

From figure 16 it can be seen that, at  $Re = 200$, vortex dislocation and vortex adhesion occur at more positions on the cylinder span than at
 $Re = 100$ and 150. These additional vortex dislocations are typical characteristics of a mode A wake (Henderson Reference Henderson1997; Jiang et al. Reference Jiang, Cheng, Draper, An and Tong2016), which is defined as mode-A-VD and mapped on the vortex dislocation map in figure 2. At
 $Re = 200$, the coexistence of the mode-A-VD and SIVDL has significant effects on the lift coefficient, as shown figure 17, where contours of the sectional lift coefficient of the cylinder along the t–z plane are presented. In addition to the dislocations caused by SIVDL, the natural dislocations caused by a mode A wake can be evidenced from the random occurrence of the disconnection of the lift coefficient contour lines in figure 17. At G = 1, 2 and 2.5, SIVDL can still be separated from mode-A-VD based on their periodic occurrences near the centre of the cylinder.
Contours of sectional lift coefficient of the cylinder on the t–z plane for  $Re = 200$.

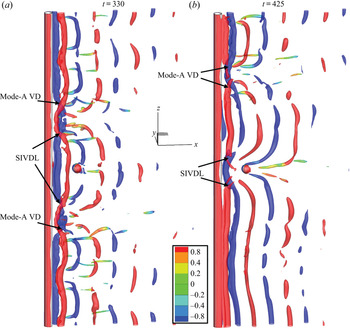
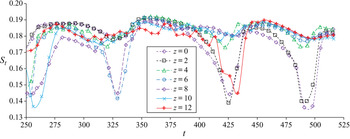
The coexistence of SIVDL and mode-A-VD can be further illustrated by the detailed flow structure for  $(Re,G) = (200,\; 2.5)$ at t = 330 and 425 in figure 18 and the corresponding time histories of the sectional lift coefficient frequency in figure 19. Vortex dislocations at
 $z \approx{\pm} 4$ when t = 330 and
 $z \approx{\pm} 2$ when t = 425 are caused by interferences from the sphere, and the rest of the dislocations (referred as mode-A-VD) are caused by mode A wake instability. The mechanisms of both SIVDL and mode-A-VD are the variation of the vortex shedding phase along the cylinder span. The low frequency caused by the adhesion of vortices to the cylinder surface can be seen by comparing figure 18 with figure 19. For example, at t = 330, the position of z = 0 has two adhesion points on its top and bottom sides, as well as the position of z = 6. Under the influence of the vortex adhesion, the vortex shedding frequencies at z = 0 and 6 are reduced significantly, as seen in figure 19. The reduction of the vortex shedding frequency at z = 0 and 12 when t = 425 is also caused by vortex adhesion (Zhang et al. Reference Zhang, Fey, Noack, König and Eckelmann1995). From figure 17(c), it can be seen that the lift coefficient is reduced significantly at dislocation positions, for example at z = 2 and t = 425. If two dislocation points are very close to each other (for example between z = 4 and 8 in figure 18a), the spanwise vortices between them become very weak and dissipate quickly. The wake behind them is similar to SIVDC and two-sided dislocation is caused by a ring (Williamson Reference Williamson1992). In figure 18(a), spanwise vortices disappear at (t, z) = (330, 6), (425, 0) and (425, 12) because the distance between two neighbouring vortex dislocations is very small. In figure 19(a), the reduction of the frequency at z = 12 between about t = 420 and 435 is due to vortex dislocation caused by the instability of the mode A wake (see the dislocation at t = 425 in figure 18).
(a) Iso-surfaces of λ 2 = −1 and contours of ωz for  $(Re,G) = (200,\; 2.5)$ at t = 330 and t = 425.

Time history of the frequency of the sectional lift coefficient for  $(Re,G) = (200,\; 2.5)$, the same case as for figure 18.

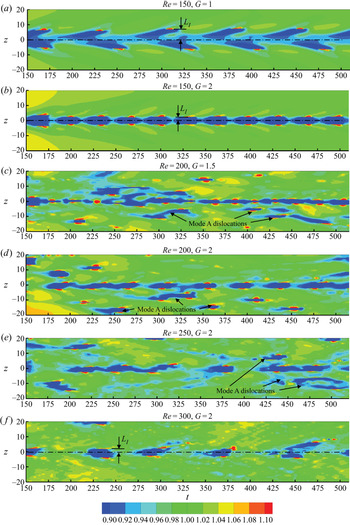
Since SIVDL is caused by the phase difference between the central and side parts of the vortex shedding, it can be identified by the variation of vortex shedding frequency. To identify SIVDL, variations of the vortex shedding frequency for all the simulated cases are presented using the contours of the normalised Strouhal number, as shown in figure 20. The normalised Strouhal number is 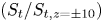 $({S_t}/{S_{t,z ={\pm} 10}})$ where
 ${S_{t,z ={\pm} 10}}$ is the Strouhal number at
 $z ={\pm} 10$, for which there are no SIVDLs. If SIVDL occurs, the vortex shedding frequency jumps at vortex dislocation positions. The variation of the vortex shedding frequency along the cylinder span is highly irregular with many frequency jumps at
 $Re = 200$ and 250, due to interference from mode-A-VDs. SIVDL are mainly located at the central part of the cylinder, and mode-A-VDs coexists with SIVDL at the positive and negative z sides. The local reduction in the vortex shedding frequency caused by SIVDL near z = 0 can still be identified when mode-A-VDs exist at
 $Re = 200$ and 250. SIVDL at
 $Re = 300$ can be easily identified because the wake is in mode B, where mode-A-VD does not exist.
Contours of normalised Strouhal number  ${S_t}/{S_{t,z ={\pm} 10}}$ on the t–z plane.

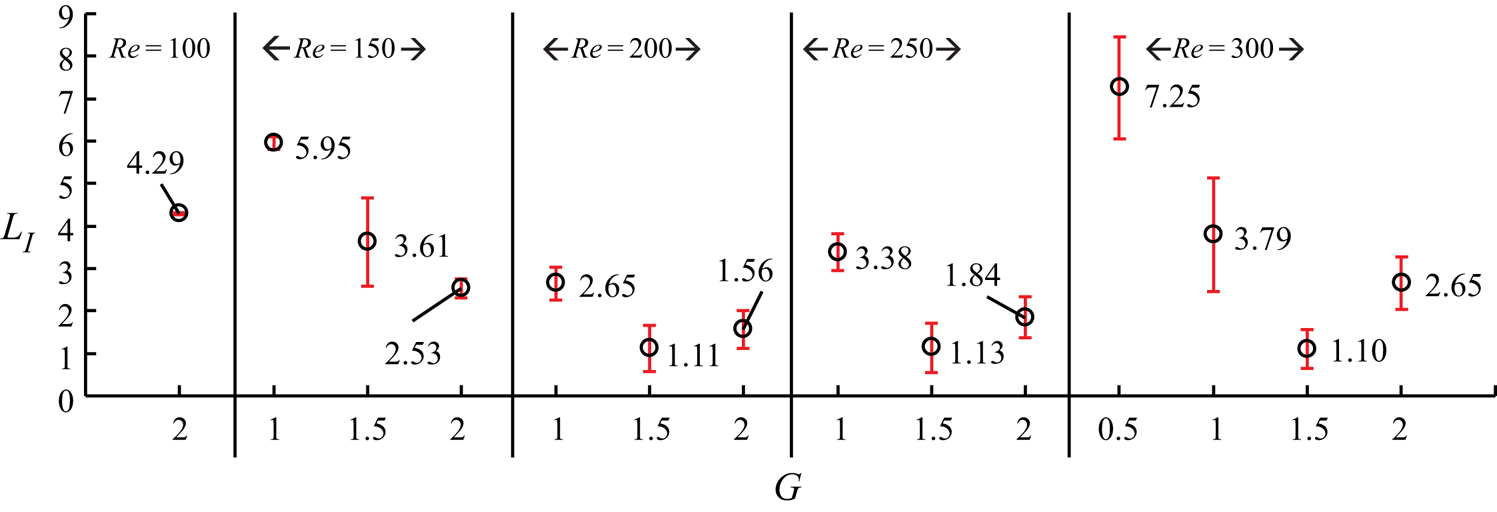
The non-dimensional influential length (LI) of the sphere is defined as the non-dimensional distance between the position where the mean frequency jumps and the centre of the cylinder, as indicated in figure 20. At  $Re = 100$ and 150, the influential length remains nearly constant as SIVDL occurs periodically. At
 $Re = 200$, the periodic SIVDL occurrence becomes weak due to the strong effects from mode-A-VDs. At
 $Re = 250$ and 300, the occurrence of SIVDL becomes aperiodic and LI varies significantly with time, but the locations of SIVDL are still within 10 diameters from the cylinder centre. The values of LI of all SIVDL are measured and the averaged values of LI are presented in figure 21, with error bar presenting the standard deviation. The maximum LI occurs at
 $(Re,\; G) = (150,\; 1)$, where SIVDL is stronger on one side of the cylinder than the other. SIVDL only occurs at G = 2 for
 $Re = 100$. LI reaches it minimum value at G = 1.5 as
 $Re = 200$ to 300.
Influential lengths of SIVDL obtained by frequency analysis.

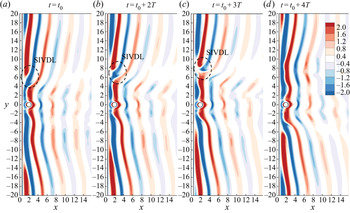
To explain why the influential length decreases with the increase of G, the evolution of the position of SIVDL for  $(Re,\; G) = (150,\; 1)$ is presented by the contours of spanwise vorticity on the x--z-plane in figure 22. The spanwise position of SIVDL is found to move away from the z = 0 position before it disappears at t 0 + 4T. It is the same as the position of disconnection of the lift coefficient contours shown in figure 9. Based on figure 9, it can be seen that the SIVDL occurs more frequently as G increases from 1 to 2. If the period of SIVDL occurrence decreases (as shown in figure 9), LI decreases as the time required for SIVDL to move towards each end of the cylinder reduces.
Contours of the spanwise vorticity ωz on the x--z-plane for  $(Re,G) = (150,1)$ at four instants at the maximum lift coefficient. Time t 0 = 439.5, T is vortex shedding period and t 0 + 4T = 469.9.

3.2. Force coefficients on the cylinder
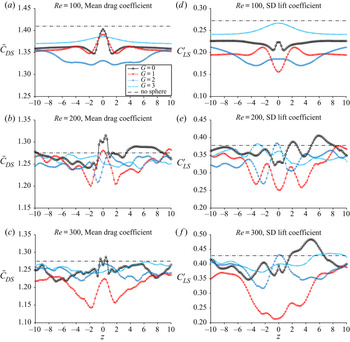
Figure 23 shows the distribution of the mean sectional drag coefficient ( ${\bar{C}_{DS}}$) and the standard derivation (SD) of the sectional lift coefficient (
 ${C^{\prime}_{LS}}$) along the cylinder span for Re = 100, 200 and 300. The statistical values of the force coefficients are obtained using the data between t = 350 and 500. The reduction of both
 ${\bar{C}_{DS}}$ and
 ${C^{\prime}_{LS}}$ compared with their corresponding values where there is not a sphere is due to the inclination of the vortices. The values of
 ${\bar{C}_{DS}}$and
 ${C^{\prime}_{LS}}$ at
 $z ={\pm} 10$ are still smaller than the values in the cylinder-only case. The sectional force coefficients for G = 3 is the closest to those in a cylinder-only case for all the Reynolds numbers, because the inclination angle of the vortices is the smallest.
Distribution of the mean sectional drag coefficient and SD sectional lift coefficient along the cylinder span for Re = 100, 200 and 300.

At  $Re$ and G are in the regimes of (
 $Re$,G) = (100, 0 to 1.5) and (Re,G) = (150 to 300, 0 to 1), the sphere interferes with interactions between the separated shear layers from the cylinder. As a result, the pressure between the cylinder and the sphere is low and oscillates weakly, leading to a local increase of
 ${\bar{C}_{DS}}$ and decrease of
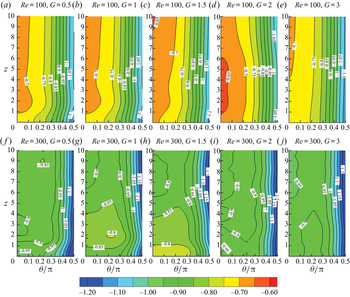
 ${C^{\prime}_{LS}}$ at z = 0. Figure 24 shows the contours of the mean pressure coefficient on the downstream half-surface of the cylinder, where
 $\theta /\mathrm{\pi } = 0$ is the most downstream point on the circumference of the cylinder. The pressure coefficient is defined as
 ${C_p} = (p - {p_0})/({U^2}/2)$, where
 ${p_0}$ is the pressure of the free stream. The contours of
 ${\bar{C}_P}$ are nearly parallel to each other near z = 10, indicating a weak variation of the mean drag coefficient along the z-direction. The reduction of the pressure at the central part of the cylinder, relative to the end part, can be seen in figure 24(a–c). The pressure near
 $\theta /\mathrm{\pi } = 0$ and
 $1 \lt z \lt 6$ is increased locally in the case of
 $(Re,G) = (100,2)$, which is the case of strong SIVDL. This increase of pressure on the back of the cylinder leads to a reduction of the drag coefficient as shown in figure 23(a).
Distribution of the mean pressure coefficient on the back surface of the cylinder for  $Re = 100$ and 300.

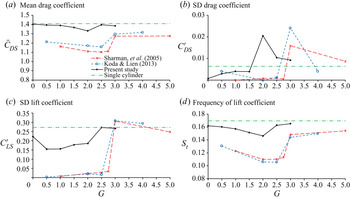
Variations of sectional force coefficients and Strouhal number at z = 0 with G are similar to those for flow past two tandem cylinders as seen in figure 25. This is because the flow patterns represented by the contours of vorticity  ${\omega _z}$ on the z = 0 plane for
 $Re = 100$ in figure 12 resemble those for flow past two cylinders in tandem. When two cylinders are in a tandem arrangement in a flow, vortex shedding from the upstream cylinder does not occur until the non-dimensional gap is increased to approximately 3 for
 $Re = 100$ (Sharman et al. Reference Roos and WillmarthReference Sharman, Lien, Davidson and Norberg2005). It can be seen from figure 12 that, in the sphere–cylinder system, the vortex shedding from the centre of the upstream cylinder occurs as the non-dimensional G increases from 2 to 2.5 for
 $Re = 100$. The critical G for the vortex shedding from the centre of the upstream cylinder to occur in the sphere–cylinder system is smaller than that for a dual-cylinder system because the sphere only affects vortex shedding of the cylinder for a limited span length. The occurrence of vortex shedding from the upstream cylinder leads to increases in
 ${\bar{C}_{DS}}$,
 ${C^{\prime}_{LS}}$ and St in figure 25, both in the sphere–cylinder and dual-cylinder systems. However, a downstream sphere does not alter the force coefficients and the vortex shedding frequency as much as a downstream cylinder.
Comparison between the sectional force coefficients and frequencies of the upstream cylinder at z = 0 for Re = 100 with the results of the upstream cylinder in the arrangement of two tandem cylinders (Sharman et al. Reference Sharman, Lien, Davidson and Norberg2005; Koda & Lien Reference Koda and Lien2013).

3.3. Force coefficients on the sphere
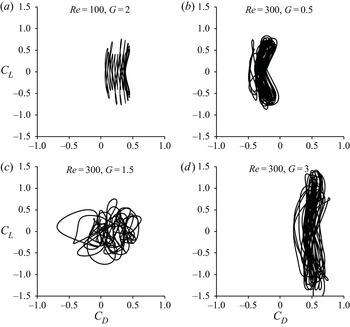
The force on the sphere is mainly affected by the central part of the cylinder. Figure 26 shows the phase plot of (Cx, Cy) for some reprehensive cases. The non-dimensional forces of the sphere in the (x,y,z) directions are defined as  $({C_x},{C_y},{C_z}) = ({F_x},{F_y},{F_z})/({A_s}{U^2}/2)$, where
 $({F_x},{F_y},{F_z})$ are dimensional forces and
 ${A_s} = \mathrm{\pi }{D^2}/4$ is the projected area. The phase diagrams are generated using the force coefficients recorded from t = 400 to 500. Figure 26(a) is the case where strong SIVDL occurs periodically behind the cylinder. The force coefficient in figure 26(a) has two frequencies: the very low beating frequency is the frequency of the periodic occurrence of SIVDL, and the high frequency is the vortex shedding frequency. As a result, Cy oscillates for several periods during the time when Cx changes from its minimum to maximum values. For
 $(Re,G) = (100,2)$, the oscillation of the drag coefficient has mainly two components: a small-amplitude, high-frequency component due to vortex shedding, and a high-amplitude, low-frequency component due to SIVDL. The drag coefficient Cx reaches its minimum value every time the vortex shedding frequency at z = 0 is reduced to its minimum value.
Time histories of the force coefficients of the sphere for some representative cases.

For force coefficients of the sphere at Re = 300 are much greater than those of an isolated sphere due to hairpin vortices (Johnson & Patel Reference Johnson and Patel1999). At  $Re = 300$ and G = 1.5, where SIVDL occurs, both drag and lift coefficients of the sphere oscillate irregularly in figure 26(c). SIVDL makes Cx of the sphere oscillate irregularly with larger amplitudes than Cy. At
 $(Re,G) = (300,0.5)$, the very weak SIVDL causes weak disturbances on the drag and lift coefficients in figure 26(b). When G is outside of the SIVDL regime, Cx oscillates with a much smaller amplitude than Cy (see figure 26d).
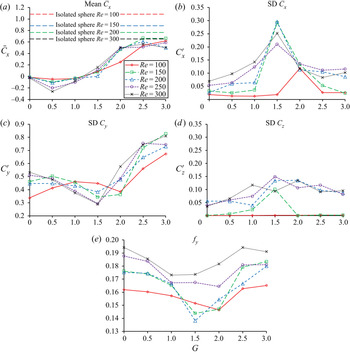
Figure 27 demonstrates the variations in mean and SD values of the sphere's force coefficients with G, where  ${\bar{C}_x}$ is the mean force coefficient of the sphere in the x-direction and
 ${C^{\prime}_x}$,
 ${C^{\prime}_y}$ and
 ${C^{\prime}_z}$, being the SD of force coefficients in the x-, y- and z-directions, respectively. The mean drag coefficient
 ${\bar{C}_x}$ is negative as G = 0, 0.5, and 1 for all Reynolds numbers as the cylinder is in the vortex formation region with very low pressure. The value of
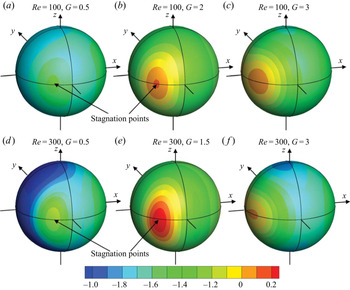
 ${\bar{C}_x}$ increases with the increase of G until G = 2.5. However, it is still smaller than that of an isolated sphere at the maximum G = 3. The reduction of the mean drag coefficient at a small G value can be explained by the distribution of the mean pressure coefficient on the surface of the sphere shown in figure 28. The mean drag coefficient is either negative or very small when G is small as unshed vortices between the cylinder and the sphere produce low pressure coefficients on the upstream surface of the sphere. At G = 0.5, the whole surface of the sphere is covered by negative mean pressure coefficients. At G = 1.5, 2 and 3, a majority of the sphere's surface is covered by negative mean pressure coefficients except near the stagnation points (labelled in figure 28). With the increase of G, the stagnation point moves from the side towards the upstream point of the sphere along the equator (the circumference on the x--y-plane). As a result, the mean drag coefficient increases with the increase of G.
Variation of the force coefficients and mean frequency of the force coefficient in the y-direction (fy) of the sphere with G.

Distribution of the time-averaged mean pressure coefficient along the surface of the sphere.

The wake of an isolated sphere is steady for  $Re = 100$ to 250 and becomes unsteady at
 $Re = 300$. The calculated SD of the drag and lift coefficients of an isolated sphere at
 $Re = 300$ are 0.0174 and 0.0942, respectively, which are negligibly smaller than the values of a sphere in the wake of a cylinder. In figure 27(b), the SD of the drag coefficient
 ${C^{\prime}_x}$ of the sphere is the highest at G = 2 for
 $Re = 100$, where SIVDL causes the low-frequency, high-amplitude oscillation of Cx. The maximum
 ${C^{\prime}_x}$ occurs at G = 1.5 for the rest of the Reynolds numbers. The effect of the SIVDL on
 ${C^{\prime}_y}$ is opposite to that on
 ${C^{\prime}_x}$, i.e.
 ${C^{\prime}_x}$ is increased but
 ${C^{\prime}_y}$ is reduced by SIVDL. The reason why SIVDL causes the maximum reduction of
 ${C^{\prime}_y}$ at G = 2 for
 $Re = 100$ is because the vortex shedding from the upstream cylinder does not occur across the x--y-plane, as seen in figure 12(d). If SIVDL occurs and vortex shedding from the upstream cylinder does not,
 ${C^{\prime}_x}$ increases due to the beating of Cx shown in figure 13(c). The value of
 ${C^{\prime}_x}$ is increased mainly as a result of its low-frequency, large-amplitude component caused by SIVDL. However, in the case of two tandem cylinders, the drag coefficient of the downstream cylinder does not have a low-frequency, large-amplitude component since SIVDL does not exist.
When the Reynolds number is 200, 250 or 300, the SD of the force coefficient in the z-direction  $({C^{\prime}_z})$ in figure 27(d) is of the same order as
 ${C^{\prime}_y}$. The value of
 ${C^{\prime}_z}$ is zero for
 $Re = 100$ because the flow is symmetric and not zero for
 $Re = 150$ and higher. The non-zero
 ${C^{\prime}_z}$ is caused by the unbalanced SIVDL on the span of the cylinder with respect to the x--y-plane.
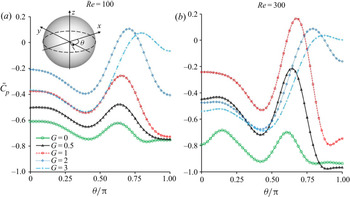
The distribution of the mean pressure coefficient along the equator of the sphere is quantified in figure 29. In the figure, the pressure curves for different G are nearly parallel with each other in the downstream part of the equator  $(0 \le \theta /\mathrm{\pi } \le 0.5)$. The gap G is found to mainly affect the variation of the mean pressure coefficient on the upstream part of the sphere
 $(0.5 \le \theta /\mathrm{\pi } \le 1)$. For G = 2.5 and 3, the pressure coefficient in the range of θ/π = 0.75 and 1 is high because of the influx of high momentum into the cylinder wake region before the sphere. The high mean pressure near
 $\theta /\mathrm{\pi } = 1$ along the equator for G = 3 increases the drag coefficient on the sphere.
Distribution of the mean pressure coefficient along the equator of the sphere for Re = 100 and 300.

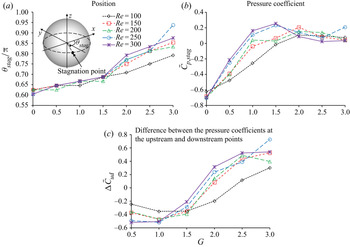
The stagnation point, which is the position where  ${\bar{C}_p}$ reaches its maximum, is located on the equator of the sphere (section z = 0) as identified in figure 28. The position angle of the stagnation point
 $({\bar{\theta }_{stag}})$ is defined as its the position angle on the equator (see the schematic definition in figure 30a). With the increase of G, the shift of the stagnation point from the sides towards the upstream point of the sphere is quantified in figure 30(a), and the mean pressure coefficients at the stagnation points are shown in figure 30(b). As G is greater than 2, vortex shedding from the centre of the cylinder occurs, and consequently the stagnation pressure
 ${\bar{C}_{p,stag}}$ stops increasing with the increase of G, so does the mean drag coefficient. The variation of pressure along the equator of the downstream sphere is similar to that along a downstream cylinder (Alam et al. Reference Alam, Moriya, Takai and Sakamoto2003; Wang, Yan & Wang Reference Wang, Yan and Wang2013). Figure 30(c) shows the variation of difference in the mean pressure coefficient
 $\Delta {\bar{C}_{pud}}$ between the most upstream and downstream points (corresponding to θ/π = 1 and 0, respectively) of the sphere with G. The variations of
 $\Delta {\bar{C}_{pud}}$ in figure 30(c) and
 ${\bar{C}_x}$ in figure 30(a) with G follow a similar trend. The negative pressure difference
 $\Delta {\bar{C}_{pud}}$ at small G is the reason for the negative drag coefficient.
Variation of the mean position angle of the stagnation point ( ${\bar{\theta }_{stag}}$) and the pressure coefficient at the stagnation point (
 ${\bar{C}_{p,stag}}$) of the sphere.

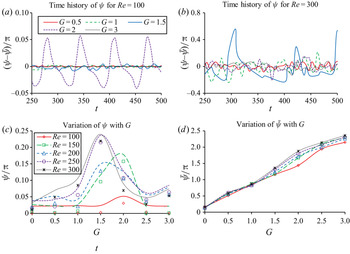
The instantaneous phase difference between the lift coefficient of the cylinder at z = 0 and the force coefficient of the sphere  $({C_y})$ is defined as ψ. Figures 31(a) and 31(b) show the time histories of the oscillatory part of the phase
 $(\psi - \bar{\psi })$ for
 $Re = 100$ and 300, respectively, where
 $\bar{\psi }$ is the time-averaged phase difference. At
 $Re = 100$, ψ oscillates with a small amplitude at G = 0.5, 1 and 3. It slightly oscillates over time at G = 1.5, and oscillates at a large amplitude at G = 2, which is the gap for SIVDL. At
 $Re = 300$, the strongest SIVDL and strongest oscillation of ψ over time occurs when G = 1.5. Figures 31(c) and 31(d) show the variation of the SD of the phase difference
 $(\psi ^{\prime})$, and the time-averaged phase difference
 $\bar{\psi }$ with the gap G, respectively. By comparing figure 31(c) and the vortex dislocation map figure 2 it can be seen that
 $\psi ^{\prime}$ increases in the regime of SIVDL. In figure 31(d), the mean phase difference
 $\bar{\psi }$ increases with the increase of G nearly linearly, and the effect of the Reynolds number on it is very weak at G = 0, 0.5 and 1.
The phase difference between the sectional lift coefficient at the centre of the cylinder span and the lift coefficient of the sphere. (a) Time histories of  $\psi $ for Re = 100; (b) time histories of
 $\psi $ for Re = 300; (c) variation of
 $\psi ^{\prime}$ with G; (d) variation of
 $\bar{\psi }$ with G.

4. Conclusions
The mutual interaction between an upstream cylinder and a downstream sphere in fluid flow is simulated numerically for Reynolds numbers Re = 100 to 300 and non-dimensional gaps G = 0 to 3. The main conclusions are summarised as follows.
The sphere causes two types of dislocation/disconnection for vortices in the wake of the cylinder, which are mapped on the G–Re plane in figure 2. If the sphere is very close to the cylinder and the Reynolds number is low, shear layers generated from the cylinder can pass around the sphere and form vortices behind the sphere without any dislocation/disconnection. When the gap between the cylinder and the sphere is large, vortex shedding occurs before the sphere, and vortices are disconnected after they pass by the sphere. This type of vortex disconnection (referred to be SIVDC), is very similar to the two-sided dislocation caused by a small ring (Williamson Reference Williamson1992). Another type of vortex dislocation (SIVDL) is found to have a strong similarity to the natural dislocation in the wake transition mode A and the dislocation caused by step cylinders. The characteristics of SIVDL are summarised as follows:
(i) SIVDL occurs at locations on the cylinder span some distance away from the sphere, instead of in the gap between the sphere and the cylinder. The spanwise distance between the sphere and SIVDL locations is defined as the influential length, and it varies with G and
 $Re$ (see figure 22).
(ii) SIVDL occurs in the vortex formation region immediately behind the cylinder, resulting in a significant influence on the forces of the sphere. It causes low-frequency, high-amplitude oscillations of the drag coefficient of the sphere. The adhesion of vortices at SIVDL to the cylinder is similar to the vortex adhesion found in natural dislocation in the mode A wake (Zhang et al. Reference Zhang, Fey, Noack, König and Eckelmann1995). The vortex adhesion makes the vortices inclined and reduces the drag and lift coefficients of the cylinder.
(iii) SIVDL causes variations of vortex shedding frequency along the cylinder span, and as a result, the time-averaged vortex shedding frequency at the central part of the cylinder is lower than that near the two ends.
(iv) The periodic occurrence of SIVDL causes periodic oscillation of the vortex shedding frequency at the central part of the cylinder. Furthermore, it causes the vortex shedding of the central part and end parts of the cylinder to synchronise and desynchronise periodically. SIVDL occurs when the vortex shedding desynchronises, and ceases when the vortex shedding frequencies synchronises.

The inclination angle of vortices can only be measured at  $Re = 100$ and 150, where the flow is laminar. It reduces the force coefficient and vortex shedding frequency, but does not affect the modified Strouhal number (Williamson Reference Williamson1988a).
Similar to that of a downstream cylinder, the mean drag coefficient of the downstream sphere is negative when G is very small and increases with the increase of G. The reduction of the vortex shedding frequency by SIVDL was also found in mode AG wake for flow past two tandem cylinders. However, the significant increase in the SD of the sphere's drag coefficient by SIVDL does not exist in the case of two tandem cylinders. Furthermore, the SIVDL-induced beating of the lift coefficient and low-frequency oscillations of the sphere's drag coefficient do not exist in the two-tandem-cylinder case.
Declaration of interests
The Author reports no conflict of interest.
Appendix A. Validation of the model on the simulation of flow past a sphere
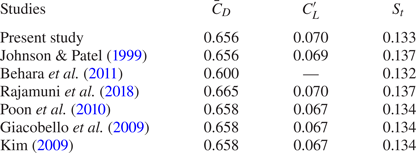
In this section, the validation of the numerical model in the simulation of flow past an isolated sphere with a Reynolds number of 300 is conducted. The density of the mesh used for simulating flow past an isolated sphere is the same as that for the cylinder–sphere system. Table 1 lists the mean drag coefficient  $({\bar{C}_D})$, the SD of the lift coefficient
 $({C^{\prime}_L})$ and the structural numbers calculated in this study and other published papers for
 $Re = 300$. For an axisymmetric sphere, the lift coefficient could be in any direction on the y--z-plane, and
 ${C^{\prime}_L}$ is calculated by
 ${C^{\prime}_L} = \sqrt {C_y^{^{\prime}2} + C_z^{^{\prime}2}}$. The results from different studies are very similar to each other, and present results of the force coefficients agree with the most recent numerical results by (Rajamuni et al. Reference Rajamuni, Thompson and Hourigan2018).
Comparison between the force coefficients and the Strouhal numbers of flow past a sphere at  $Re = 300$ from different studies.

Appendix B. Domain size and mesh independency study
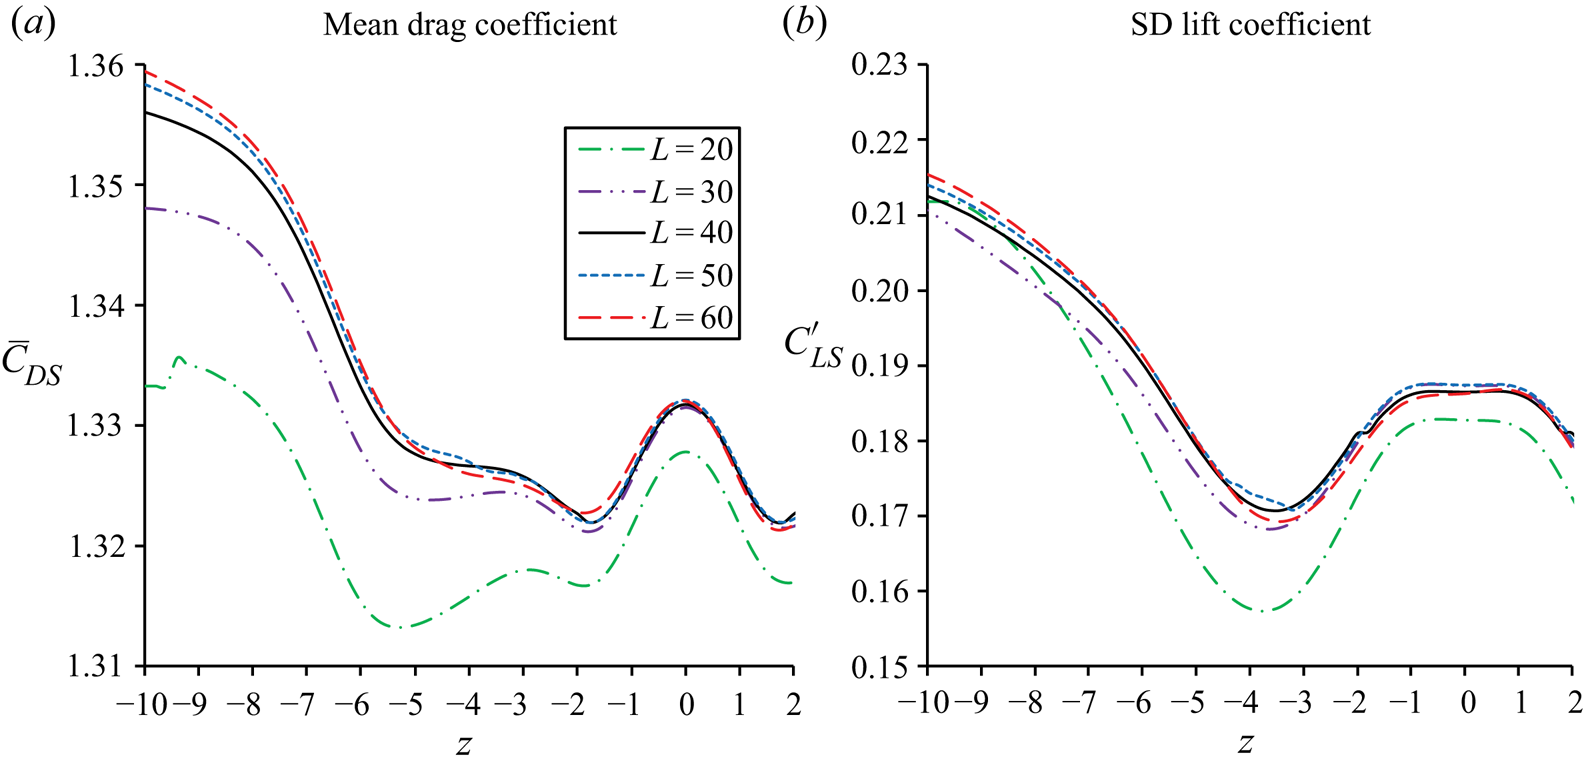
The effect of the computational domain size on the numerical results is studied by simulating the flow at  $(Re,G) = (100,2)$. The lowest Reynolds number is used for domain size independency studies, as the effect of the blockage on the numerical results decreases with the increase of the Reynolds number (Sohankar et al. Reference Sohankar, Norberg and Davidson1998). Simulations are conducted for five non-dimensional domain sizes in the spanwise direction of the cylinder: L = 20, 30, 40, 50 and 60. The computational domain for L = 40 is the one used in this study. The non-dimensional distance between the inlet boundary and the cylinder is 20 for all the cases. For L = 20, 30 and 40, both the computational domain size in the y-direction and the non-dimensional distance between the cylinder and outlet boundary are 40. For L = 50 and 60, both the computational domain size in the y-direction and the non-dimensional distance between the cylinder and the outlet boundary are the same as L.
Figure 32 shows the distribution of the mean sectional drag coefficient  $({\bar{C}_{DS}})$ and SD sectional lift coefficient
 $({C^{\prime}_{LS}})$ along the cylinder span for different domain sizes. It can be seen that, with the increase of the domain size, the results converge. The difference between the results of a cylinder length relative to L = 60 is quantified as
 $e = |a - {a_{60}}|/{a_{60}}$, where a stands for force coefficient or Strouhal number and
 ${a_{60}}$ is the result for L = 60. The maximum differences between the results of
 ${\bar{C}_{DS}}$ and
 ${C^{\prime}_{LS}}$ calculated from L = 40, and their counterparts calculated from L = 60 are
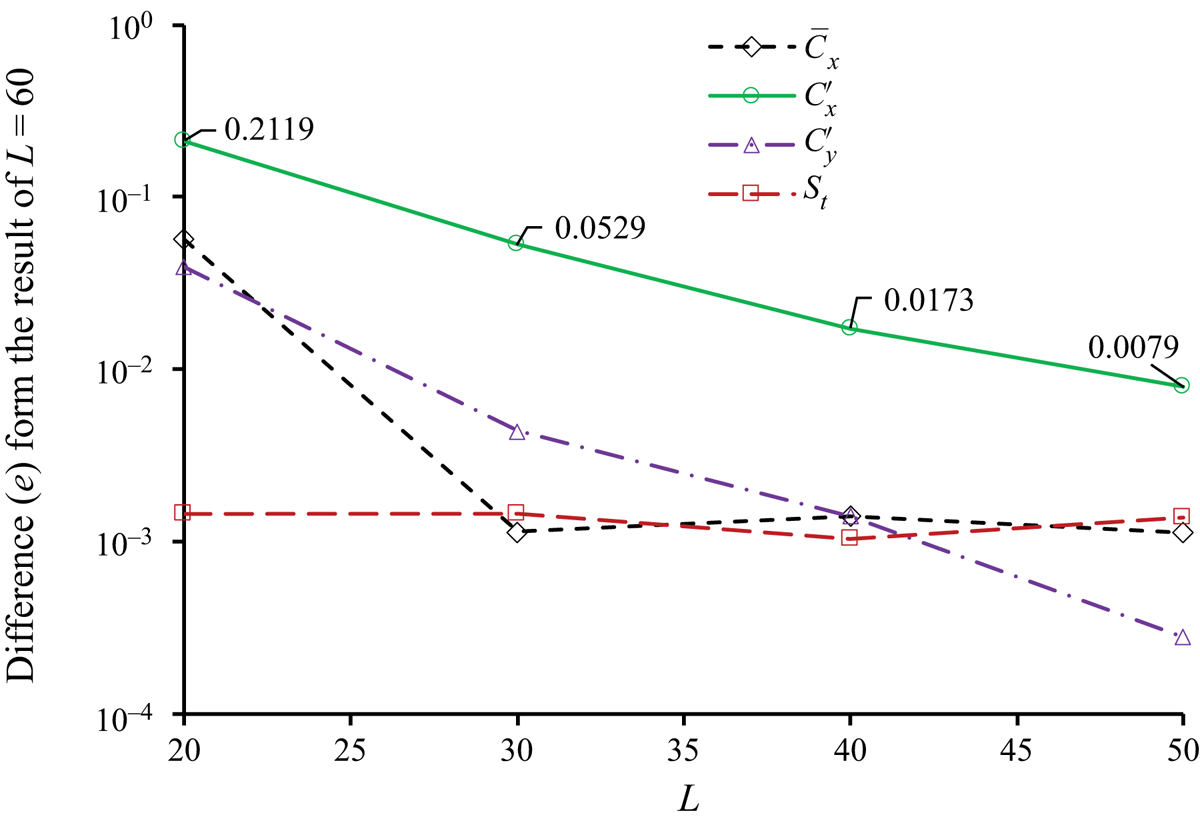
 $e = 0.0025$ and 0.012, respectively. Figure 33 shows the differences between the force coefficients and the Strouhal number of the sphere at L = 60 and the corresponding results at smaller L. The difference between
 ${\bar{C}_x}$,
 ${C^{\prime}_y}$ and
 ${S_t}$ for L = 40 and their values for L = 60 is less than
 $e = 0.002$. The difference between
 ${C^{\prime}_y}$ for L = 40 and
 ${C^{\prime}_y}$ for L = 60 is approximately
 $e = 0.017$.
Distribution of the mean sectional drag coefficient  $({\bar{C}_{DS}})$ and SD sectional lift coefficient
 $({C^{\prime}_{LS}})$ along the cylinder span for different domain sizes.

The difference between the results of the sphere at L = 20 to 50 and the results at L = 60;  $\varepsilon = |a - {a_{60}}|/{a_{60}}$, where a stands for force coefficient or Strouhal number and
 ${a_{60}}$ is the corresponding result for L = 60.

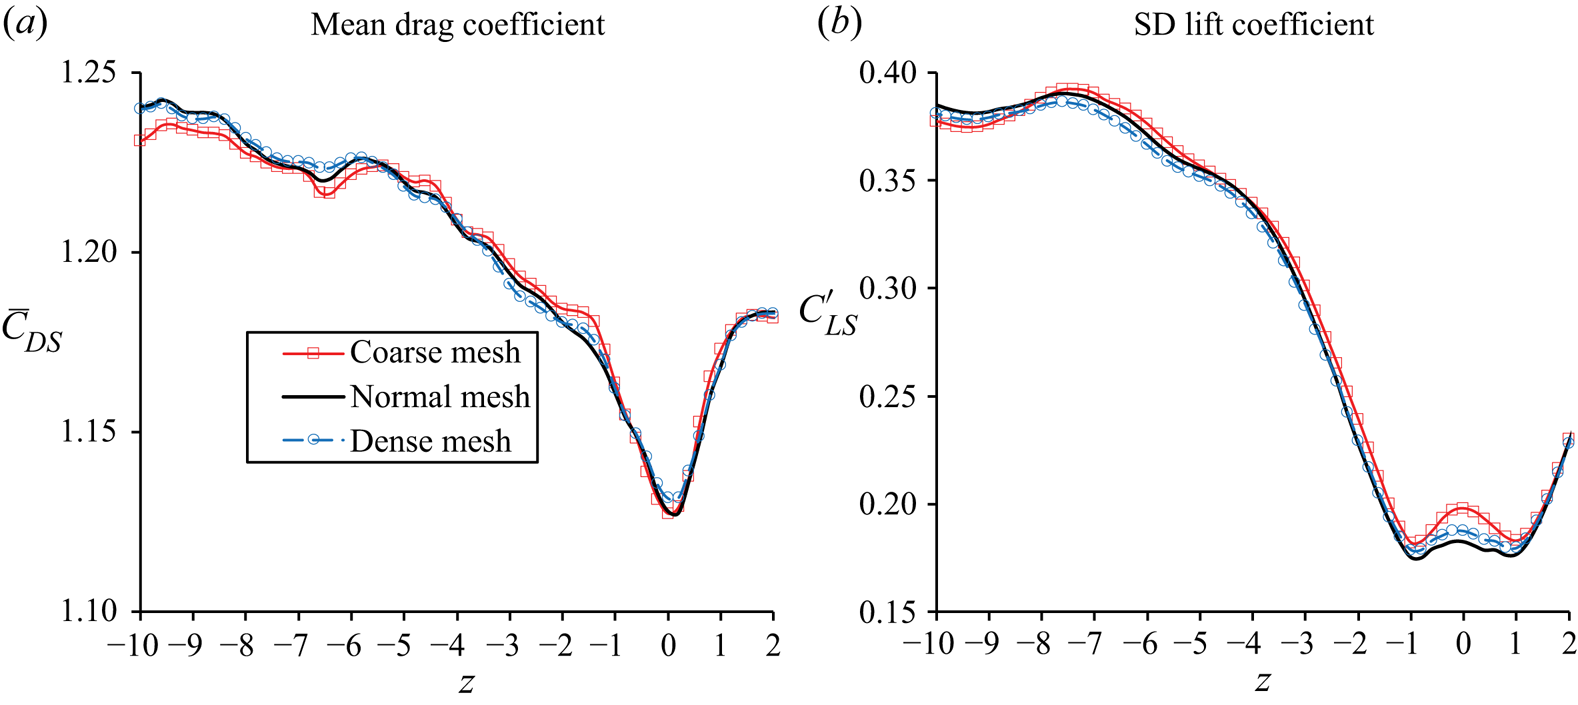
A mesh independency study is conducted to ensure that the mesh used in this study is dense enough for converged results. Simulations for  $(Re,G) = (300,1.5)$ are conducted using coarse, medium and dense meshes listed in table 2, where Δr is the first layer mesh size in the radial direction on the cylinder and sphere surfaces, Δz is the mesh size in the spanwise direction of the cylinder and Nc is the number of the elements along the circumference of the cylinder and the sphere. The mesh density of all simulations in the present study is the same as that of the medium mesh. The calculated Strouhal numbers, mean drag coefficients and SD of drag and lift coefficients of the sphere calculated from the three meshes are listed in table 2. The differences between
 ${C^{\prime}_x}$ and
 ${C^{\prime}_y}$ calculated from the medium mesh, and their counterparts from the dense mesh are 4.3 % and 4.8 %, respectively.
Strouhal number and force coefficients of the sphere calculated from three meshes with different densities.

Figure 34 shows the variation of the mean sectional drag and SD sectional lift coefficients of the cylinder along the z-direction calculated from the three meshes. Within  $- 10 \le z \le 10$, the maximum differences between the mean drag and the SD of the lift coefficients calculated from the two meshes are 0.8 % and 2.5 %, respectively.
Variations of the mean drag coefficient  $({\bar{C}_{DS}})$ and SD sectional lift coefficient
 $({C^{\prime}_L})$ of the cylinder along the z-direction calculated from the three meshes.

Appendix C. Modified Strouhal number for Re = 100 and 150
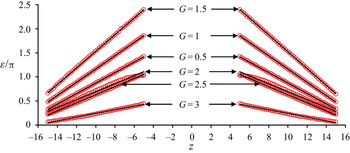
For  $Re = 100$ and 150, the phase ε of the sectional lift coefficient of the cylinder varies with z nearly linearly as shown in figure 35. As a result, the linear trend lines are used to present the variation of ε with z. A symbol
 $\chi $ is used to represent the change rate of ε with respect to z, and it is the same as the average of the values of
 $|\textrm{d}/\textrm{d}z|$ on the negative and positive z parts. Table 3 lists the values of
 $\chi $ for
 $Re = 100$ and 150. The cases
 $Re = 150$ and G = 1 and 1.5 are not included because ε does not follow the linear function of z due to strong vortex dislocation. The variation of phase ε with z is caused by the inclination of vortices. As the result, the inclination angle
 $(\gamma )$ of vortices is correlated with
 $\chi $ by (Williamson Reference Williamson1988a)
 \begin{equation}\textrm{tan(}\gamma \textrm{)} = C\chi ,\end{equation}
where C is a constant that needs to be found out. For a cylinder with inclined vortices, the Strouhal number should be modified as (Williamson Reference Williamson1988a)
 \begin{equation}{S_{tu}} = {S_t}/\cos (\gamma ),\end{equation}
where St and Stu are the Strouhal and modified Strouhal numbers, respectively. Utilising (A1) and the relationship of  $\textrm{cos(}\gamma \textrm{)} = 1/\sqrt {1 + \textrm{ta}{\textrm{n}^2}(\gamma )} $, (A2) is rewritten as
 \begin{equation}S_{tu}^\ast{=} S_t^\ast{\cdot} \sqrt {1 + {{(C\chi )}^2}} ,\end{equation}
where  $S_{tu}^\ast{=} {S_{tu}}/{S_{t0}}$,
 $S_t^\ast{=} {S_t}/{S_{t0}}$ and
 ${S_{t0}}$ is the Strouhal number of an isolated cylinder. To ensure that the normalised Strouhal number
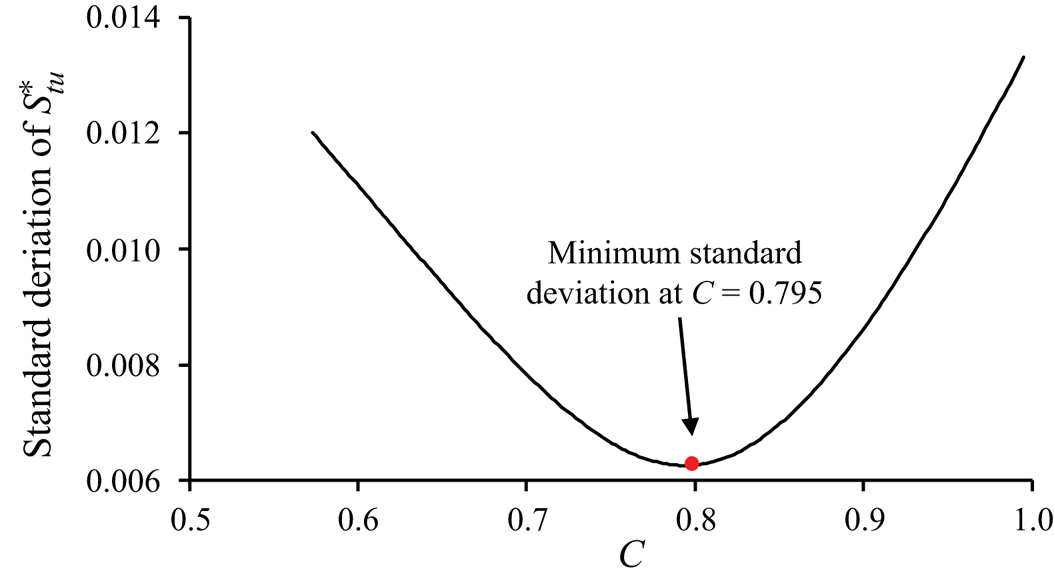
 $(S_{tu}^\ast )$ has minimal dependence on parameter C, its SD calculated from the 10 cases in table 3 must be at its minimum value. Figure 36 shows that the SD of
 $S_{tu}^\ast $ reaches its minimum value at C = 0.795, which is used to calculate Stu in the paper.
Variation of the phase of lift coefficient ε with z for  $Re = 100$. Circular symbols, numerical results; solid lines, linear trend lines.

Variation of the SD of  $S_{tu}^\ast $ with C.

The rate of change of ε (radian) with respect of G for  $Re = 100$ and 150.