Introduction
Climate change threatens sustainable development in deltaic areas of Asia in numerous ways, including increases in salinity, flooding, heavy storms, and coastal erosion (Wassmann et al., Reference Wassmann, Hien, Hoanh, Hoanh and Tuong2004; McGranahan et al., Reference McGranahan, Balk and Anderson2007; Syvitski et al., Reference Syvitski, Kettner, Overeem, Hutton, Hannon, Brakenridge and Day2009; IPCC, 2014). An understanding of past climate changes is critical for predicting the impacts of contemporary climate change on deltaic areas.
The Changjiang (Yangtze) River Delta is one of the largest Asian deltas. The delta has a long history of rice irrigation and water management, which dates to approximately 8.0 cal ka BP (Zong et al., Reference Zong, Chen, Innes, Chen, Wang and Wang2007), coinciding with the delta’s formation (Hori and Saito, Reference Hori and Saito2007; Song et al., Reference Song, Li, Saito, Okuno, Li, Lu, Hua, Li, Li and Nakashima2013). High-resolution climate change reconstructions of the period of 9–7 cal ka BP are necessary to better understand delta formation and human activity in the Yangtze River Delta. However, the high-resolution climate change characteristics from this period remain unclear. Previous studies have attempted to reconstruct paleoclimate change during this period by assuming that it occurred during the Holocene optimum (Wang et al., Reference Wang, Sun and Zhang1979, Reference Wang, Zhang and Jiang1983, Reference Wang, Zhang, Jiang and Han1984; Wang, 1982), which is well supported by research (Liu et al., Reference Liu, Sun and Jiang1992; Yi et al., Reference Yi, Saito, Oshima, Zhou and Wei2003a, Reference Yi, Satio, Zhao and Wang2003b; Jia et al., Reference Jia, Zhang, Sun and Zhang2004; Zhang, Reference Zhang2004; Shu et al., Reference Shu, Wang and Chen2007). However, most Changjiang River Delta sediment cores have been taken from the middle and lower regions, providing limited age data because of the thinness of the sediment layers (e.g., Yi et al., Reference Yi, Saito, Oshima, Zhou and Wei2003a; Liu et al., Reference Liu, Sun, Thomas, Zhang, Finlayson, Zhang, Chen and Chen2015; Miao et al., Reference Miao, Zhang, Lu, Wu, Li, Chen, Li, Miao, Feng and Ou2015) (Fig. 1).
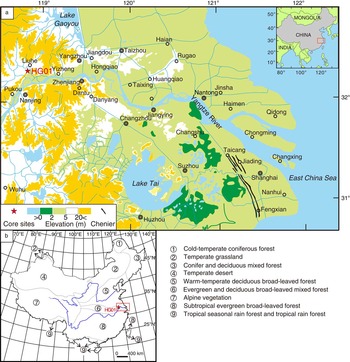
(color online) Geographic map showing the location of core HG01 and the vegetation distribution. (a) Topographic map of the research area (modified from the Bureau of Geology and Mineral Resources, 1978; Song et al., Reference Song, Li, Saito, Okuno, Li, Lu, Hua, Li, Li and Nakashima2013). (b) Vegetation distribution of mainland China (adapted from Lin et al., 1980).

In this study, we performed a high-resolution palynological analysis using a high-resolution sediment core from the apex area of the Changjiang River Delta dating to 9–7 cal ka BP (Fig. 1). We identified pollen sources, refined the types of climate indicators, and used accelerator mass spectrometry (AMS) 14C dating to establish a high-resolution framework to discuss (1) centennial-resolution climate change and (2) potential triggering factors.
Regional Setting
Topography and geomorphology
The Changjiang River originates on the Qinghai-Tibet Plateau and flows into the East China Sea. It is the fifth-largest river in the world in terms of water discharge (921 km3/yr) and the fourth-largest in terms of suspended load (4.8×10⁸ t/yr) (Milliman and Meade, Reference Milliman and Meade1983). Strongly affected by the East Asian summer monsoon (EASM), approximately 70% of its annual discharge and 87% of its sediment load occur during the flood season (May to October) (Hori et al., Reference Hori, Saito, Zhao and Wang2002). Nearly 70% of the sediment is deposited at the river mouth, forming a series of river-mouth sandbars with delta seaward progradation (Milliman et al., Reference Milliman, Shen, Yang and Mead1985; Shen, Reference Shen1998). The Changjiang River Delta occupies an area of approximately 5.2×10⁴ km2, of which 2.9×10⁴ km2 is subaqueous and 2.3×10⁴ km2 is subaerial (Li, Reference Li1986). The elevation of the middle and lower delta plain is generally <5 m (Bureau of Geology and Mineral Resources, 1978; Chen et al., Reference Chen, Zhou, Yang and Wu1987; Hori et al., Reference Hori, Saito, Zhao, Cheng, Wang, Sato and Li2001a, Reference Hori, Saito, Zhao, Cheng, Wang, Sato and Li2001b) (Fig. 1). The elevation is slightly higher, in the range of 5 to 10 m, in the upper region of the Nanjing area, adjacent to the western and southern mountain areas (Bureau of Geology and Mineral Resources, 1978) (Fig. 1).
Climate and vegetation
The research region is characterized as having a subtropical climate that is largely controlled by the EASM (Yi et al., Reference Yi, Satio, Zhao and Wang2003b; Cheng et al., Reference Cheng, Zhao, Gong, Xu, Han, Yin, Tang, He and He2016). In the winter, affected by the Mongolian high pressure system, the climate is cold and dry. The mean temperature is approximately 2.0°C in the coldest month, and the predominant wind is northwesterly. In summer, under the influence of a subtropical high system, the climate is predominantly warm and wet. The mean temperature of the warmest month is 28.9°C, and the dominant wind is a southeasterly wind. The mean annual temperature of the region is 14°C–18°C (Wang et al., Reference Wang, Xu, Lei, Han, Song, Yang and Deng2016). The average precipitation is approximately 1100 mm/yr, of which about half falls in the summer (Academia Sinica, 1985; Yi et al., Reference Yi, Satio, Zhao and Wang2003b; Wang et al., Reference Wang, Xu, Lei, Han, Song, Yang and Deng2016).
The regional vegetation is evergreen and deciduous broad-leaved mixed forest (Fig. 1), and there is a transition zone between the predominantly deciduous broad-leaved forest and predominantly evergreen broad-leaved forest (Lin et al., 1980; Liu et al., Reference Liu, Sun and Jiang1992; Miao et al., Reference Miao, Zhang, Lu, Wu, Li, Chen, Li, Miao, Feng and Ou2015). In the upper region of the Changjiang River Delta plain, deciduous trees belonging to Cupuliferae are predominant, and evergreen trees are sparsely distributed. In particular, trees belonging to the genus Quercus widely occupy the upper region of the Changjiang River Delta plain and the nearby hills. Quercus acutissima and Q. variabilis are the predominant deciduous species (Lin et al., 1980). The conifers Pinus massoniana and P. thunbergii are distributed in the hills adjacent to the upper region of the Changjiang River Delta (Yan et al., Reference Yan, Zhang and Song1995). Marsh and aquatic herbs occupy the floodplain and lacustrine areas, such as Potamogeton spp., Phragmitescommunist, and Zizania caduciflora, among others (Lin et al., 1980; Liu and Huang, Reference Liu and Huang1982, Reference Liu and Huang1987).
Materials and Methods
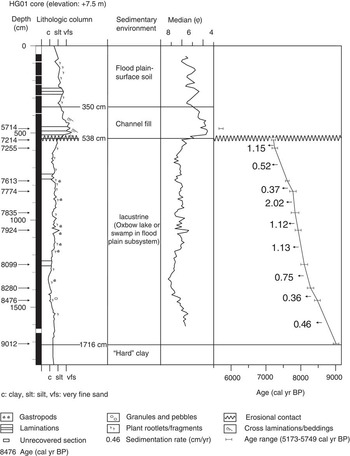
Core HG01 was drilled from the upper region of the Changjiang River Delta plain by East China Normal University (ECNU) in 2009 (Fig. 1). The core site is located at 32°17.35′N, 118°48.15′ E, at an elevation of 7.5 m. The length of the core was 2320 cm, and recovery was 98.3%. Sediments in the core consist of clayey silt and silt. The Holocene deposits contain three units: floodplain facies (1716–538 cm in depth), channel-fill facies (538–350 cm in depth), and floodplain to surface soil facies (350–0 cm in depth) (Fig. 2).
Lithological column, age–depth relationship, and sedimentary environment recorded in core HG01 (adapted from Song et al., Reference Song, Li, Saito, Okuno, Li, Lu, Hua, Li, Li and Nakashima2013). “Median” denotes median grain size.

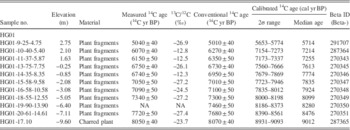
The core was subsampled in the State Key Laboratory of Estuarine and Coastal Research, ECNU, China. Eleven AMS 14C dates were measured using selected plant fragments or charred materials by Beta Analytic Inc. (Table 1). The age determinations were based on the Libby half-life of 5568 yr. The conventional radiocarbon ages were calibrated using Calib 7.0 (http://calib.Qub.ac.uk/calib/calib.html) and the Reimer et al. (Reference Reimer, Bard, Bayliss, Beck, Blackwell, Ramsey and Buck2013) data set. The other ages were calculated by linear interpolation between the age and depth, as expressed by a two-point model (Fig. 2). We also used Bacon 2.2 (Blaauw and Christern, Reference Blaauw and Christen2011, Reference Blaauw and Christen2013) to calibrate the age data, which is described in detail in the Supplementary Material.
Summary of radiocarbon dates obtained from the cores of HG01 (from Song et al., Reference Song, Li, Saito, Okuno, Li, Lu, Hua, Li, Li and Nakashima2013).

Notes: 13C/12C and conventional 14C were measured by Beta Analytic Inc. using an accelerator mass spectrometer. Calibrated 14C ages were calculated using Calib 7.0 (http://calib.qub.ac.uk/calib/calib.html) and the Reimer et al. (Reference Reimer, Bard, Bayliss, Beck, Blackwell, Ramsey and Buck2013) data set. NA: The original sample was too small to provide a 13C/12C ratio on the original material. However, a ratio including both natural and laboratory effects was measured during the 14C detection to calculate the true conventional radiocarbon age.
One hundred forty-one samples were obtained at intervals of approximately 8 cm, and each sample had a thickness of 2 cm. Grain-size analysis was conducted using a Malvern 2000 instrument.
Two hundred fifty-three samples were taken from the upper part of the core (above a depth of 1716 cm) for palynological analysis: 216 samples at intervals of approximately 3 cm from the section between 1716 and 538 cm in depth and 37 samples at intervals of 8 cm from depths of above 538 cm. Each sample was 2 cm thick, and 6 mL of each sample was taken for preparation in the lab. All of the samples were chemically treated according to the procedure outlined by Faegri and Iversen (1989). Prior to treatment, the samples were dried and weighed, and exotic Lycopodium spores were added to help calculate the palynological concentrations. The samples were then treated with dilute 15% HCl to remove carbonates, 45% HF to dissolve siliceous materials, and 15% NaOH to deflocculate the matrix and liberate the microscopic biological remains, and finally, a 9:1 mixture of acetic anhydride and concentrated sulfuric acid was applied. The residues were sieved through a 10 μm mesh to eliminate small particles. Pollen and spore counts were performed using a Nikon microscope at 400× magnification and, in some cases, at 1000× magnification when identification was difficult. More than 200 grains were counted for every sample in this study (Rull, Reference Rull1987; Pearsall, 2015). Meanwhile, the number of exotic Lycopodium spores was recorded. If the pollen concentration was too low, pollen counting was stopped after a total of 300 Lycopodium spores were tallied. Palynological identification was based on modern reference pollen from the State Key Laboratory of Estuarine and Coastal Research at ECNU and the Nanjing Institute of Geology and Palaeontology at the Chinese Academy of Sciences, as well as on plates in the sources Academia Sinica (1976, 1979), Xi and Ning (Reference Xi and Ning1994), Wang et al. (Reference Wang, Chien, Zhang and Yang1997), and Mao et al. (Reference Mao, Wang, Shu and Yang2011).
The average resolution of the grain size and pollen samples during the period of 9.0–7.2 cal ka BP was approximately 13 yr and 7–8 yr, respectively. The resolution was higher (2–5 yr) in the period of 8093–7776 cal yr BP, when climate change was reconstructed.
Results and Discussion
Palynological assemblages and the sedimentary environment
Key pollen sources in a floodplain system including a lacustrine subenvironment
According to sedimentary facies analysis of core HG01, the sedimentary environment during the period of 8560–7220 cal yr BP was lacustrine, which followed a crevasse splay that occurred prior to 8560 cal yr BP within a floodplain system (Fig. 2) (Song et al., Reference Song, Li, Saito, Okuno, Li, Lu, Hua, Li, Li and Nakashima2013). In contrast with other closed lake environments, a lacustrine subenvironment in a floodplain system is characterized by periodic impacts from flooding.
The floodplain system is an extremely challenging environment for plants. Trees or shrubs in the floodplain must be able to withstand being partially covered by water and water-deposited sediments (Bayley, Reference Bayley1995; Liu et al., Reference Liu, Li, Li, Yuan and Davy2006; Egger et al., Reference Egger, Politti, Lautsch, Benjankar, Gill and Rood2015; Thapa et al., Reference Thapa, Thoms, Parsons and Reid2016). In the modern Changjiang River Delta area, meadow rather than forest occupies the floodplain during the dry period, when the floodplain is exposed. Aquatic herbaceous plants are able to occupy swamps or lacustrine subenvironments (Xu et al., Reference Xu, Yang, Wu, Meng and Wang1996; Liu et al., Reference Liu, Li, Li, Yuan and Davy2006). Therefore, the local pollen on the floodplain system is derived mainly from herbs, whereas arboreal pollen (AP) is transported by wind or rivers from regional (hill or highland) vegetation along the drainage area (Xu et al., Reference Xu, Yang, Wu, Meng and Wang1996).
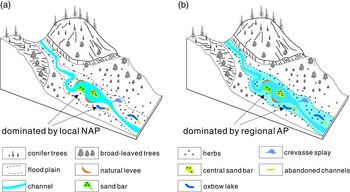
Thus, the pollen in sediment core HG01 has two sources: (1) during a dry period, the palynological records are dominated by nonarboreal pollen (NAP) from local grasslands or aquatic vegetation (Wang, 1982; Wang et al., Reference Wang, Zhang and Sun1982; Xu et al., Reference Xu, Yang, Wu, Meng and Wang1996) and AP, such as the pollen of Pinus and Quercus, transported by wind from the regional vegetation; (2) during a flood period, pollen and spores are transported primarily from regional vegetation by a river or wind and deposited together with the sediments (Fig. 3). Consequently, pollen preserved in floodplain sediments generally exhibits the pattern in (2), in which regional AP rather than local NAP is predominant (Yi et al., Reference Yi, Satio, Zhao and Wang2003b; Li et al., Reference Li, Satio, Matsumoto, Wang, Haruyama, Hori and Doanh2006a, Reference Li, Saito, Matsumoto, Wang, Tanabe and Vue2006b, Reference Li, Saito, Mao, Tamura, Li, Song, Zhang, Lu, Sieng and Li2012). Pollen records dominated by local NAP, reflecting the situation described in (1) appear only in some thin layers (Fig. 4). These characteristics are consistent with the present palynological distribution patterns in the Changjiang River Delta plain system reported by Wang (1982) and Wang et al. (Reference Wang, Zhang and Sun1982), and the pollen resource is similar to that reported by Xu et al. (Reference Xu, Yang, Wu, Meng and Wang1996) and Xu et al. (Reference Xu, Tian, Bunting, Li, Ding, Cao and He2012). These researchers found that the NAP content in the surface sediments of the swamps of the Changjiang River Delta plain was higher than 50%, surpassing the AP content, whereas the NAP content in the surface sediments of the channel and the floodplain was less than that of AP (Wang, 1982; Wang et al., Reference Wang, Zhang and Sun1982). In addition, the palynological concentrations in the swamp and lacustrine environments were higher than those in the floodplain environment because the former are likely to receive contributions of primarily local pollen and spores (Wang et al., Reference Wang, Zhang and Sun1982).
(color online) Schematic diagram of the potential pollen sources and the characteristics of palynological assemblages in the sediments of a floodplain system. (a) Palynological grains preserved in the sediments are dominated by the types of local herbs in a dry or normal flow period. (b) Palynological grains preserved in the sediments are dominated by types from the regional forest in a flooding period. “AP” and “NAP” denote the arboreal pollen and nonarboreal pollen, respectively.

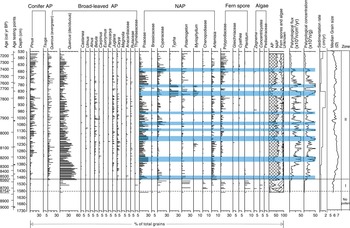
(color online) Pollen diagram of the grouped principal components from core HG01. Asterisk denotes the age determined by the relationship between the depth and the test age data.

Palynological records of the sedimentary environment
To acquire detailed information regarding the sedimentary environment, the component contents of both pollen and fern spores were calculated as percentages based on the total counted grains. The palynological diagram shows the changes in palynological assemblages in the five groups corresponding to conifer AP, broad-leaved AP, NAP, fern spores, and algae (Fig. 4). Here, Quercus pollen mainly consists of Quercus acutissima-morph and Q. glauca-morph. The former was contributed by deciduous trees of Q. acutissima, and the latter originated from evergreen broad-leaved trees of Q. glauca in this region. Therefore, based on the surface characteristics (Jarvis et al., Reference Jarvis, Leopold and Liu1992; Liu et al., Reference Liu, Zetter, Ferguson and Mohr2007), we separated the Quercus pollen from the sediment cores into Quercus (deciduous) and Quercus (evergreen). The palynological concentration was determined as the number of grains per gram of dry sample, and the palynological flux was determined as the yielded grains per square centimeter per year.
In the bottom (1716–1590 cm in depth) and upper (524–69 cm in depth) parts of the Holocene sediments in core HG01, the palynological concentrations were less than 0.5×10³ n/g. A zone of “no pollen” in the pollen diagrams suggests that the number of pollen grains counted was too low to be analyzed statistically (Fig. 4) (Newman et al., Reference Newman, Thurber, Zeiss, Rokach and Musih1969; Jie et al., Reference Jie, Wang, Guo, Lu and Li2004). A sediment hiatus occurred at a depth of 538 to 524 cm, where the sedimentary facies changed. Thus, to reduce the influence on the interpretation of pollen assemblages caused by the change in the sedimentary environment, we emphasized the pollen records in the section between 1590 cm and 538 cm in depth. In this section, the palynological concentrations fluctuate from hundreds to tens of thousands of grains per gram (Fig. 4). Based on the pollen components and assemblages, as well as CONISS analysis (Grimm, Reference Grimm1987, Reference Grimm1993), we divided the record into palynological zone I and palynological zone II (Fig. 4).
Palynological zone I (8750–8560 cal yr BP, depth of 1590–1500 cm)
This zone is primarily characterized by a low AP content (approximately 18%), which was contributed by Quercus (deciduous). The Pinus pollen content was approximately 2%. There is a high proportion of NAP, at a percentage of approximately 50%, within which the dominant components of Cyperaceae and Potamogeton pollen are approximately 10% and 25%, respectively. The percentage of fern spores and freshwater algae is approximately 31%, contributed mainly by spores of Polypodium (~13%) and Pteridium (~6%), as well as algae of Zegnema or Pediastraceae (more than 5% in some samples). Concentricystes also occurs in small amounts. The palynological concentration and flux are approximately 0.6–2.0×10³ n/g and 0.6–1.6×10³ n/cm2/yr.
The sediments predominantly consist of clayey silts, and the average median grain size is approximately 5.8 φ. These sediments were interpreted as being deposited as part of a floodplain system (Fig. 2 and 4). The palynological concentrations are very low, but the content of the fern spores is very high, reaching approximately 40%. Fern spores are likely to have been transported and enriched during flotation in water (Xu et al., Reference Xu, Yang, Wu, Meng and Wang1996; Sun et al., Reference Sun, Li and Beug1999; Li et al., Reference Li, Zhang, Li, Li, Liu, Fan and Li2008; Yang et al., Reference Yang, Li, Liu, Li, Wen, Ye, Yi and Chen2016). Therefore, the high percentages of fern spores reflect an environment with strong hydrodynamic effects, which can be further related to a local crevasse splay. The high contents of Potamogeton and Cyperaceae pollen are associated with plants on natural levees.
Palynological zone II (8560–7220 cal yr BP, depth of 1500–538 cm)
Pollen zone II shows a rapid increase of AP (~50%), whereas both the NAP and fern spores decrease to approximately 40% and 8%, respectively. The Pinus pollen content increases gradually from 3% to 30%, but the Quercus (deciduous) content decreases gradually from 45% to 10%. Quercus (evergreen) is present in lower but relatively stable amounts of approximately 10% to 20%, showing a slight increase. Small amounts of Castanopsis, Ulmus, Betula, Carpinus, Juglans, and Carya appear occasionally. Within NAP, the dominant component of Poaceae increases to 10%–30%, but Potamogeton decreases to less than 14% and then increases gradually to 20%. The contents of both Cyperaceae and Typha vary within large ranges, exceeding 25% in some layers. Artemisia increases to more than 5%. Brassicaceae, Myriophyllum, Chenopodiaceae, Asteraceae, and others occur in trace amounts. The contents of fern spores are sharply decreased and are contributed primarily by Polypodiaceae, which increases gradually from less than 5% to more than 15%. There are also small amounts of Pteris, Gleicheniaceae, Cyathea, Microlepia, Pteridium, and freshwater algae of Zegnema and Concentricystes. The palynological concentration and flux are approximately 8×10³ to 60×103 n/g and 5×10³ to 90×103 n/cm2/yr, respectively. The average sediment accumulation rate is approximately 0.96 cm/yr, and the median grain size of the sediments is approximately 6.3 φ.
In this period, the palynological concentrations increased rapidly to approximately 10 times those of the previous period. AP increased and generally remained at high content levels, whereas fern spores and freshwater algae decreased to only ~8%. The palynological assemblage is similar to that in the surface sediment of wetland areas influenced by fluvial action in the floodplain (Wang et al., Reference Wang, Zhang and Sun1982). The sedimentation rate is positively correlated with the palynological concentration and flux (Fig. 4), indicating that water played a critical role in the general dispersion of pollen (Wang et al., Reference Wang, Zhang and Sun1982; Li et al., Reference Li, Zhang, Li and Zhao2010; Xu et al., Reference Xu, Tian, Bunting, Li, Ding, Cao and He2012). The regional assemblages dominated by Pinus and Quercus pollen reflect a general fluvial impact, which is distinct from that of crevasse splay. However, it is also notable that the pollen of Cyperaceae, Typha, Potamogeton, and Myriophyllum more often appeared to be dominant components of the NAP after 8.0 cal ka BP (Fig. 4). With abundant plant fragments and clayey silt sediment, the sedimentary environment was likely similar to a lacustrine or oxbow lake environment that remained relatively stable but was subject to periodic influence from fluvial processes with decelerated sea-level rise (Song et al., Reference Song, Li, Saito, Okuno, Li, Lu, Hua, Li, Li and Nakashima2013). As indicated by both the predominant components of NAP and high NAP contents, the local vegetation at the core HG01 site may have been overtaken by dominant plants belonging to Poaceae, Potamogeton, and Artemisia at approximately 8540–8460 cal yr BP; Poaceae at 8230–8190, 8050–8020, and 7980–7970 cal yr BP; Cyperaceae and Poaceae at approximately 7940–7920 cal yr BP; Typha and Myriophyllum at 7760–7720 and 7670–7600 cal yr BP; and Cyperaceae at 7420–7380 cal yr BP (Fig. 4).
Pollen record of climate change
Key pollen indicators of climate change
In our sediment core HG01, both Quercus and Pinus pollen are predominant pollen types among the AP. In general, in contrast with Pinus pollen, Quercus pollen is primarily deposited near parent plants, and only small amounts can be transported beyond the forest by wind (Wang, 1982; Brush and Brush, Reference Brush and Brush1994; Moss et al., Reference Moss, Kershaw and Grindrod2005; Beaudouin et al., Reference Beaudouin, Suc, Escarguel, Arnaud and Charmasson2007). In addition, Quercus pollen and other non-Pinus pollen are rarely sorted and enriched in a water system (Xu et al., Reference Xu, Yang, Wu, Meng and Wang1996; Beaudouin et al., Reference Beaudouin, Suc, Escarguel, Arnaud and Charmasson2007), such as that involved in river transportation, which may reflect regional vegetation along the river discharge area (Brush and Brush, Reference Brush and Brush1994; Smirnov et al., Reference Smirnov, Chmura and Lapointe1996; Moss et al., Reference Moss, Kershaw and Grindrod2005; Beaudouin et al., Reference Beaudouin, Suc, Escarguel, Arnaud and Charmasson2007; Dai et al. Reference Dai, Weng, Lu and Mao2014, Reference Dai, Weng and Mao2015; Dai and Weng, Reference Dai and Weng2015). Therefore, Quercus pollen rather than Pinus pollen was used here as an indicator of regional vegetation and climate change. We further identified Quercus (deciduous) and Quercus (evergreen) as indicators of slightly cooler and slightly warmer conditions, respectively (Kotthoff et al., Reference Kotthoff, Pross, Müller, Peyron, Peyron, Schmiedl, Schulz and Bordon2008). Considering that NAP is usually deposited in situ (Wang, 1982; Xu et al., Reference Xu, Yang, Wu, Meng and Wang1996), which may interfere with the regional vegetation records, we performed a further, separate calculation of the percentages of Quercus (deciduous) and Quercus (evergreen) on the basis of only AP for use as proxies of regional climate (Fig. 5).
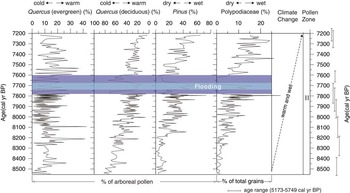
(color online) General climate change and two brief cold and dry events (outer horizontal bars) during 8560–7220 cal ka BP, with a short-term extreme flooding period (inner horizontal bar) recorded in sediment core HG01.

Pinus pollen is one of the main components in the sediment core. It reaches as high as 20% of the total counted grains (Fig. 4) and 60% of the AP (Fig. 5). There may be two factors affecting the percentage of Pinus pollen: (1) climate change may result in an increase or decrease of Pinus trees in the vegetation or vegetation belt migration (Li et al., Reference Li, Lu, Zhu, Wu, Wang and Lu2011), and (2) pollen dispersal may be influenced by the sedimentary environment (Wang et al., Reference Wang, Zhang and Sun1982; Li et al., Reference Li, Satio, Matsumoto, Wang, Haruyama, Hori and Doanh2006a, Reference Li, Zhang, Li and Zhao2010).
An increase of Pinus pollen in a less water-sorted environment is generally interpreted as indicating a cooler climate. However, in marine or fluvial environments, where hydrodynamic action is much stronger than it is in an enclosed lake or other types of environments, Pinus pollen is likely to be concentrated by flotation in water because of its two bladders (Hopkins, Reference Hopkins1950; Florin, Reference Florin1963; Xu et al., Reference Xu, Yang, Wu, Meng and Wang1996; Bush, Reference Bush2000; Hicks, Reference Hicks2001; Patrick et al., Reference Patrick, Moss, Kershaw and Grindrod2005; Beaudouin et al., Reference Beaudouin, Suc, Escarguel, Arnaud and Charmasson2007). In such cases, Pinus pollen may be an indicator of hydrodynamic conditions rather than climate change (Xu et al., Reference Xu, Yang, Wu, Meng and Wang1996; Sun et al., Reference Sun, Li and Beug1999; Li, Reference Li2009; Dai et al. Reference Dai, Weng, Lu and Mao2014, Reference Dai, Weng and Mao2015; Dai and Weng, Reference Dai and Weng2015). Therefore, in this study, Pinus pollen could be a sensitive indicator of fluvial action. To avoid effects because of local NAP and fern spores, the Pinus pollen content was further calculated as a percentage of AP and taken to be an indicator of flooding events that occurred during the wet period (Fig. 5).
Fern spores are also likely to be enriched during flotation by water (Xu et al., Reference Xu, Yang, Wu, Meng and Wang1996; Sun et al., Reference Sun, Li and Beug1999; Yang et al., Reference Yang, Li, Liu, Li, Wen, Ye, Yi and Chen2016), but different from Pinus pollen, wind has less influence on spore dispersion (Beaudouin et al., Reference Beaudouin, Suc, Escarguel, Arnaud and Charmasson2007; Li et al., Reference Li, Saito, Mao, Tamura, Li, Song, Zhang, Lu, Sieng and Li2012). We chose Polypodiaceae spores, a predominant component among fern spores, as a supplementary indicator of precipitation or dry/wet conditions.
In contrast, a high content of herb pollen can serve as a proxy for the exposed floodplain environment or a marsh/lacustrine environment because during dry periods, grass and other herbs will occupy the exposed floodplain or wetlands without river inputs.
General climate change reflected by the pollen records
Regional climate reconstruction focused on the period from 8560 to 7220 cal yr BP (palynological zone II) because the sedimentary environment during this period was consistently lacustrine with periodic influences from river inputs (Fig. 5). In general, Quercus (evergreen) pollen increased from ~10% to ~20%, whereas Quercus (deciduous) decreased from ~80% to ~15% (Fig. 5). These trends suggest a general warming climate.
The general strengthened influence of runoff or the intensified hydrodynamic condition is suggested by increases in both Pinus pollen and Polypodiaceae spores in this period (Fig. 5) (Xu et al., Reference Xu, Yang, Wu, Meng and Wang1996, Reference Xu, Tian, Bunting, Li, Ding, Cao and He2012; Sun et al., Reference Sun, Li and Beug1999). The runoff of the Changjiang River is positively associated with regional precipitation (Chen et al., Reference Chen, Wu, Finlayson, Michael, Wei, Li and Chen2014). Hence, the intensified hydrodynamic conditions in this period should be the result of increased precipitation or flooding.
The generally warm and wet climate in this area also matches the records in adjacent areas and other regions, such as the central and the southeastern parts of China (Liew et al., Reference Liew, Lee and Kuo2006; Zhao et al., Reference Zhao, Yu, Chen, Zhang and Yang2009; Wang et al., Reference Wang, Shu, Wei and Ding2010; Xu et al., Reference Xu, Lu, Wu and Liu2010; Zhu et al., Reference Zhu, Ma, Yu, Tang, Zhang and Liu2010; Yue et al., Reference Yue, Zheng, Huang, Chevalier, Chase, Carré, Ledru and Cheddadi2012).
Brief climate fluctuations reflected by pollen records
The general warming and wetting climate trends were interrupted by several brief climate fluctuations, such as 7780–7740 cal yr BP and 7670–7600 cal yr BP, and the cold periods were reflected by sharp increases in Quercus (deciduous) of up to more than 50% of the AP. Decreases in Pinus pollen (<15%) and Polypodiaceae spores (<5%) in the AP suggest lower precipitation conditions, associated with the weakened influence of the force of water or flooding. Additionally, frequent flooding may have occurred from 7740 to 7670 cal yr BP, as shown by the sharp increases in Pinus pollen and Polypodiaceae spores along with coarsening sediments (Fig. 5).
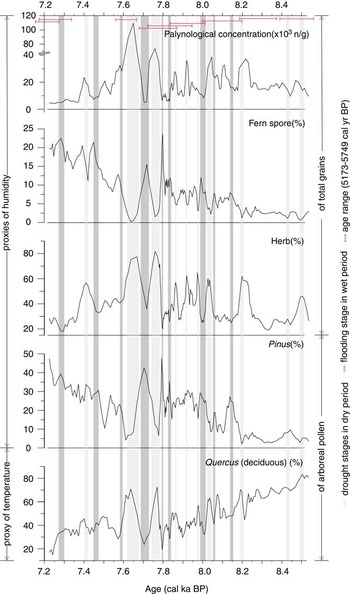
As discussed in “Key pollen indicators of climate change,” the alternation of the flooding and lacustrine conditions may be reflected by the regional Pinus pollen and local NAP herb contents, as well as the palynological concentration and fern spore contents. Flood deposition is accompanied by high contents of regional Pinus pollen and fern spores, along with a lower herb content and palynological concentration (Li et al., Reference Li, Saito, Mao, Tamura, Li, Song, Zhang, Lu, Sieng and Li2012); drought deposition exhibits the opposite characteristics. A number of such short-term flooding stages in wet period/drought stages in the dry period can be observed in the palynological records (Fig. 6). The short-term events are closely linked with the wet/dry climate change inferred from the centennial fluctuation of Quercus (deciduous) as a percentage of AP (Fig. 6).
(color online) Changes in climate proxies in different periods. The data of all the proxies were processed using a 3-point running average.

Possible reason for climate change and brief climate fluctuation
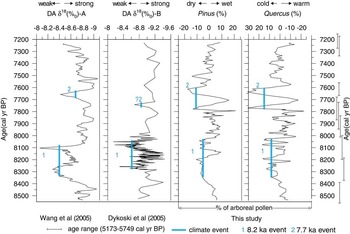
The Holocene climate fluctuated between warm versus cool and wet versus dry periods (Overpeck et al., Reference Overpeck, Rind, Lacis and Healy1996; Bond et al., Reference Bond, Showers, Cheseby, Lotti, Almasi, deMenocal, Priore, Cullen, Hajdas and Bonani1997; deMenocal et al., Reference deMenocal, Ortiz, Guilderson and Sarnthein2000; Leira and Santos, Reference Leira and Santos2002). With advances in dating techniques, many studies have focused on high-resolution climate reconstructions, studying climate changes in as much detail as possible—for example, at annual or decadal time scales (Wang et al., Reference Wang, Cheng, Edwards, He, Kong, An, Wu, Kelly, Dykoski and Li2005). Our records show that the climate was generally warm and wet with several brief climate fluctuations during 8560–7220 cal yr BP. Then, after the data were detrended, our data suggested two climate events of 8.2 ka and 7.7 ka that closely matched data from Dongge Cave (Dykoski et al., Reference Dykoski, Edwards, Cheng, Yuan, Cai, Zhang, Lin, Qing, An and Revenaugh2005; Wang et al., Reference Wang, Cheng, Edwards, He, Kong, An, Wu, Kelly, Dykoski and Li2005) (Fig. 7). This suggests a possible correlation between the climate changes at the Dongge Cave and Changjiang River Delta regions at approximately 9–7 cal ka BP. The climate change at the Changjiang River Delta is affected by the EASM (Shi et al., Reference Shi, Lu and Zhu1996; Yi et al., Reference Yi, Saito, Oshima, Zhou and Wei2003a, Reference Yi, Satio, Zhao and Wang2003b). Therefore, we also suggest that perhaps the climate change of 9–7 cal ka BP at Dongge Cave and the Changjiang River Delta was mainly affected by the EASM. The general warming period may be associated with an intensified EASM, which is supported by Shi et al. (Reference Shi, Lu and Zhu1996).
(color online) Comparison of climate change during 8560–7220 cal ka BP. DA δ18 (‰) A (Wang et al., Reference Wang, Cheng, Edwards, He, Kong, An, Wu, Kelly, Dykoski and Li2005); DA δ18 (‰) B (Dykoski et al., Reference Dykoski, Edwards, Cheng, Yuan, Cai, Zhang, Lin, Qing, An and Revenaugh2005). These data of DA δ18 (‰) A (Wang et al., Reference Wang, Cheng, Edwards, He, Kong, An, Wu, Kelly, Dykoski and Li2005) and DA δ18 (‰) B (Dykoski et al., Reference Dykoski, Edwards, Cheng, Yuan, Cai, Zhang, Lin, Qing, An and Revenaugh2005) were processed using a 3-point running average. For better understanding of the climate events, the pollen data in this study were processed by detrend (residual) and 3-point running average. “Strong” and “weak” denote the strengthened and weakened East Asian summer monsoon, respectively.

Dykoski et al. (Reference Dykoski, Edwards, Cheng, Yuan, Cai, Zhang, Lin, Qing, An and Revenaugh2005) suggested that solar changes were important controls of the Holocene monsoon at the Dongge Cave area; thus, solar activity may also be an important factor driving the centennial climate change in the Yangtze Delta region at 9–7 cal ka BP.
The 8.2 ka cold period
Brief cooling events of ~8.2 cal ka BP have been occasionally reported (Adhikari et al., Reference Adhikari, Kumon and Kawajiri2002; Dykoski et al., Reference Dykoski, Edwards, Cheng, Yuan, Cai, Zhang, Lin, Qing, An and Revenaugh2005; Wang et al., Reference Wang, Cheng, Edwards, He, Kong, An, Wu, Kelly, Dykoski and Li2005) and have also been recorded in other EASM areas, such as the Okinawa Trough (Sun et al., Reference Sun, Oppo, Xiang, Liu and Gao2005), Dajiuhu (Zhu et al., Reference Zhu, Ma, Yu, Tang, Zhang and Liu2010), and Lake Aoki (Adhikari et al., Reference Adhikari, Kumon and Kawajiri2002).
Our records show that two possibilities exist for an event that correlates with the “8.2 ka Event” in Greenland and is similar to the Dongge Cave records (Dykoski et al., Reference Dykoski, Edwards, Cheng, Yuan, Cai, Zhang, Lin, Qing, An and Revenaugh2005; Wang et al., Reference Wang, Cheng, Edwards, He, Kong, An, Wu, Kelly, Dykoski and Li2005; Fig. 7, climate event 1). The events occurred between 8.3 and 8.0 cal ka BP. The 8.2 ka events recorded in Dongge Cave are centered at 8.26 ka, 8.08 ka (Dykoski et al., Reference Dykoski, Edwards, Cheng, Yuan, Cai, Zhang, Lin, Qing, An and Revenaugh2005), and 8.4–8.1 ka (Wang et al., Reference Wang, Cheng, Edwards, He, Kong, An, Wu, Kelly, Dykoski and Li2005). Although the records from Dongge Cave and the Changjiang River Delta have slightly different timing, it is possible that one of the events observed in the EASM area ~8.2 ka is correlated with the event in Greenland.
The 8.2 ka events recorded in the GISP2 and NGRIP cores occurred at 8210 ± 160 yr and 8200 ± 30 yr, respectively (Johnsen et al., Reference Johnsen, Dahl-Jensen, Gundestrup, Steffensen, Clausen, Miller, Masson-Delmotte, Sveinbjornsdottir and White2001; Dykoski et al., Reference Dykoski, Edwards, Cheng, Yuan, Cai, Zhang, Lin, Qing, An and Revenaugh2005). The dating uncertainties preclude making a precise correlation, but the Greenland/EASM area correlations suggest a close relationship between the EASM and Greenland climate during the early Holocene, which is supported by Dykoski et al. (Reference Dykoski, Edwards, Cheng, Yuan, Cai, Zhang, Lin, Qing, An and Revenaugh2005) and Wang et al. (Reference Wang, Cheng, Edwards, He, Kong, An, Wu, Kelly, Dykoski and Li2005).
Conclusions
To predict the impacts of climate change on the Changjiang (Yangtze) River Delta, high-resolution climate reconstructions of 9–7 cal ka BP are necessary. Core HG01 from the upper region of the Changjiang River Delta plain includes a period with high sediment accumulation rates of approximately 0.3–1.8 cm/yr. Based on palynological analyses and high-resolution AMS 14C ages, together with information about the sedimentary environment, we reconstructed climate changes for the period of 8560–7220 cal yr BP. After analyzing the potential pollen sources, Quercus (evergreen) and Quercus (deciduous) were selected for use as proxies of warm and cold conditions, respectively. Pinus pollen and Polypodiaceae spores were designated as proxies of flooding and precipitation, respectively. A decrease in Quercus (deciduous) and increases in Quercus (evergreen), Pinus, and Polypodiaceae during 8560–7220 cal yr BP suggest that the climate was generally warm and wet. However, there were several brief climate fluctuations.
The floodplain system included subenvironments with alternating lacustrine and flood deposits, which were caused by climate changes in the Changjiang River Delta area. The shifts were clearly reflected in the regional palynological assemblages dominated by AP and local assemblages of the predominant NAP. The key indices of the Quercus (deciduous), Pinus, herbs, fern spores, and palynological concentrations showed short-term flooding stages/drought stages that are closely linked with the centennial wet/dry periods.
We suggest that the climate changes of the Dongge Cave and Changjiang River Delta regions were mainly affected by EASM during 9–7 cal ka BP. The period of general warming may be associated with an intensified EASM, and the solar activity may also be an important driving factor of centennial climate change.
The ~8.2 ka event was also recorded in the Changjiang River Delta region and is correlated closely with findings from Dongge Cave and Greenland, suggesting that there was a close relationship between the EASM and Greenland climate during the early Holocene.
Acknowledgments
This work was supported by the Chinese Natural Science Foundation (Nos. 41076034 and 41401230), the Creative Research Groups of China (No. 40721004), the 111 Project and the 908 Special Project of the State Oceanic Administration (No. 908-02-01-04), and the Ministry of Science and Technology (Grant No. SKLEC-009KYYN02), and as a Basic Research Project (GP2016-025) of Korea Institute of Geoscience and Mineral Resource funded by the Ministry of Science, ICT, and Future Planning. We thank Ms. F. Zhang, Dr. L. Ye, Ms. Y. Liu, Dr. Y. Yang, and Dr. Z. Yang from the State Key Laboratory of Estuarine and Coastal Research, East China Normal University, for their help with the fieldwork and subsampling.
Supplementary material
To view supplementary material for this article, please visit https://doi.org/10.1017/qua.2017.1