


1 Introduction
Panjer's algorithm is designed to compute efficiently the density of sums of the form  $$$ S\, = \,\mathop{\sum}\nolimits_{{\rm{1}}\leq i\leq N} {{X}_i} $$$
, where the Xis are i.i.d. positive random variables and N is random, with a density {pn} that follows the recurrence relation
 $$ {{p}_n}\, = \,{{p}_{n{\rm{ - 1}}}}(a\, + \,b/n)\; \; \; \; \:{\rm{for}} \ n\,\geq \,{\rm{1}}\:, $$
p 0 being such that  $$$ \mathop{\sum}\nolimits_{n\geq {\rm{0}}} {{p}_n}\, = \,{\rm{1}} $$$
. If the Xis are strictly positive integer-valued random variables with density {fn}, then the density {gn} of S may be recursively computed as
 $$ {{g}_{\rm{0}}}\, = \,{{p}_{\rm{0}}},\; \; \; \; {{g}_n}\, = \,\mathop{\sum}\limits_{1\leq i\leq n} {{f}_i}{{g}_{n{\rm{ - }}i}}(a\, + \,ib/n)\; \; \; \; \:{\rm{for}}\,n\,\geq \,{\rm{1}}, $$
(see Panjer, Reference Panjer1981). This is a very efficient procedure, which has excellent numerical stability properties.
The distributions that satisfy (1) belong to a restricted set of families consisting of Poisson, binomial and negative binomial distributions (see Sundt & Jewell, Reference Sundt and Jewell1981). Much effort has been spent to extend Panjer's algorithm to other distributions for N. In particular, its extension to Phase-type (PH) distributions is of great interest: since they are dense in the class of distributions on  $$$ {\Bbb N} $$$
, this significantly increases the applicability of Panjer's algorithm.
Phase-type distributions have been introduced by Neuts (Reference Neuts1975, Reference Neuts1981) and they may be defined algebraically as follows: consider a density vector α of order m and a sub-stochastic matrix T of order m such that I−T is nonsingular, and define a sequence {vn} of row vectors with
 $${{\bi v}_{\rm{1}}}\, = \,{\bf {{\bialpha }}}(I{\rm{ - }}T),\; \; \; \; \; \; \; \; {{\bi v}_n}\, = \,{{ \bi v}_{n{\rm{ - 1}}}}T\; \; \; \; \:{\rm{for}}\,n\,\geq \,{\rm{2}}.$$
The density  $$$ {{p}_{\rm{0}}}\, = \,{\rm{1}}\,{\rm{ - }}\,\bialpha {\bf {{1}}} $$$
,
 $$$ {{p}_n}\, = \,{{\bi v}_n}{\bf {{1}}} $$$
, for
 $$$ n\,\geq \,{\rm{1}} $$$
, where 1 is a column vector of ones, is said to be of phase-type, with representation (α,T). There is a clear similarity between (1) and (3), which suggests that the recursion (2) might be adapted to provide an efficient and numerically stable algorithm to compute the density of S when N has a PH distribution. This is done in two recent papers, Wu & Li (Reference Wu and Li2010) and Siaw et al. (Reference Siaw, Wu, Pitt and Wang2011). The former defines the generalized (a,b,0) family as
 $${{p}_n}\, = \,{{{\bigamma }}}{{P}_n}{\bf {{1}}}\; \; \; \; \:{\rm{for}}\,n\,\geq \,{\rm{0}},$$
where the matrices {Pn} of order m are recursively defined as follows:
 $${{P}_n}\, = \,{{P}_{n{\rm{ - 1}}}}\Big(A\, + \,\frac{{\rm{1}}}{n}B\Big)\; \; \; \; \:{\rm{for}}\,n\,\geq \,{\rm{1}}.$$
The parameters are the matrices A, B, P 0 and the vector  $$$\bigamma$$$
, which is assumed to be nonnegative and normalized, so that
 $$$\bigamma {\bf 1}=1$$$
.
Siaw et al. (Reference Siaw, Wu, Pitt and Wang2011) define the generalized (a,b,1) family, the difference being that the recursion (5) starts at n = 2, and the parameters are A, B, P 1 and p 0, while the matrix P 0 becomes irrelevant. The PH (α,T) distribution belongs to the generalized (a,b,1) family, with A = T, B = 0,  $$$ {{p}_{\rm{0}}}\, = \,{\rm{1}}\,{\rm{ - }}\,\bialpha {\bf {{1}}} $$$
,
 $$$ \bigamma \, = \,{{(\bialpha {\bf {{1}}})}^{{\rm{ - 1}}}} \bialpha $$$
and
 $$$ {{P}_{\rm{1}}}\, = \,(\bialpha {\bf {{1}}})(I\,{\rm{ - }}\,T) $$$
.
The core of the algorithm in Wu & Li (Reference Wu and Li2010) and Siaw et al. (Reference Siaw, Wu, Pitt and Wang2011) is the vector recursion
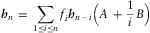 $${{\bi h}_n}\, = \,\mathop{\sum}\limits_{1\leq i\leq n} {{f}_i}{{\bi h}_{n\,{\rm{ - }}\,i}}\Big(A\, + \,\frac{{\rm{1}}}{i}B\Big)$$
to replace (2), with  $$$ {{g}_n}\, = \,{{\bi h}_n}{\bf {{1}}} $$$
. Ren (Reference Ren2010) gives an improved algorithm in case N and the Xis themselves are of phase-type. Finally, we note that PH distributions have rational generating functions, and this is the basis for the adaptation in Eisele (Reference Eisele2006) of Panjer's algorithm to the case where N is PH. A comparison of the complexity and numerical stability of the algorithms in Eisele (Reference Eisele2006), Ren (Reference Ren2010), Wu & Li (Reference Wu and Li2010) and Siaw et al. (Reference Siaw, Wu, Pitt and Wang2011) is outside the scope of the present paper.
As we show in the next section, the combination of two matrices in (5) makes these distributions a bit unwieldy, unless one imposes some simplifying constraint. In Section 2, we show that the series  $$$ \mathop{\sum}\nolimits_{n\geq {\rm{0}}} {{P}_n} $$$
is a key quantity and that, for all practical purposes, it is necessary that the spectral radius of A be strictly less than one in order for the series to converge. Before doing so, we briefly address the issue of the choice of representation, as the one we adopt is slightly different from the representation in Wu & Li (Reference Wu and Li2010) and Siaw et al. (Reference Siaw, Wu, Pitt and Wang2011).
Next, we assume in Section 3 that A and B commute. As matrices go, this is a very strong constraint, but it considerably simplifies the determination of the generating function and of moments, and it is a property of all the examples in Wu & Li (Reference Wu and Li2010) and Siaw et al. (Reference Siaw, Wu, Pitt and Wang2011). Even with this restriction, the generalized (a, b, 0) and (a, b, 1) distributions still form a very rich family since they include the PH distributions, which have been shown to efficiently mimic long-tailed distributions. In addition, the same class contains distributions with small variance, as we show in Section 4. There, we focus our attention on distributions for which A = 0, B ≥ 0, and  $$$\bigamma \ge {\bf 0}$$$
. These distributions are interesting because they form a family totally distinct from PH distributions, yet they are amenable to a Markovian representation. For that reason, we call them Phase-type Poisson or PH-Poisson distributions. This physical interpretation opens the way in Section 5 to an estimation procedure based on the EM algorithm.
2 Matrix generating function
We are concerned with distributions {pn} defined as
 $$ {{p}_n}\, = \,\bibeta {{P}_n}{\bf {{1}}},\; \; \; \; \:{\rm{where}}\:\; \; \; \; {{P}_n}\, = \,\prod\limits_{1\leq i\leq n} \Big(A\, + \,\frac{{\rm{1}}}{i}B\Big)\; \; \; \; \:{\rm{for}}\,n\,\geq \,{\rm{0}}, $$
A and B are matrices of order m, and β is a row vector of size m. We use the convention that for n = 0, the matrix product in (7) is equal to the identity matrix, so that we may recursively define the Pns as
 $${{P}_{\rm{0}}}\, = \,I,\; \; \; \; {{P}_n}\, = \,{{P}_{n{\rm{ - 1}}}}\Big(A\, + \,\frac{{\rm{1}}}{n}B\Big)\; \; \; \; \:{\rm{for}}\,n\,\geq \,{\rm{1}}.$$
We shall write that {pn} has the representation  $$$\cal D$$$
(β,A,B) of order m.
This definition calls for a few comments. First, we assume that the recursion (7) starts with n = 0. In other words, we are not concerned in this paper with the possibility that the sequence {pn} does not conform to the general pattern for small values of n. Instead, we focus our attention, to a large extent, on the matrices Pn.
Second, our definition is slightly different from that of generalized (a, b, 0) distributions in Wu & Li (Reference Wu and Li2010), where it is assumed that  $$$\bigamma$$$
is a stochastic vector (
 $$$\bigamma$$$
≥ 0,
 $$$\bigamma {\bf 1}=1$$$
) and that P 0 is a matrix chosen according to the circumstances. The two representations are equivalent as it suffices to define
 $$$\bibeta=\bigamma P_0$$$
. Our reason to prefer (7) is that we do not find any advantage in requiring that β should be stochastic when A, B and P 0 are allowed to be of mixed signs. Furthermore, our definition involves m 2 fewer parameters (the entries of P 0) and this saving will prove significant in Section 5 when we design an estimation procedure.
Finally, one might use left- instead of right-multiplication and define  $$$ {{P}_n}\, = \,\big(A\, + \,\frac{{\rm{1}}}{n}B\big){{P}_{n{\rm{ - 1}}}} $$$
, yielding a possibly different family of distributions. Actually, we shall assume in the next section that A and B commute, so that there would be no difference.
We need to impose some constraints on the representations of these distributions, otherwise very little can be said in general. To begin with, let us associate a transition graph to the matrices A and B: the graph contains m nodes, and there is an oriented arc from i to j if  $$$ |{{A}_{ij}}| + |{{B}_{ij}}|\ne{\rm{0}} $$$
. A node j is said to be useful if there exists a node i such that there is a path from i to j in the transition graph and such that
 $$$ {{\bibeta }_i}\ne{\rm{0}} $$$
; j is said to be useless otherwise. The lemma below shows that one may require without loss of generality that representations are chosen without useless nodes.
Lemma 2.1If the representation  $$$\cal D$$$
(β, A, B) of order m is such that there exists at least one useless node, then there exists another, equivalent, representation of order m′ strictly less than m.
Proof Assume that j is a useless node; define S 1 to be the subset of nodes containing j and all the nodes i for which there exists a path from i to j. The matrices A and B may be written, possibly after a permutation of rows and columns, as
 $$A\, = \,\left[ {\matrix { {{{A}_{{\rm{1}},{\rm{1}}}}} & {{{A}_{{\rm{1}},{\rm{2}}}}} \hfill \cr {\rm{0}} & {{{A}_{{\rm{2}},{\rm{2}}}}} }} \right]\; \; \; \; \:{\rm{and}}\:\; \; \; \; B\, = \,\left[ {\matrix { {{{B}_{{\rm{1}},{\rm{1}}}}} & {{{B}_{{\rm{1}},{\rm{2}}}}} \hfill \cr {\rm{0}} & {{{B}_{{\rm{2}},{\rm{2}}}}} }} \right],$$
where A 1,1 and B 1,1 are indexed by the nodes in S 1 and A 2,2 and B 2,2 are indexed by the remaining nodes; similarly, we have
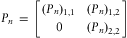 $${{P}_n}\, = \,\left[ {\matrix { {{{{({{P}_n})}}_{{\rm{1}},{\rm{1}}}}} & {{{{({{P}_n})}}_{{\rm{1}},{\rm{2}}}}} \hfill \cr {\rm{0}} & {{{{({{P}_n})}}_{{\rm{2}},{\rm{2}}}}} }} \right]$$
with  $$$ {{({{P}_n})}_{{\rm{1}},{\rm{1}}}}\, = \,\prod\nolimits_{{\rm{1}}\leq i\leq n} \big({{A}_{{\rm{1}},{\rm{1}}}}\, + \,\frac{{\rm{1}}}{i}{{B}_{{\rm{1}},{\rm{1}}}}\big) $$$
and
 $$$ {{({{P}_n})}_{{\rm{2}},{\rm{2}}}}\, = \,\prod\nolimits_{{\rm{1}}\leq i\leq n} \big({{A}_{{\rm{2}},{\rm{2}}}}\, + \,\frac{{\rm{1}}}{i}{{B}_{{\rm{2}},{\rm{2}}}}\big) $$$
.
We partition β in a similar manner and write  $$$ \bibeta \, = \,\left[ {\matrix { {{{\bibeta }_{\rm{1}}}} & {{{\bibeta }_{\rm{2}}}} \right] $$$
. Since j is useless, β1 = 0. It is clear that
 $$$ \bibeta {{P}_n}{\bf {{1}}}\, = \,{{\bibeta }_{\rm{2}}}{{({{P}_n})}_{{\rm{2}},{\rm{2}}}}{\bf {{1}}} $$$
, so that
 $$${\cal D}({{\bibeta }_{\rm{2}}},{{A}_{{\rm{2}},{\rm{2}}}},{{B}_{{\rm{2}},{\rm{2}}}}) $$$
is an equivalent representation, of order strictly smaller than m. □
The generating function  $$$ p(z)\, = \,\mathop{\sum}\nolimits_{n\geq {\rm{0}}} {{z}^n} {{p}_n} $$$
may be written as
 $$$ p(z)\, = \,\bibeta P(z;A,B){\bf {{1}}} $$$
, where
 $$P(z;A,B)\, = \,\mathop{\sum}\limits_{n\geq {\rm{0}}} {{z}^n} {{P}_n}\, = \,\mathop{\sum}\limits_{n\geq {\rm{0}}} {{z}^n} \prod\limits_{{\rm{1}}\leq i\leq n} \Big(A\, + \,\frac{{\rm{1}}}{i}B\Big),$$
provided that the series in (9) converges. We focus our attention on the matrix generating function P(z;A,B) and we discuss its convergence properties as  $$$ z \rightarrow {\rm{1}} $$$
. A simple sufficient condition for P(1;A,B) to be finite is given in the next lemma.
Lemma 2.2If  $$$ {\rm{sp}}(A)\, \lt \,{\rm{1}} $$$
, where
 $$$ {\rm{sp}}( \cdot ) $$$
denotes the spectral radius, then the series
 $$$ P(z;A,B) $$$
converges absolutely for
 $$$ |z|\leq {\rm{1}} $$$
.
If A ≥ 0 and B ≥ 0, then the inequality  $$$ {\rm{sp}}(A)\, \lt \,{\rm{1}} $$$
is both necessary and sufficient.
Proof The convergence radius R of the series in (9) is given by  $$$ {{R}^{{\rm{ - 1}}}} \, = \,{\rm{lim}}\,{{\rm{sup}}}_n \root_n\of {{\parallel {{P}_n}\parallel }} $$$
, where
 $$$ \parallel \cdot \parallel $$$
is any matrix norm.
To simplify the notations, we define  $$$ {{C}_i}\, = \,A\, + \,(1/i)B $$$
. For any consistent norm,
 $$$ \parallel {{P}_n}\parallel \leq \parallel {{C}_{\rm{1}}}\parallel \parallel {{C}_{\rm{2}}}\parallel \cdots \parallel {{C}_n}\parallel $$$
. Furthermore,
 $$$ \parallel {{C}_i}\parallel \leq \parallel A\parallel + ({\rm{1}}/i)\parallel B\parallel $$$
and for any
 $$$ {\epsilon}\, \gt \,{\rm{0}} $$$
, there exists a norm such that
 $$$ \parallel A\parallel \, \lt \,{\rm{sp}}(A)\, + \,{\epsilon} $$$
.
This implies that if  $$$ {\rm{sp}}(A)\, \lt \,{\rm{1}} $$$
, then there exist
 $$$ \eta \, \lt \,{\rm{1}} $$$
and
 $$$ {{i}^\ast} $$$
such that
 $$$ \parallel {{C}_i}\parallel \, \lt \,\eta $$$
for all
 $$$ i\,\geq \,{{i}^\ast} $$$
. In addition,
 $${\parallel {{P}_n}{{\parallel }^{{\rm{1}}/n}} \leq \parallel {{C}_{\rm{1}}}{{C}_{\rm{2}}} \cdots {{C}_{{{i}^\ast} }}{{\parallel }^{{\rm{1}}/n}} {{(\parallel {{C}_{{{i}^\ast} + {\rm{1}}}}\parallel \cdots \parallel {{C}_n}\parallel )}^{{\rm{1}}/n}} \cr \leq \parallel {{C}_{\rm{1}}}{{C}_{\rm{2}}} \cdots {{C}_{{{i}^\ast} }}{{\parallel }^{1/n}} {{\eta }^{(n{\rm{ - }}{{i}^\ast} )/n}}, $$
for  $$$ n\,\geq \,{{i}^\ast} $$$
, and
 $$$ \parallel {{C}_{\rm{1}}}{{C}_{\rm{2}}} \cdots {{C}_{{{i}^\ast} }}{{\parallel }^{{\rm{1}}/n}} {{\eta }^{(n{\rm{ - }}{{i}^\ast} )/n}} \rightarrow \eta $$$
as
 $$$ n \rightarrow \infty $$$
. We conclude, therefore, that
 $$$ {\rm{lim}}\,{{\rm{sup}}}_n \root n \of{{\parallel {{P}_n}\parallel }}\,\leq \,\eta $$$
and
 $$$ R\,\geq \,{\rm{1}}/\eta \, \gt \,{\rm{1}} $$$
, which proves that
 $$$ {\rm{sp}}(A)\, \lt \,{\rm{1}} $$$
is a sufficient condition for
 $$$ P(z;A,B) $$$
to converge. That this convergence is absolute comes from the fact that
 $$$ P(z;A,B) $$$
is a power series (Theorem 2 in Chapter 2 of Ahlfors, Reference Ahlfors1979).
If A and B are non-negative, then  $$$ {{P}_n}\,\geq \,{{A}^n} $$$
and
 $$$ P({\rm{1}};A,B)\,\geq \,\mathop{\sum}\nolimits_{n\geq {\rm{0}}} {{A}^n} $$$
. Since the last series diverges if
 $$$ {\rm{sp}}(A)\,\geq \,{\rm{1}} $$$
, this completes the proof of the second claim. □
Note that  $$$ {\rm{sp}}(A)\, \lt \,{\rm{1}} $$$
cannot be a necessary condition in all generality: to give one example, if there is some
 $$$ {{n}^\ast} $$$
such that Pn = 0 for all
 $$$ n\, \gt \,{{n}^\ast} $$$
, then the series in (9) reduces to a finite sum, and the spectral radius of A has no bearing on its convergence; such is the case if
 $$$ B\, = \,{\rm{ - }}{{n}^\ast} A $$$
.
We turn our attention to the derivatives
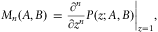 $$ {{M}_n}(A,B)\, = \,{{\left. {\frac{{{{\partial }^n} }}{{\partial {{z}^n} }}P(z;A,B)} \right|}_{z = {\rm{1}}}}, $$
for  $$$ n\,\geq \,{\rm{1}} $$$
, assuming that they exist. In that case, the factorial moments of the distribution are given by
 $$$ {{m}_n}\, = \,\bibeta {{M}_n}(A,B){\bf {{1}}} $$$
.
Lemma 2.3Assume that  $$$ P({\rm{1}};A,B) $$$
is finite. The matrix
 $$$ {{M}_n}(A,B) $$$
exists for some
 $$$ n\,\geq \,{\rm{1}} $$$
if and only if the matrix
 $$$ P(1;A,nA\, + \,B) $$$
exists, in which case
 $$ {{M}_n}(A,B)\, = \,n!{{P}_n}P({\rm{1}};A,nA\, + \,B). $$
If  $$$ {\rm{sp}}(A)\, \lt \,1 $$$
, then
 $$$ {{M}_n}(A,B) $$$
exists for all n and we also have
 $${{M}_n}(A,B)\, = \,n!P({\rm{1}};A,B){{\widetilde{P}}_n},$$
where
 $$ {{\widetilde{P}}_n}\, = \,\prod\limits_{{\rm{1}}\leq i\leq n} \Big(\Big(A\, + \,\frac{{\rm{1}}}{i}B\Big)(I\,{\rm{ - }}\,A{{)}^{{\rm{ - }}1}} \Big). $$
Proof We write
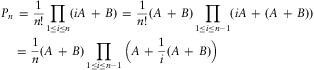 $$ { {{P}_n} & \, = \,\frac{{\rm{1}}}{{n!}}\prod\limits_{{\rm{1}}\leq i\leq n} (iA\, + \,B)\, = \,\frac{{\rm{1}}}{{n!}}(A\, + \,B)\prod\limits_{{\rm{1}}\leq i\leq n{\rm{ - 1}}} (iA\, + \,(A\, + \,B)) \hfill \cr & = \,\frac{{\rm{1}}}{n}(A\, + \,B)\prod\limits_{{\rm{1}}\leq i\leq n{\rm{ - 1}}} \Big(A\, + \,\frac{{\rm{1}}}{i}(A\, + \,B)\Big) \cr} $$
so that
 $$ { \frac{\partial }{{\partial z}}P(z;A,B) & \, = \,\mathop{\sum}\limits_{n\geq {\rm{1}}} n{{z}^{n{\rm{ - 1}}}} {{P}_n}\, = \,(A\, + \,B)\mathop{\sum}\limits_{n\geq {\rm{1}}} {{z}^{n{\rm{ - 1}}}} \prod\limits_{{\rm{1}}\leq i\leq n{\rm{ - 1}}} \Big(A\, + \,\frac{{\rm{1}}}{i}(A\, + \,B)\Big) \hfill \cr & = \,(A\, + \,B)P(z;A,A\, + \,B) \cr} $$
and, by induction,
 $$ { \frac{{{{\partial }^n} }}{{\partial {{z}^n} }}P(z;A,B) & \, = \,(A\, + \,B)(2A\, + \,B) \cdots (nA\, + \,B)P(z;A,nA\, + \,B) \hfill \cr & = \,n!{{P}_n}P(z;A,nA\, + \,B) \cr} $$
for all n, from which (11) results.
If  $$$ {\rm{sp}}(A)\, \lt \,{\rm{1}} $$$
, then we see from the proof of Lemma 2.2 that
 $$$ P(z;A,B) $$$
is a matrix of analytic functions in the closed unit disk, and it is a sufficient condition for the derivatives of all orders to be finite at z = 1. Furthermore, Lemma 1 in Wu & Li (Reference Wu and Li2010) states that
 $$ \frac{\partial }{{\partial z}}P(z;A,B)\, = \,z\frac{\partial }{{\partial z}}P(z;A,B)A\, + \,P(z;A,B)(A\, + \,B), $$
so that
 $$ \frac{\partial }{{\partial z}}P(z;A,B)\, = \,P(z;A,B)(A\, + \,B)(I\,{\rm{ - }}\,zA{{)}^{{\rm{ - 1}}}} $$
for  $$$ |z|\,\leq \,{\rm{1}} $$$
, from which (12) readily results by induction.□
This lemma points to the importance of being able to determine the matrix  $$$ P({\rm{1}};A,B) $$$
. In some special cases, an explicit expression may be derived but in general, in the absence of any simplifying feature of the pair (A, B), there does not seem to be an alternative to the brute force calculation of the series
 $$$ \mathop{\sum}\nolimits_{n\geq {\rm{0}}} \prod\nolimits_{{\rm{1}}\leq i\leq n{\rm{ - 1}}} \big(A\, + \,\frac{{\rm{1}}}{i}B\big) $$$
.
3 Commutative matrix product
In this section, we assume that A and B commute and thereby obtain a stronger result than in Section 2. This assumption is satisfied for all examples in Wu & Li (Reference Wu and Li2010), where either A = 0 or B is a scalar multiple of A. It is also satisfied if A or B is a scalar matrix cI for some scalar c, or if B = 0. The latter includes PH(α, T) distributions if there exists a solution to the system of linear constraints  $$$ \bialpha (I\,{\rm{ - }}\,T){{T}^{n{\rm{ - 1}}}} {\bf {{1}}}\, = \,\bibeta {{A}^n} {\bf {{1}}} $$$
for
 $$$ n\,\geq \,{\rm{1}} $$$
; if T is invertible, then an obvious solution is
 $$$ \bibeta \, = \,\bialpha (I\,{\rm{ - }}\,T){{T}^{{\rm{ - 1}}}} $$$
, A = T. Thus, although it is a restrictive assumption from a linear algebraic point of view, it may be reasonable in the context of stochastic modelling.
Define the series
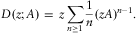 $$ D(z;A)\, = \,z\mathop{\sum}\limits_{n\geq {\rm{1}}} \frac{{\rm{1}}}{n}{{(zA)}^{n{\rm{ - 1}}}} . $$
It converges if  $$$ |z|\:{\rm{sp}}(A)\, \lt \,{\rm{1}} $$$
and diverges if
 $$$ z\, = \,{\rm{1}}/\lambda (A) $$$
, where
 $$$ \lambda (A) $$$
is an eigenvalue of A such that
 $$$ |\lambda (A)| = {\rm{sp}}(A) $$$
; we write
 $$$ {{z}^\ast} \, = \,1/\lambda (A) $$$
. If A is nonsingular and
 $$$ |z|\:{\rm{sp}}(A)\, \lt \,{\rm{1}} $$$
, then
 $$ D(z;A)\, = \,{{A}^{{\rm{ - }}1}} \log {{(I\,{\rm{ - }}\,zA)}^{{\rm{ - }}1}} $$
by extending the scalar identity  $$$ \mathop{\sum}\nolimits_{k\geq {\rm{1}}} \frac{{\rm{1}}}{k}{{x}^{k{\rm{ - }}1}} \, = \,{{x}^{{\rm{ - 1}}}} \log {{(1\,{\rm{ - }}\,x)}^{{\rm{ - }}1}} $$$
.
Theorem 3.1Assume that A and B commute. If  $$$ B\, = \,{\rm{ - }}\ell A $$$
for some integer
 $$$ \ell \,\geq \,{\rm{1}} $$$
, then
 $$ P(z;A,B)\, = \,{{(I\,{\rm{ - }}\,zA)}^{\ell {\rm{ - 1}}}} . $$
Otherwise, the condition  $$$ {\rm{sp}}(A)\, \lt \,{\rm{1}} $$$
is sufficient for the generating function
 $$$P(z;A,B)$$$
to be absolutely convergent within the closed unit disk
 $$$ |z|\leq {\rm{1}} $$$
, in which case
 $$ P(z;A,B)\, = \,{{e}^{(A + B)D(z;A)}}, $$
if  $$$ {\rm{sp}}(A)\, \gt \,{\rm{1}} $$$
, then
 $$$ P(z;A,B) $$$
diverges on the whole unit circle
 $$$ |z| = {\rm{1}} $$$
, and if
 $$$ {\rm{sp}}(A)\, = \,{\rm{1}} $$$
, then there exists
 $$$ {{z}^\ast} $$$
such that
 $$$ |{{z}^\ast} | = {\rm{1}} $$$
and
 $$$ P({{z}^\ast} ;A,B) $$$
diverges.
Proof If  $$$ B\, = \,{\rm{ - }}\ell A $$$
, then
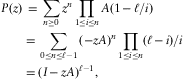 $$ { P(z) & \, = \,\mathop{\sum}\limits_{n\geq 0} {{z}^n} \prod\limits_{{\rm{1}}\leq i\leq n} A({\rm{1}}\,{\rm{ - }}\,\ell /i) \hfill \cr & = \,\mathop{\sum}\limits_{{\rm{0}}\leq n\leq \ell {\rm{ - 1}}} {{({\rm{ - }}zA)}^n} \prod\limits_{{\rm{1}}\leq i\leq n} (\ell \,{\rm{ - }}\,i)/i \hfill \cr & = {{(I\,{\rm{ - }}\,zA)}^{\ell {\rm{ - 1}}}}, \cr} $$
which proves the first claim.
In general, if A and B commute, we observe that
 $$\prod\limits_{{\rm{1}}\leq i\leq n} (iA\, + \,B)\, = \,\mathop{\sum}\limits_{{\rm{0}}\leq i\leq n} \left[ {\matrix { n \hfill \cr i }} \right]{{(A\, + \,B)}^i} {{A}^{n{\rm{ - }}i}} $$
where  $$${\left[ {\matrix { n \hfill \atop i }} \right] $$$
are Stirling's numbers of the first kind. If A and B are scalars, then (14) is a straightforward consequence of the definition of Stirling's numbers in Knuth (Reference Knuth1968), Section 1.2.6, equation (40). To prove the extension to commuting matrices, one proceeds by induction, using
 $$ \left[ {\matrix { n \hfill \cr {\rm{0}} }} \right]\, = \,0,\; \; \; \; \left[ {\matrix { n \hfill \cr n }} \right]\, = \,{\rm{1}},\; \; \; \; {\rm{and}}\; \; \; \; \left[ {\matrix { n \cr {i\,{\rm{ - }}\,{\rm{1}}} }} \right]\, + \,n\left[ {\matrix { n \hfill \cr i }} \right]\, = \,\left[ {\matrix { {n\, + \,{\rm{1}}} \hfill \cr i }} \right] $$
for  $$$ n\,\geq \,{\rm{1}} $$$
. Next, we write
 $$ P(z;A,B)\, = \,\mathop{\sum}\limits_{k\geq {\rm{0}}} {{z}^k} \frac{{\rm{1}}}{{k!}}\mathop{\sum}\limits_{{\rm{0}}\leq i\leq k} \left[ {\matrix { k \hfill \cr i }} \right]{{(A\, + \,B)}^i} {{A}^{k - i}} \; \; \; \; \:{\rm{by}}\;({\rm{9}},\,{\rm{14}}) $$
 $$ = \mathop{\sum}\limits_{i\geq {\rm{0}}} {{z}^i} {{(A\, + \,B)}^i} \mathop{\sum}\limits_{k\geq i} \frac{{\rm{1}}}{{k!}}\left[ {\matrix { k \hfill \cr i }} \right]{{(zA)}^{k{\rm{ - }}i}} $$
since, as we show later, we may interchange the order of summation. By equation (25) in Knuth (Reference Knuth1968), Section 1.2.9,
 $$ i!\mathop{\sum}\limits_{k\geq i} \frac{{\rm{1}}}{{k!}}\left[ {\matrix { k \hfill \cr i }} \right]{{x}^{k{\rm{ - }}i}} \, = \,{{\bigg(\mathop{\sum}\limits_{k\geq 1} \frac{{\rm{1}}}{k}{{x}^{k{\rm{ - 1}}}} \bigg)}^i}, $$
and (16) becomes
 $$ P(z;A,B)\, = \,\mathop{\sum}\limits_{i\geq {\rm{0}}} \frac{{\rm{1}}}{{i!}}\left[ {(A\, + \,B)D(z;A} \right){{]}^i}, $$
which proves (13). Thus, it remains for us to justify the transition from (15) to (16).
The double series in (16) is absolutely convergent if  $$$ |z|\:{\rm{sp}}(A)\, \lt \,{\rm{1}} $$$
and diverges if
 $$$ z\, = \,{{z}^\ast} $$$
. Indeed, it is well-known that
 $$$ \parallel {{A}^k} \parallel = O(1){\rm{sp}}{{(A)}^k} {{k}^r} $$$
asymptotically as
 $$$ k \rightarrow \infty $$$
, for some integer
 $$$ r\,\geq \,{\rm{0}} $$$
. Furthermore,
 $$$ \left[ {\matrix { k \hfill \atop i }} \right]/k!\, = \,O({\rm{1}})(\log \,k{{)}^{i{\rm{ - 1}}}} /(i\,{\rm{ - }}\,1)! $$$
, by Theorem 1 in Wilf (Reference Wilf1993). Therefore,
 $$ \mathop {{\rm{lim}}}\limits_{k \rightarrow \infty } {\root {\scale140%k}\of {{\frac{{\rm{1}}}{{k!}}\left[ {\matrix { k \hfill \cr i }} \right]\parallel {{A}^{k{\rm{ - }}i}} \parallel }} \, = \,{\rm{sp}}(A)\mathop {{\rm{lim}}}\limits_{k \rightarrow \infty } \root {\scale140%k} \of{{{{k}^r} {{{({\rm{log}}\ k)}}^{i{\rm{ - 1}}}} }}\, = \,{\rm{sp}}(A), $$
so that the series  $$$ \mathop{\sum}\nolimits_{k\geq i} \frac{{\rm{1}}}{{k!}}\left[ {\matrix { k \hfill \atop i }} \right]{{(zA)}^{k{\rm{ - }}i}} $$$
converges absolutely if
 $$$ |z|\:{\rm{sp}}(A)\, \lt \,{\rm{1}} $$$
, in which case its limit is
 $$$ \frac{{\rm{1}}}{{i!}}{{(D(z;A)/z)}^i} $$$
, and diverges if
 $$$ z\, = \,{{z}^\ast} $$$
. The equation (16) becomes
 $$ P(z;A,B)\, = \,\mathop{\sum}\limits_{i\geq {\rm{0}}} \frac{{\rm{1}}}{{i!}}{{[(A\, + \,B)D(z;A)]}^i} $$
which converges without further constraint.
As the double series in (16) is absolutely convergent for  $$$ |z|\,{\rm{sp}}(A)\, \lt \,{\rm{1}} $$$
, so is the series in (15). This proves that
 $$$ |z|\,{\rm{sp}}(A)\, \lt \,{\rm{1}} $$$
is sufficient for
 $$$ P(z;A,B) $$$
to be absolutely convergent or, in other words, that
 $$$ {\rm{1}}/{\rm{sp}}(A)\,\leq \,\rho $$$
, where ρ is the radius of convergence of
 $$$ P(z;A,B) $$$
. Conversely, take
 $$$ |z|\, \lt \,\rho $$$
. Then, by definition of ρ the series in is (15) absolutely convergent, and consequently so is the double series in (16). Thus,
 $$$ \rho \,\leq \,{\rm{1}}/{\rm{sp}}(A) $$$
and we conclude that
 $$$ \rho \, = \,{\rm{1}}/{\rm{sp}}(A) $$$
.
Now, if  $$$ {\rm{sp}}(A)\, \lt \,{\rm{1}} $$$
, then
 $$$ P(z;A,B) $$$
converges on
 $$$ |z|\,\leq \,{\rm{1}} $$$
since the closed disk is entirely within the radius of convergence. If
 $$$ {\rm{sp}}(A)\, \gt \,{\rm{1}} $$$
, then the generating function diverges on
 $$$ |z| = \,{\rm{1}} $$$
since the circle is outside the radius of convergence, and if
 $$$ {\rm{sp}}(A)\, = \,{\rm{1}} $$$
, then
 $$$ |{{z}^\ast} | = \,{\rm{1}} $$$
and
 $$$ P({{z}^\ast} ;A,B) $$$
diverges. This completes the proof. □
This theorem confirms the important role of the matrix A with respect to the convergence of various series. A direct consequence is that if A, B 1 and B 2 are three commuting matrices, then
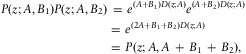 $$ { P(z;A,{{B}_{\rm{1}}})P(z;A,{{B}_{\rm{2}}}) & \, = \,{{e}^{(A + {{B}_{\rm{1}}})D(z;A)}} {{e}^{(A + {{B}_{\rm{2}}})D(z;A)}} \hfill \cr & = \,{{e}^{({\rm{2}}A + {{B}_{\rm{1}}} + {{B}_{\rm{2}}})D(z;A)}} \hfill \cr & = \,P(z;A,A\, + \,{{B}_{\rm{1}}}\, + \,{{B}_{\rm{2}}}), \cr} $$
and if A and B commute, then
 $$ { P(z;A,kA\, + \,B) & \, = \,P(z;A,B)(P(z;A,{\rm{0}}{{))}^k} \hfill \cr & = \,P(z;A,B)({{e}^{AD(z;A)}} {{)}^k} \hfill \cr & = \,P(z;A,B)(I\,{\rm{ - }}\,zA{{)}^{{\rm{ - }}k}}, \; \; \:\;{\rm{for}}\,k\,\geq \,{\rm{0}},\,k\,{\rm{integer}}. \cr} $$
Consequently, using either (11) or (12) we obtain the following property.
Corollary 3.2Assume that  $$$ {\rm{sp}}(A)\, \lt \,{\rm{1}} $$$
. If A and B commute, then the nth factorial moment of the distribution is given by
 $$ {{m}_n}(\bibeta, A,B)\, = \,n!\bibeta P({\rm{1}};A,B)(I\,{\rm{ - }}\,A{{)}^{{\rm{ - }}n}} {{P}_n}{\bf {{1}}}. $$
If one remembers that  $$$ \bibeta P({\rm{1}};A,B) $$$
is a vector of which the components add up to one, the similarity with the factorial moments of discrete PH distributions is striking (see equation (2.15) of Latouche & Ramaswami, Reference Latouche and Ramaswami1999).
To conclude this section, we review the examples in Wu & Li (Reference Wu and Li2010):
• If
 $$$ B\, = \,\alpha A $$$
for
$$$ \alpha \geq \,{\rm{ - }}\,{\rm{1}} $$$
, then
$$$ (A\, + \,B)D(z;A)\, = \,(1\, + \,\alpha ){\rm{log}}{{(I\,{\rm{ - }}\,zA)}^{{\rm{ - 1}}}} $$$
and
$$$ P(z;A,\alpha A)\, = \,{{(I\,{\rm{ - }}\,zA)}^{{\rm{ - }}(1\, + \,\alpha )}} $$$
.
• If
$$$ B\, = \,{\rm{ - }}\ell A $$$
for
$$$ \ell \,\geq \,0 $$$
,
$$$ \ell $$$
integer, then
$$$ P(z;A,\,{\rm{ - }}\,\ell A)\, = \,{{(I\,{\rm{ - }}\,zA)}^{\ell {\rm{ - 1}}}} $$$
as proved in Theorem 3.1.• If A = 0, then
$$$ D(z;0)\, = \,z $$$
and
$$$ P(z;{\rm{0}},B)\, = \,{{e}^{zB}} $$$
.









We shall further examine this last case in the remainder of the paper.
4 PH-Poisson distributions
4.1 Definition and comparison to PH distributions
We restrict our attention to distributions for which A = 0, with the added constraint that  $$$ \bibeta \,\geq \,{\bf {{0}}} $$$
,
 $$$ B\,\geq \,{\rm{0}} $$$
. The assumption that β and B are non-negative makes it easier to ascertain that
 $$$\cal D$$$
(β, 0, B) is the representation of a probability distribution. In addition, as we show in Theorem 4.4, it provides us with a physical interpretation in terms of a Markovian process, which explains why we call these Phase-type Poisson distributions, or PH-Poisson for short.
Definition 4.1A random variable X has a PH-Poisson distribution with representation  $$$\cal P$$$
(β, B) if
 $${\rm{P}}[X\, = \,n]\, = \,{{p}_n}\, = \,\frac{{\rm{1}}}{{n!}}\bibeta {{B}^n} {\bf {{1}}},\; \; \; \; \:{{for}}\;n\,\geq \,{\rm{0}},$$
where B ≥ 0 is a matrix of order m and  $$$ \bibeta \,\geq \,{\bf {{0}}} $$$
is a row-vector of size m such that
 $$$\bibeta {{e}^B} {\bf {{1}}}\, = \,{\rm{1}}$$$
.
Note that β1 < 1, unless B = 0. In the notation of Wu & Li (Reference Wu and Li2010), the PH-Poisson distribution with representation  $$$\cal P$$$
(β, B) belongs to the generalized (a, b, 0) family, with A = 0, B = B,
 $$$ {{P}_0}\, = \,{{e}^{{\rm{ - }}B}} $$$
and
 $$$ \bigamma \, = \,\bibeta {{e}^B} $$$
. The generating function
 $$$ p(z)\, = \,\mathop{\sum}\limits_{n\,\geq \,0} {{z}^n} {{p}_n} $$$
is given by
 $$$ p(z)\, = \,\bibeta {{e}^{zB}} {\bf {{1}}} $$$
and the factorial moments by
 $$ {\rm{E}}[X(X\,{\rm{ - }}\,{\rm{1}}) \cdots (X\,{\rm{ - }}\,n\, + \,1)]\, = \,\bibeta {{B}^n} {{e}^B} {\bf {{1}}}. $$
It is easy to see that PH and PH-Poisson distributions are essentially two different families of probability distributions. Indeed, assume that X is PH-Poisson with representation  $$$\cal P$$$
(β, B) and Y is PH with representation PH(α, T). From (18), it results that
 $$ {\rm{P}}[X\, = \,n]\, \approx \,{{({\rm{sp}}(B))}^n} {{n}^r} /n!, $$
asymptotically as  $$$ n \rightarrow \infty $$$
, where r is the index of sp(B), and similarly,
 $${\rm{P}}[Y\, = \,n]\, = \,\bialpha {{T}^{n{\rm{ - 1}}}} (I\,{\rm{ - }}\,T){\bf {{1}}}\, \approx \,{{({\rm{sp}}(T))}^n} {{n}^s}, $$
where s is the index of sp(T). It is obvious that for any given B there is no T such that the right-hand sides of (20) and (21) coincide for all n big enough, unless  $$${\rm{sp}}(B)\, = \,{\rm{sp}}(T)\, = \,0$$$
.
If sp(B) = 0, then there exists k ≤ m such that B k = 0, the distribution of X is concentrated on {0,1,…,k}, and X does have a PH representation by Theorem 2.6.5 in Latouche & Ramaswami (Reference Latouche and Ramaswami1999).
Example 4.2 Tail of the density. We see from (20) that the density of PH-Poisson distributions drops sharply to zero. We compare three different densities on Figure 1: one is a PH-Poisson distribution, the second a PH distribution and the third a Poisson distribution. We have connected the points of the densities for better visual appearance, and we plot on the right-hand side the tail of the densities in semi-logarithmic scale.
Density function for a PH-Poisson distribution with m =10 and mean 18.71 (curve marked with *), the Poisson distribution with the same mean (marked with +) and the minimal-variance PH distribution with the same order and the same mean (marked with  $$$ \circ $$$
).

The curve marked with a “*” is the density of the PH-Poisson distribution with m = 10,  $$$ {{B}_{ii}}\, = \,10 $$$
,
 $$$ {\rm{1}}\,\leq \,i\,\leq \,m $$$
, and
 $$$ {{B}_{i,i + {\rm{1}}}}\, = \,{\rm{37}}{\rm{.5}} $$$
,
 $$$ {\rm{1}}\,\leq \,i\,\leq \,m\,{\rm{ - }}\,{\rm{1}} $$$
. The vector β is given by
 $$\bibeta \, = \,[ {\matrix { {\rm{1}} &#x0026; {\rm{0}} &#x0026; \cdots &#x0026; {\rm{0}} ]{{({\rm{diag}}({{e}^B} {\bf {{1}}}))}^{{\rm{ - 1}}}} $$
(it is easy to verify that  $$$ \bibeta {{e}^B} {\bf {{1}}}\, = \,{\rm{1}} $$$
.) Its mean μ, variance σ 2 and coefficient of variation C.V. equal to σ/μ are given in the first row of Table 1, as well as the spectral radius S.R. of the matrix B.
Mean, variance and coefficient of variation of the three distributions of Figure 1.

The curve marked with a “+” is the density of the PH distributions with the same order m and mean μ and minimal variance (see Telek (Reference Telek2000) for details). The curve marked with a “ $$$ \circ $$$
” is the Poisson density with parameter equal to the mean μ. The variance, coefficient of variation, and spectral radius of these two densities are also given in Table 1.
The plot on the right-hand side of Figure 1 clearly indicates that the PH-Poisson density decays asymptotically the fastest of the three, this is due to the combination of a relatively small spectral radius and of the factor  $$$ 1/n! $$$
. We also see from the plot on the left-hand side, and from Table 1, that it is the most concentrated around the mean.
Example 4.3 Small variance. We pursue here the comparison between PH-Poisson distributions and minimal variance PH distributions, showing that PH-Poisson distributions may prove to be a useful alternative to PH distributions when modelling discrete distributions with small variance.
The curve marked with a “*” on Figure 2 is the density of the PH-Poisson distribution with m = 10,  $$$ {{B}_{ii}}\, = \,2\, + \,4i $$$
,
 $$$ 1\leq i\leq m $$$
, and
 $$$ {{B}_{i,i\, + \,{\rm{1}}}}\, = \,{\rm{0}}{\rm{.5}} $$$
,
 $$$ {\rm{1}}\,\leq \,i\,\leq \,m\,{\rm{ - }}\,{\rm{1}} $$$
. The vector β is given by
Density function for a PH-Poisson distribution with m = 5 (curve marked with *), a minimal-variance PH distribution with m = 5 (marked with +) and a minimal-variance PH distribution with m = 17 (marked with  $$$ \circ $$$
). The distributions all have the same mean
 $$$ \mu \, = \,{\rm{34}}{\rm{.00}} $$$
.
 $$\bibeta \, = \,\frac{{\rm{1}}}{m}\left[ {\matrix { {\rm{1}} &#x0026; {\rm{1}} &#x0026; \cdots &#x0026; {\rm{1}} }} \right]{{({\rm{diag}}({{e}^B} {\bf {{1}}}))}^{{\rm{ - 1}}}} .$$
Its mean, variance, coefficient of variation and spectral radius are given in Table 2.
Mean, variance and coefficient of variation of the three distributions of Figure 2.

The two other curves are the density functions of PH distributions with minimal variance, with the same mean as the PH-Poisson distributions, and with different orders. The one marked with “+” has the same order m = 10 as the PH-Poisson distribution, the one marked with “ $$$ \circ $$$
” has order m = 13, the smallest value for which the minimal variance is smaller than that of the PH-Poisson distribution.
4.2 A physical interpretation
We now give a physical interpretation for PH-Poisson distributions.
First, define  $$$ \nu = {\max }_i {{(B{\bf {{1}}})}_i} $$$
and
 $$$ P\, = \,{{\nu }^{{\rm{ - 1}}}} B $$$
(note that P is a sub-stochastic matrix, possibly stochastic) and define α = c β for some arbitrary but fixed constant
 $$$ c\,\leq \,{{(\bibeta {\bf {{1}}})}^{{\rm{ - 1}}}} $$$
. Consider a random variable K with the discrete PH representation (α, P). Let Xn be the discrete-time absorbing Markov chain associated with K.
Next, define the Poisson process  $$$ \{ \theta (t):t\,\geq \,0\} $$$
of rate ν, and denote by
 $$$ {{\tau }_n}\, = \,\inf \{ t\,:\,\theta (t)\, = \,n\} $$$
the time epoch of the nth Poisson event. If B = 0, such t exists only for n = 0 and we define
 $$$ {{\tau }_0} = 0 $$$
,
 $$$ {{\tau }_n}\, = \,\infty $$$
, for n ≥ 1.
Then, define a continuous-time Markov chain  $$$ \{ \varphi (t):t\,\geq \,0\} $$$
as follows
 $$ { \varphi (t) &#x0026; \, = \,{{X}_n}\; \; \:\;{\rm{for}}\;t\, \in \,[{{\tau }_n},{{\tau }_{n\, + \,1}})\:\;{\rm{and}}\;\:t\, \lt \,{{\tau }_K}, \hfill \cr \, = \,0\; \; \:\;{\rm{for}}\;t\,\geq \,{{\tau }_K}. } $$
Thus, ϕ(t) makes a transition each time there is a Poisson event, and finally gets absorbed at time  $$$T=\tau_k$$$
.
Finally, define  $$$ N(t)\, = \,\theta (t) $$$
for t < T, and N(t) = K − 1 for t ≥ T. In other words, N(t) counts the number of transitions between transient states until ϕ(t) enters its absorbing state.
Alternatively, we may intepret  $$$ \{ (N(t),\varphi (t)):t\,\geq \,0\} $$$
as a transient Markov arrival process (Latouche et al., Reference Latouche, Remiche and Taylor2003), that is, a continuous time two-dimensional Markov process on the state space
 $$$ \{ (n,i):n \in {\Bbb N},i \in \{ 0,1, \ldots, m\} \} $$$
, with the initial probability vector (0, α) and the rate matrix
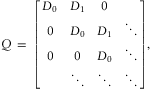 $$Q\, = \,\left[ {\matrix { {{{D}_{\rm{0}}}} &#x0026; {{{D}_1}} &#x0026; {\rm{0}} &#x0026; {} \hfill \cr {\rm{0}} &#x0026; {{{D}_{\rm{0}}}} &#x0026; {{{D}_{\rm{1}}}} &#x0026; \ddots \hfill \cr {\rm{0}} &#x0026; {\rm{0}} &#x0026; {{{D}_{\rm{0}}}} &#x0026; \ddots \hfill \cr {} &#x0026; \ddots &#x0026; \ddots &#x0026; \ddots }} \right],$$
where the matrices D 0 and D 1 of order m + 1 are given by
 $${{D}_0}\, = \,\left[ {\matrix { {\rm{0}} &#x0026;{\bf {{0}}} \hfill \cr {\nu (I\,{\rm{ - }}\,P){\bf {{1}}}} &#x0026; {{\rm{ - }}\nu I} }} \right],\; \; {{D}_{\rm{1}}}\, = \,\left[ {\matrix { {\rm{0}} &#x0026; {\bf {{0}}} \hfill \cr {\bf {{0}}} &#x0026; B }} \right].$$
With this definition, the states {(n, 0)} are absorbing for all n, the other states are all transient, T is the first passage time to any of the absorbing states, and N(t) counts the number of transitions in the interval (0, min{t, T}).
Theorem 4.4If α = c βfor some arbitrary but fixed constant  $$$ c\leq {{(\bibeta {\bf {{1}}})}^{ - 1}} $$$
, then pn defined in (18) is the conditional probability
 $$ {{p}_n}\, = \,{\rm{P}}[N(1)\, = \,n|T\, \gt \,1]. $$
Proof Define Mn(t) such that
 $$ {{({{M}_n}(t))}_{ij}}\, = \,{\rm{P}}[N(t)\, = \,n,\varphi (t)\, = \,j|\varphi (0)\, = \,i],\; \; \; \; \:{\rm{for}}\;1\;\leq \;i,\;j\;\leq \;m\:. $$
One easily verifies that  $$$ {{M}_0}(t)\, = \,{{e}^{{\rm{ - }}\nu t}} I $$$
and we prove below by induction that
 $$ {{M}_n}(t)\, = \,{{e}^{{\rm{ - }}\nu t}} {{(\nu P)}^n} {{t}^n} /n!\, = \,{{e}^{{\rm{ - }}\nu t}} {{B}^n} {{t}^n} /n!, $$
for n ≥ 1. Equation (24) holds for n = 0 and we assume that it holds for some n − 1. Conditioning on the epoch u of the first Poisson event, we find that
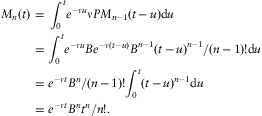 $$ { {{M}_n}(t)\, = \,{\int}_{\!\!\!\!\!0}^{t} {{e}^{{\rm{ - }}\nu u}} \nu P{{M}_{n{\rm{ - }}1}}(t\,{\rm{ - }}\,u)\:\:{\rm{d}}u \hfill \cr = {\int}_{\!\!\!\!0}^{t} {{e}^{{\rm{ - }}\nu u}} B{{e}^{{\rm{ - }}\nu (t{\rm{ - }}u)}} {{B}^{n{\rm{ - }}1}} {{(t\,{\rm{ - }}\,u)}^{n{\rm{ - }}1}} /(n\,{\rm{ - }}\,1)!\:\:{\rm{d}}u \hfill \cr = {{e}^{{\rm{ - }}\nu t}} {{B}^n} /(n\,{\rm{ - }}\,1)!{\int}_{\!\!\!\!0}^{t} {{(t\,{\rm{ - }}\,u)}^{n{\rm{ - }}1}} \:\:{\rm{d}}u \hfill \cr = {{e}^{{\rm{ - }}\nu t}} {{B}^n} {{t}^n} /n!. \cr} $$
Taking t = 1, we find that
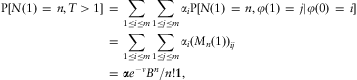 $$ { {\rm{P}}[N(1)\, = \,n,T\, \gt \,1]\, &#x0026; = \,\mathop{\sum}\limits_{1\leq i\leq m} \mathop{\sum}\limits_{1\leq j\leq m} {{\alpha }_i}{\rm{P}}[N(1)\, = \,n,\varphi (1)\, = \,j|\varphi (0)\, = \,i] \hfill \cr &#x0026; = \,\mathop{\sum}\limits_{1\leq i\leq m} \mathop{\sum}\limits_{1\leq j\leq m} {{\alpha }_i}{{({{M}_n}(1))}_{ij}} \hfill \cr &#x0026; = \,\bialpha {{e}^{{\rm{ - }}\nu }} {{B}^n} /n!{\bf {{1}}}, \cr} $$
so that  $$$ {\rm{P}}[T\, \gt \,1]\, = \,\bialpha {{e}^{{\rm{ - }}\nu }} {{e}^B} {\bf {{1}}} $$$
, and
 $$ { {\rm{P}}[N(1)\, = \,n|T\, \gt \,1]\, &#x0026; = \,{{(\bialpha {{e}^{{\rm{ - }}\nu }} {{e}^B} {\bf {{1}}})}^{{\rm{ - }}1}} \bialpha {{e}^{{\rm{ - }}\nu }} {{B}^n} /n!{\bf {{1}}} \hfill \cr &#x0026; = \,{{(\bialpha {{e}^B} {\bf {{1}}})}^{{\rm{ - }}1}} \bialpha {{B}^n} /n!{\bf {{1}}}. \cr} $$
If α = c β for any scalar  $$$ c\,\leq \,{{(\bibeta {\bf {{1}}})}^{{\rm{ - }}1}} $$$
, then
 $$$ {\rm{P}}[N(1)\, = \,n|T\, \gt \,1]\, = \,{{p}_n} $$$
for all n. This concludes the proof. □
Remark 4.5 If P is stochastic, then the random variable K has an unusual PH distribution, as it is either equal to zero or to infinity. Still, the argument in the proof of Theorem 4.4 holds true. Note that if P is stochastic, then B 1 = ν 1 and the distribution (18) is Poisson with parameter ν.
Example 4.6 This is a PH-Poisson distribution chosen to illustrate the combined effect of the conditional distribution imposed on the number of transitions among the phases. The representation is (β, B) with
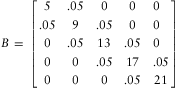 $$ B\, = \,\left[ {\matrix { 5 &#x0026; {.05} &#x0026; 0 &#x0026; 0 &#x0026; 0 \hfill \cr {.05} &#x0026; 9 &#x0026; {.05} &#x0026; 0 &#x0026; 0 \hfill \cr 0 &#x0026; {.05} &#x0026; {13} &#x0026; {.05} &#x0026; 0 \hfill \cr 0 &#x0026; 0 &#x0026; {.05} &#x0026; {17} &#x0026; {.05} \hfill \cr 0 &#x0026; 0 &#x0026; 0 &#x0026; {.05} &#x0026; {21} }} \right]\, $$
and
 $$ \bibeta \, = \,\gamma \left[ {\matrix { {{\rm{5}}.} &#x0026; {{\rm{2}}{\rm{.5}}} &#x0026; {{\rm{3}}{\rm{.}}} &#x0026; {{\rm{2}}{\rm{.25}}} &#x0026; {{\rm{6}}{\rm{.}}} \right]\,{\rm{exp}}\{ {\rm{ - diag}}({\rm{5}},{\rm{9}},{\rm{13}},{\rm{17}},{\rm{21}})\} $$
where the scaling factor γ is such that  $$$\bibeta {{e}^B} {\bf {{1}}}\, = \,{\rm{1}}$$$
. Its first two moments are μ = 13.84, and σ 2 = 47.31, and its density is given on Figure 3. The phase-type representation is
 $$$(\nu ;\bialpha, P)$$$
with
 $$$\nu \, = \,{\rm{21}}{\rm{.05}}$$$
,
Density function for a PH-Poisson distribution with representation (β, B) given in (25, 26).
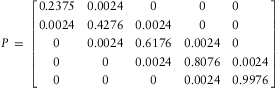 $$P\, = \,\left[ {\matrix { {{\rm{0}}{\rm{.2375}}} &#x0026; {{\rm{0}}{\rm{.0024}}} &#x0026; {\rm{0}} &#x0026; {\rm{0}} &#x0026; {\rm{0}} \hfill \cr {{\rm{0}}{\rm{.0024}}} &#x0026; {{\rm{0}}{\rm{.4276}}} &#x0026; {{\rm{0}}{\rm{.0024}}} &#x0026; {\rm{0}} &#x0026; {\rm{0}} \hfill \cr {\rm{0}} &#x0026; {{\rm{0}}{\rm{.0024}}} &#x0026; {{\rm{0}}{\rm{.6176}}} &#x0026; {{\rm{0}}{\rm{.0024}}} &#x0026; {\rm{0}} \hfill \cr {\rm{0}} &#x0026; {\rm{0}} &#x0026; {{\rm{0}}{\rm{.0024}}} &#x0026; {{\rm{0}}{\rm{.8076}}} &#x0026; {{\rm{0}}{\rm{.0024}}} \hfill \cr {\rm{0}} &#x0026; {\rm{0}} &#x0026; {\rm{0}} &#x0026; {{\rm{0}}{\rm{.0024}}} &#x0026; {{\rm{0}}{\rm{.9976}}} }} \right]$$
and
 $$\bialpha \, \approx \,\left[ {\matrix { {{\rm{0}}{\rm{.99}}} &#x0026; {{\rm{0}}{\rm{.91}} \, {\rm{1}}{{{\rm{0}}}^{{\rm{ - 2}}}} } &#x0026; {{\rm{0}}{\rm{.20}}\, {\rm{1}}{{{\rm{0}}}^{{\rm{ - 3}}}} } &#x0026; {{\rm{0}}{\rm{.27}}\, {\rm{1}}{{{\rm{0}}}^{{\rm{ - 5}}}} } &#x0026; {{\rm{0}}{\rm{.13}}\, {\rm{1}}{{{\rm{0}}}^{{\rm{ - 6}}}} } \right],$$
which is the vector β normalized so that α1 = 1.
Denote by  $$$ {{N}^\ast} \, = \,{\rm{sup}}\{ k:{{\tau }_k}\, \lt \,{\rm{1}}\} $$$
the total number of Poisson events in (0, 1). If T ≤ 1, then
 $$$ N({\rm{1}})\, = \,K\,{\rm{ - }}\,1\, \lt \,{{N}^\ast} $$$
, if T > 1, then
 $$$ N({\rm{1}})\, = \,{{N}^\ast} \, \lt \,K $$$
. On the average, the Poisson process produces ν events in the interval (0, 1), and the Poisson distribution has a relatively small standard deviation, so one expects N* to take values close to ν ≈ 21. The matrix P in (27) is irreducible, albeit with a small probability of migration from one phase to another, so that the initial phase plays a significant role in the distribution of K.
If the initial phase is 1, then the absorption probability is about 0.76, and it is likely that K will be small; it is therefore necessary, for the condition T > 1 to be fulfilled, that the Poisson process produces few events in (0, 1).
On the other hand, if the initial phase is 5, then the PH Markov chain will remain in that phase for a large number of transitions, it is likely that K will be large, so that T is likely to be much larger than 1, and it is not expected that the condition [T > 1] puts much constraint on N*.
5 EM algorithm
In this section, we exploit the probabilistic interpretation given in Section 4.2, and we develop an EM algorithm for fitting PH-Poisson distributions into data samples.
The EM algorithm is a popular iterative method in statistics for computing maximum-likelihood estimates from data that is considered incomplete. The procedure can be explained briefly as follows. Let  $$$ \bitheta \, \in \,\rOmega $$$
be the set of parameters to be estimated. We denote by
 $$$ {\cal X} $$$
a random complete data sample and by
 $$$ f({\cal X}\:|\:\bitheta ) $$$
its conditional density function, given the parameters θ. The maximum-likelihood estimator
 $$$ \hat{\bitheta } $$$
is defined as
 $$\hat{\bitheta }\, = \,{\mathop{{{\rm{arg}}\,{\rm{max}}}}\limits_{{\bitheta \in \,\rOmega }}} \,{\rm{log}}\,f({\cal X}\:|\:\bitheta ).$$
For one reason or another, instead of observing the complete data sample  $$$ {\cal X} $$$
, we observe an incomplete data sample
 $$$ {\cal Y} $$$
. Thus,
 $$$ {\cal X} $$$
can be replaced by its sufficient statistic
 $$$ ({\cal Y},{\cal Z}) $$$
, where
 $$$ {\cal Z} $$$
is the sufficient statistic of the unobserved data. As
 $$$ {\cal X} $$$
is unobservable, instead of maximizing
 $$$ {\rm{log}}\,f({\cal X}\:|\:\bitheta ) $$$
we maximize its conditional expectation given the incomplete data sample
 $$$ {\cal Y}\, = \,\bi y $$$
and the current estimates
 $$$ {{{\rm{\bitheta }}}^{(s)}} $$$
, at each
 $$$ (s\, + \,{\rm{1}}) $$$
th iteration for
 $$$ s\,\geq \,{\rm{0}} $$$
.
The EM algorithm can thus be decomposed into two steps:
• E-step: compute the conditional expectation of
$$$ {\rm{log}}\,f({\cal X}\:|\:\bitheta ) $$$
given the incomplete data sample y and the current estimates
$$$ {{\bitheta }^{(s)}}$$$
$$Q(\bitheta, {{\bitheta }^{{\bf {{(s)}}}}} )\, = \,{\rm{E}}[{\rm{log}}\,f({\cal X}\:|\:\bitheta )\:|\: {\bi y},{{\bitheta }^{(s)}} ], $$
• M-step: obtain the next set
$$$ {{\bitheta }^{(s\, + \,{\rm{1}})}} $$$
of estimates by maximizing the expected log-likelihood determined in the E-step
$$ {{\bitheta }^{(s\, + \,{\rm{1}})}} \, = \,{\mathop{{{\rm{arg}}\,{\rm{max}}}}\limits_{{\bitheta \in \rOmega }}} Q(\bitheta, {{\bitheta }^{(s)}} ). $$





When fitting a PH-Poisson distribution into a data sample, the parameters to be estimated are  $$$ \bitheta \, = \,\{ \nu, \bialpha, P\} $$$
. Without loss of generality, we assume that
 $$$ \bialpha {\bf {{1}}}\, = \,{\rm{1}} $$$
in the chosen representation. By Theorem 4.4, an observation y can be thought of as the number of Poisson events in the time interval [0, 1], given that the transient Markov chain with the transition matrix P has not been absorbed at time t = 1. This observation can be considered incomplete as it tells us neither the initial phase
 $$$ \varphi ({\rm{0}}) $$$
of the Markov chain nor how it has evolved during [0, 1]; a complete observation can be represented by
 $$$ x\, = \,({{\varphi }_0},{{\varphi }_1}, \ldots, {{\varphi }_y}), $$$
where
 $$$ {{\varphi }_i} $$$
is the phase of the Markov chain at the ith Poisson event and
 $$$ {{\varphi }_i}\, \ne \,{\rm{0}} $$$
for all
 $$$ i\, = \,{\rm{0}}, \ldots, y $$$
. The conditional density of the complete observation x given θ is
 $$ f(x\:|\:\bitheta )\, = \,{{(\bialpha {{e}^{\nu P}} {\bf {{1}}})}^{{\rm{ - 1}}}} \:\frac{{{{\nu }^y} }}{{y!}}\:{{\alpha }_{{{\varphi }_{\rm{0}}}}}\:\prod\limits_{i\, = \,{\rm{0}}}^{y{\rm{ - }}1} {{p}_{{{\varphi }_i}{{\varphi }_{i + 1}}}}. $$
Suppose that the complete data sample x contains n observations, each of which is denoted by x [k] and includes an incomplete observation y [k], for  $$$ k\, = \,{\rm{1}}, \ldots, n $$$
. Then, the conditional density of x given θ is
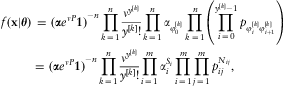 $$ { f({\bf {{x}}}\:|\:\bitheta ) &#x0026; \, = \,{{(\bialpha {{e}^{\nu P}} {\bf {{1}}})}^{{\rm{ - }}n}} \:\prod\limits_{k\, = \,{\rm{1}}}^n \frac{{{{\nu }^{{{y}^{[k]}} }} }}{{{{y}^{[k]}} !}}\:\prod\limits_{k\, = \,{\rm{1}}}^n {{\alpha }_{\varphi _{{\rm{0}}}^{{[k]}} }}\:\prod\limits_{k\, = \,{\rm{1}}}^n \left( {\prod\limits_{i\, = \,0}^{{{y}^{[k]}} {\rm{ - }}1} {{p}_{\varphi _{i}^{{[k]}} \varphi _{{i + 1}}^{{[k]}} }}} \right) \hfill \cr &#x0026; = \,{{(\bialpha {{e}^{\nu P}} {\bf {{1}}})}^{{\rm{ - }}n}} \:\prod\limits_{k\, = \,{\rm{1}}}^n \frac{{{{\nu }^{{{y}^{[k]}} }} }}{{{{y}^{[k]}} !}}\:\prod\limits_{i\, = \,{\rm{1}}}^m \alpha _{i}^{{{{S}_i}}} \prod\limits_{i\, = \,1}^m \prod\limits_{j\, = \,{\rm{1}}}^m p_{{ij}}^{{{{N}_{ij}}}}, \cr} $$
where
 $$ {{S}_i}\, = \,\mathop{\sum}\limits_{k\, = \,{\rm{1}}}^n {{\open 1}_{\{ \varphi _{{\rm{0}}}^{{[k]}} \, = \,i\} }}\; \; \:{\rm{for}}\;\:i\, = \,1, \ldots, m $$
is the number of complete observations in x with initial phase i, and
 $$ {{N}_{ij}}\, = \,\mathop{\sum}\limits_{k\, = \,{\rm{1}}}^n \mathop{\sum}\limits_{t\,\geq \,{\rm{1}}} {{\open 1}_{\{ \varphi _{{t{\rm{ - }}1}}^{{[k]}} \, = \,i,\varphi _{t}^{{[k]}} \, = \,j\} }}\; \; \:{\rm{for}}\;\:i,j\, = \,1, \ldots, m $$
is the total number of jumps in x from phase i to phase j. Thus, the log-likelihood function is given by
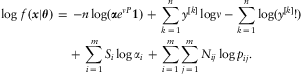 $$ { \log \,f\,({ {{\bi x}}}\:|\:\bitheta ) &#x0026; \, = \,{\rm{ - }}n\,{\rm{log}}(\bialpha {{e}^{\nu P}} {\bf {{1}}})\, + \,\mathop{\sum}\limits_{k\, = \,1}^n {{y}^{[k]}} \,{\rm{log}}\nu \,{\rm{ - }}\,\mathop{\sum}\limits_{k\, = \,1}^n {\rm{log}}({{y}^{[k]}} !) \hfill \cr &#x0026; \ \quad+ \,\mathop{\sum}\limits_{i\, = \,{\rm{1}}}^m {{S}_i}\,{\rm{log}}\,{{\alpha }_i}\, + \,\mathop{\sum}\limits_{i\, = \,1}^m \mathop{\sum}\limits_{j\, = \,1}^m {{N}_{ij}}\,{\rm{log}}\,{{p}_{ij}}. \cr} $$
Maximum-likelihood estimators To obtain closed-form expressions for the maximum-likelihood estimators  $$$\hat{\bitheta } $$$
is not straightforward. Applying the Karush-Kuhn-Tucker approach (see Chapter 12 in Nocedal & Wright, Reference Nocedal and Wright2000), it can be verified that the maximization problem
 $$\mathop {{\rm{max}}}\limits_\bitheta \;{\rm{log}}\,f(\bi x\;|\;\bitheta )$$
Subject to
 $$ \bialpha {\bf {{1}}}\, = \,{\rm{1}},\; \; \; \; P{\bf {{1}}}\,\leq \,{\bf {{1}}},\; \; \; \; \nu \, \gt \,{\rm{0}},\; \; \; \; {{p}_{ij}},{{\alpha }_i}\,\geq \,{\rm{0}}\; \; \:{\rm{for}}\;\:i,j\, = \,{\rm{1}}, \ldots, m, $$
has the associated Lagrangian
 $$ {\cal L}(\bitheta, \lambda, \bimu )\, = \,{\rm{log}}\,f({\bi x}\;|\;\bitheta )\,{\rm{ - }}\,\lambda h(\bitheta )\,{\rm{ - }}\,\mathop{\sum}\limits_{i\, = \,1}^{2m\, + \,1} {{\mu }_i}{{g}_i}(\bitheta ), $$
where
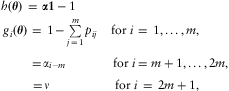 $$ \matrix {h(\bitheta )\, = \,\bialpha {\bf {{1}}}\,{\rm{ - }}\,1 \hfill \cr \matrix { {{{g}_i}(\bitheta )\, = \,1\,{\rm{ - }}\,} {\mathop{\sum}\limits_{j\, = \,1}^m {{{p}_{ij}}\; \; \; \; &#x0026;{\rm{for}}\;i\, = \,{\rm{1}}, \ldots, m,\,} } \hfill &#x0026; {} \hfill \cr \qquad\ { = \,} {{{\alpha }_{i{\rm{ - }}m}} \hfill \; \; \ \quad\qquad&#x0026;{\rm{for}}\;\:i = m + 1, \ldots, 2m,} &#x0026; {} \hfill \cr { = \,} {\nu \ \ \ \ \qquad\quad\; \; \; \; &#x0026; {\rm{for}}\;\:i\, = \,2m + 1,} \fhill&#x0026; {} $$
and λ and  $$$ \bimu \, = \,({{\mu }_1}, \ldots, {{\mu }_{2m\, + \,1}})\,\geq \,{\bf {{\bf 0}}} $$$
denote the Lagrangian multipliers associated with the equality constraint
 $$$h(\bitheta )\, = \,0$$$
, the inequality constraints
 $$$ {{g}_i}(\bitheta )\,\geq \,0 $$$
for
 $$$ i\, = \,{\rm{1}}, \ldots, {\rm{2}}m $$$
and
 $$$ {{g}_{2m + 1}}(\bitheta )\, \gt \,{\rm{0}} $$$
, respectively. The KKT conditions, which are first-order necessary conditions for constrained optimization problems, imply that the maximum-likelihood estimators
 $$$ \hat{\bitheta }\, = \,(\hat{\nu },\hat{\bialpha },\hat{P}) $$$
must satisfy the following constraints
 $$ \hat{\bialpha }{{e}^{\hat{\nu }\hat{P}}} \Big(\hat{\nu }\hat{P}{\bf {{1}}}\,{\rm{ - }}\,\frac{{\mathop{\sum}\nolimits_{k = {\rm{1}}}^n {{{y}^{[k]}} } }}{n}{\bf {{1}}}\Big)\, = \,{\rm{0}} $$
 $$ {{\hat{\alpha }}_i}\, = \,\frac{{{{S}_i}}}{{{{{\hat{\eta }}}_i}}}{{\Big(\mathop{\sum}\limits_{j\, = \,{\rm{1}}}^m \frac{{{{S}_j}}}{{{{{\hat{\eta }}}_j}}}\Big)}^{{\rm{ - 1}}}} \; \; \:\;{\rm{for}}\;\:i\, = \,{\rm{1}}, \ldots, m, $$
 $$ \frac{{n\hat{\bialpha }}}{{\hat{\bialpha }{{e}^{\hat{\nu }\hat{P}}} {\bf {{1}}}}}{\int}_{{\rm{\!\!\!\!\!0}}}^{{\hat{\nu }}} {{e}^{(\hat{\nu }\,{\rm{ - }}\,u)\hat{P}}} {{\bi e}_i}{\bi e}_{j}^{{\:\;T\:}} {{e}^{u\hat{P}}} \:{\rm{d}}u{\bf {{1}}}\, - \,\frac{{{{N}_{ij}}}}{{{{{\hat{p}}}_{ij}}}}\,\leq \,0, $$
for  $$$ i,j\, = \,1, \ldots, m $$$
, where
 $$$ {{\hat{\eta }}_i}\, = \,{\bi e}_{i}^{{\:\;T\:}} {{e}^{\hat{\nu }\hat{P}}} {\bf {{1}}} $$$
and ei is the column vector of size m with the ith component being 1 and all other components being 0.
Recall from Remark 4.5, that if P is stochastic then the PH-Poisson distribution with representation  $$$ (\nu, \bialpha, P) $$$
is a Poisson distribution with parameter
 $$$ \nu $$$
. In this case, the constraints (29)–(31) simplify considerably: the first implies that
 $$$ \hat{\nu }\, = \,\mathop{\sum}\nolimits_{k\, = \,{\rm{1}}}^n {{y}^{[k]}} /n $$$
, the well-known maximum-likelihood estimator for the parameter of a Poisson distribution; the second becomes
 $$$ {{\hat{\alpha }}_i}\, = \,{{S}_i}/n $$$
, the maximum-likelihood estimator for the initial vector of a discrete PH distribution (see Asmussen et al., Reference Asmussen, Nerman and Olsson1996); and the third reduces to
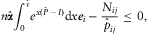 $$ n\hat{\bialpha }{\int}_{\!\!\!\!0}^{{\hat{\nu }}} {{e}^{x(\hat{P}\,{\rm{ - }}\,I)}} \:{\rm{d}}x{{\bi e}_i}\,{\rm{ - }}\,\frac{{{{N}_{ij}}}}{{{{{\hat{p}}}_{ij}}}}\,\leq \,0, $$
or, equivalently,
 $$\hat{\nu }{{\hat{p}}_{ij}}\hat{\bialpha }{\int}_{{\rm{\!\!\!\!0}}}^{{\rm{1}}} {{e}^{\hat{\nu }(\hat{P}\,{\rm{ - }}\,I)x}} \:{\rm{d}}x{{\bi e}_i}\,{\rm{ - }}\,\frac{{{{N}_{ij}}}}{n}\,\leq \,0,$$
for  $$$ i,j\, = \,1, \ldots, m $$$
. As
 $$$ \hat{P} $$$
is stochastic, summing the left-hand side of (32) over i and j gives us
 $$\hat{\nu }\hat{\bialpha }{\int}_{0}^{1} {{e}^{\hat{\nu }(\hat{P}\,{\rm{ - }}\,I)x}} \:{\rm{d}}x{\bf {{1}}}\,{\rm{ - }}\,{\rm{1}}/n\mathop{\sum}\limits_{i,j\, = \,{\rm{1}}}^m {{N}_{ij}}\, = \,\hat{\nu }\,{\rm{ - }}\,{\rm{1}}/n\mathop{\sum}\limits_{i,j\, = \,1}^m {{N}_{ij}}\, = \,0,$$
which implies that (32) is an equality for all  $$$ i,j\, = \,{\rm{1}}, \ldots, m $$$
.
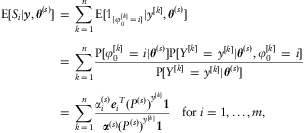
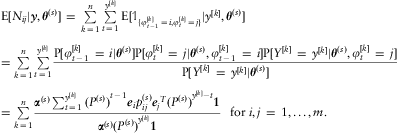
Conditional expectation Thanks to the linear nature of  $$$ {\rm{log}}\,f({\cal X}\:|\:\bitheta ) $$$
in the unobserved data
 $$$ {\cal Z}\, = \,\{ {{S}_i},{{N}_{ij}}:i,j\, = \,1, \ldots, m\} $$$
, the computation of the conditional expectation of
 $$$ \log f({\cal X}\:|\:{{\bitheta }^{(s)}} ) $$$
at the
 $$$ (s\, + \,1) $$$
th iteration reduces to the computation of
 $$$ {\rm{E}}[{\cal Z}\:|\:{\bf {{\bi y}}},{{\bitheta }^{(s)}} ] $$$
:
 $$\openup 5pt { {\rm{E}}[{{S}_i}\:|\:{\bi y},{{\bitheta }^{(s)}} ]\, &#x0026; = \,\mathop{\sum}\limits_{k\, = \,1}^n {\rm{E}}[{{\open 1}_{\{ \varphi _{{\rm{0}}}^{{[k]}} \, = \,i\} }}\:|\:{{y}^{[k]}}, {{\bitheta }^{(s)}} ] \hfill \cr &#x0026; = \,\mathop{\sum}\limits_{k\, = \,1}^n \displaystyle{\frac{{{\rm{P}}[\varphi _{0}^{{[k]}} \, = \,i\:|\:{{\bitheta }^{(s)}} ]\:{\rm{P}}[{{Y}^{[k]}} \, = \,{{y}^{[k]}} \:|\:{{\bitheta }^{(s)}}, \varphi _{{\rm{0}}}^{{[k]}} \, = \,i]}}{{{\rm{P}}[{{Y}^{[k]}} \, = \,{{y}^{[k]}} \:|\:{{\bitheta }^{(s)}} ]}}} \hfill \cr &#x0026; = \,\mathop{\sum}\limits_{k\, = \,1}^n \frac{{\alpha _{i}^{{(s)}} \:{\bi e}_{i}^{{\:\;T\:}} \:{{{({{P}^{(s)}} )}}^{{{y}^{[k]}} }} {\bf {{1}}}}}{{{{\bialpha }^{(s)}} \:{{{({{P}^{(s)}} )}}^{{{y}^{[k]}} }} \:{\bf {{1}}}}}\; \; \:\;{\rm{for}}\;\:i = 1, \ldots, m, \cr} $$
and
 $$\openup 5pt \matrix {{\rm{E}}[{{N}_{ij}}\:|\:{\bi y},{{\bitheta }^{(s)}} ]\, = \,\mathop{\sum}\limits_{k\, = \,1}^n \mathop{\sum}\limits_{t\, = \,1}^{{{y}^{[k]}} } {\rm{E}}[{{\open 1}_{\{ \varphi _{{t\,{\rm{ - }}\,1}}^{{[k]}} \, = \,i,\varphi _{t}^{{[k]}} \, = \,j\} }}\:|\:{{y}^{[k]}}, {{\bitheta }^{(s)}} ] \hfill \cr = \mathop{\sum}\limits_{k\, = \,1}^n \mathop{\sum}\limits_{t\, = \,1}^{{{y}^{[k]}} } \displaystyle{\frac{{{\rm{P}}[\varphi _{{t\,{\rm{ - }}\,1}}^{{[k]}} \, = \,i\:|\:{{{\rm{\bitheta }}}^{(s)}} ]\:{\rm{P}}[\varphi _{t}^{{[k]}} \, = \,j\:|\:{{\bitheta }^{(s)}}, \varphi _{{t\,{\rm{ - }}\,1}}^{{[k]}} \, = \,i]\:{\rm{P}}[{{Y}^{[k]}} \, = \,{{y}^{[k]}} \:|\:{{\bitheta }^{(s)}}, \varphi _{t}^{{[k]}} \, = \,j]}}{{{\rm{P}}[{{Y}^{[k]}} \, = \,{{y}^{[k]}} \:|\:{{{\rm{\bitheta }}}^{(s)}} ]}}} \hfill \cr = \mathop{\sum}\limits_{k\, = \,1}^n \displaystyle{\frac{{{{\bialpha }^{(s)}} \:\mathop{\sum}\nolimits_{t\, = \,1}^{{{y}^{[k]}} } \:{{{({{P}^{(s)}} )}}^{t\,{\rm{ - }}\,1}} \:{{\bi e}_i}\:p_{{ij}}^{{(s)}} \:{\bi e}_{j}^{{\:\;T\:}} \:{{{({{P}^{(s)}} )}}^{{{y}^{[k]}} {\rm{ - }}t}} \:{\bf {{1}}}}}{{{{\bialpha }^{(s)}} \:{{{({{P}^{(s)}} )}}^{{{y}^{[k]}} }} \:{\bf {{1}}}}}}\; \; \:\;{\rm{for}}\;\:i,j\, = \,1, \ldots, m. \hfill \cr $$
New estimates In the M-step, we obtain the new estimates  $$$ {{\bitheta }^{(s + 1)}} \, = \,({{\nu }^{(s + 1)}}, {{\bialpha }^{(s + 1)}}, {{P}^{(s + 1)}} ) $$$
by maximizing the log-likelihood (28) where
 $$$ \{ {{S}_i},{{N}_{ij}}:i,j\, = \,1, \ldots, p\} $$$
are replaced by their conditional expectations
 $$$ {\rm{E}}[{{S}_i}\:|\:{\bi y},{{\bitheta }^{(s)}} ] $$$
and
 $$$ {\rm{E}}[{{N}_{ij}}\:|\:{\bi y},{{\bitheta }^{(s)}} ] $$$
evaluated in the E-step. The maximization problem to be solved in this step is as follows
 $$\mathop {{\rm{max}}}\limits_{\bf {{\bitheta }}} \;{\rm{log}}\,f({\bi y},{\rm{E}}[{{{\rm{S}}}_i}\:|{{\bitheta }^{(s)}} ],{\rm{E}}[{{N}_{ij}}\:|{{\bitheta }^{(s)}} ]\:|\bitheta )$$
subject to
 $$ \bialpha {\bf {{1}}}\, = \,1,\; \; \; \; P{\bf {{1}}}\,\leq \,{\bf {{1}}},\; \; \; \; \nu \, \gt \,0,\; \; \; \; {{p}_{ij}},{{\alpha }_i}\,\geq \,0\; \; \:{\rm{for}}\;\:i,j\, = \,1, \ldots, m. $$
We implemented the EM algorithm in MATLAB and experimented with samples simulated from different PH-Poisson distributions. Below are the results of one such experiment.
Example 5.1 We used the PH-Poisson distribution  $$$ (\nu ;\bialpha, P) $$$
given in Example 4.6 to generate a sample with 1500 observations. The chosen initial parameters are
 $$$ {{\nu }^{({\rm{0}})}} \, = \,{\rm{10}} $$$
,
 $$$ {{\bialpha }^{({\rm{0}})}} \, = \,\left[ {\matrix { {{\rm{0}}{\rm{.1}}} &#x0026; {{\rm{0}}{\rm{.2}}} &#x0026; {{\rm{0}}{\rm{.4}}} &#x0026; {{\rm{0}}{\rm{.2}}} &#x0026; {{\rm{0}}{\rm{.1}}} \right] $$$
and
 $${{P}^{({\rm{0}})}} \, = \,{\rm{diag}}({\rm{0}}{\rm{.5,0}}{\rm{.3,0}}{\rm{.5,0}}{\rm{.7,0}}{\rm{.1}}).$$
The estimated parameters obtained after 25 iterations of the EM algorithm are  $$$ {{\nu }^{({\rm{25}})}} \, = \,{\rm{20}}{\rm{.4290}} $$$
,
 $$$ {{\bialpha }^{({\rm{25}})}} \, = \,\left[ {\matrix { {{\rm{0}}{\rm{.9054}}} &#x0026; {{\rm{0}}{\rm{.060}}} &#x0026; {{ 0}}{\rm{.0335}}} \quad&#x0026; {{\rm{0}}{\rm{.0000}}} \quad&#x0026; {{\rm{0}}{\rm{.0010}}} \right] $$$
, and
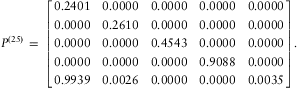 $$ {{P}^{({\rm{25}})}} \, = \,\left[ {\matrix { {{\rm{0}}{\rm{.2401}}} &#x0026; {{\rm{0}}{\rm{.0000}}} &#x0026; {{\rm{0}}{\rm{.0000}}} &#x0026; {{\rm{0}}{\rm{.0000}}} &#x0026; {{\rm{0}}{\rm{.0000}}} \hfill \cr {{\rm{0}}{\rm{.0000}}} &#x0026; {{\rm{0}}{\rm{.2610}}} &#x0026; {{\rm{0}}{\rm{.0000}}} &#x0026; {{\rm{0}}{\rm{.0000}}} &#x0026; {{\rm{0}}{\rm{.0000}}} \hfill \cr {{\rm{0}}{\rm{.0000}}} &#x0026; {{\rm{0}}{\rm{.0000}}} &#x0026; {{\rm{0}}{\rm{.4543}}} &#x0026; {{\rm{0}}{\rm{.0000}}} &#x0026; {{\rm{0}}{\rm{.0000}}} \hfill \cr {{\rm{0}}{\rm{.0000}}} &#x0026; {{\rm{0}}{\rm{.0000}}} &#x0026; {{\rm{0}}{\rm{.0000}}} &#x0026; {{\rm{0}}{\rm{.9088}}} &#x0026; {{\rm{0}}{\rm{.0000}}} \hfill \cr {{\rm{0}}{\rm{.9939}}} &#x0026; {{\rm{0}}{\rm{.0026}}} &#x0026; {{\rm{0}}{\rm{.0000}}} &#x0026; {{\rm{0}}{\rm{.0000}}} &#x0026; {{\rm{0}}{\rm{.0035}}} }} \right]. $$
The Manhattan norm  $$$ || \cdot {{||}_{\rm{1}}} $$$
of the difference between the true density and the empirical data is 0.1109, between the true density and the estimated density is 0.1043, and between the empirical data and the estimated density is 0.1400. We plot four densities in Figure 4: that for the true PH-Poisson distribution, the empirical data, the initial density and the estimated density.
Density function for the true PH-Poisson distribution (the dotted curve), empirical data (the dashed curve), the initial density (the curve marked with  $$$ \circ $$$
) and the estimated density (the continuous curve).
It is well-known that although the sequence  $$$ {{\{ {{\bitheta }^{(s)}} \} }_{s\,\geq \,{\rm{1}}}} $$$
computed with the EM algorithm always converges, it does not always converge to the maximum-likelihood estimator
 $$$ \hat{\bitheta } $$$
, but possibly to some local maximum or stationary value of
 $$$ {\rm{log}}\,f({\cal X}|\bitheta ) $$$
. The warranty of global convergence for the EM algorithm depends on properties of the conditional density of the incomplete data
 $$$ {\cal Y} $$$
given θ, and sometimes also on the starting point
 $$$ {{\bitheta }^{(0)}} $$$
. We refer to Dempster et al. (Reference Dempster, Laird and Rubin1977) for further details on the EM algorithm, and to Wu (Reference Wu1983) for its convergence properties.
Our experiments were performed using the MATLAB optimization routine fmincon to solve the maximization problem in the M-step. They indicated that the results were highly sensitive to the choice of  $$$ {{\bitheta }^{(0)}} $$$
. When the starting point was chosen randomly, we observed that the EM algorithm often converged to a Poisson distribution with parameter
 $$$ \mathop{\sum}\nolimits_{k\, = \,1}^n {{y}^{[k]}} /n $$$
, even if this was a rather poor fit for the given sample. Convergence to a good fit was obtained with a starting point that either shares the same structure of zeros with the true parameters α and P, or has a strictly positive
 $$$ {{\bialpha }^{(0)}} $$$
and a diagonal matrix
 $$$ {{P}^{({\rm{0}})}} $$$
—a mixture of Poisson distributions.
The latter choice is obviously more practical when the structure of the true parameters is not known a priori. Empirically, a diagonal  $$$ {{P}^{({\rm{0}})}} $$$
proved to be a good starting point even if the true matrix P is not diagonal. Note that, unlike its counterpart for fitting discrete Phase-type distributions in Asmussen et al. (Reference Asmussen, Nerman and Olsson1996), the EM algorithm for fitting PH-Poisson distributions does not necessarily preserve the initial structure. This is due to the term
 $$$ {\rm{ - }}n{\rm{log}}(\bialpha {{e}^{\nu P}} {\bf {{1}}}) $$$
in (28). Consequently, when starting with a diagonal
 $$$ {{P}^{({\rm{0}})}} $$$
the EM algorithm does not necessarily converge to a diagonal P. An interesting question for future research is to explain why mixtures of Poisson distributions serve as good starting points in the EM algorithm for fitting Phase-type Poisson distributions.
Acknowledgment
All three authors thank the Ministère de la Communauté française de Belgique for funding this research through the ARC grant AUWB-08/13–ULB 5. The first and third authors also acknowledge the Australian Research Council for funding part of the work through the Discovery Grant DP110101663.





