Implication
This study relates efficiency of inputs used to produce milk on dairy farms with the exposure to gastrointestinal nematodes. A new measure was developed to identify the farm’s unique allocation of inputs. Together with the technical efficiency (TE) score, this allowed to cluster farms on their unique input-output position. We found that the relation between the level of exposure to infection, input allocation, TE and the economic farm performance was specific for the different clusters. This emphasises the importance of considering farm specificity in input-output transformation when assessing the farm economic performance in relation to infection.
Introduction
The exposure of dairy cows to gastrointestinal (GI) nematodes affects farm productivity and leads to inefficient farming. In literature, most studies assess the impact of GI nematodes on partial productivity measures such as milk production per cow (Charlier et al., Reference Charlier, Höglund, von Samson-Himmelstjerna, Dorny and Vercruysse2009; Blanco-Penedo et al., Reference Blanco-Penedo, Högland, Fall and Emanuelson2012), daily weight gain (Dimander et al., Reference Dimander, Höglund, Uggla, Spörndly and Waller2003) and reproductive performance (Sanchez and Dohoo, Reference Sanchez and Dohoo2002; Sithole et al., Reference Sithole, Dohoo, Leslie, DesCoteaux, Godden, Campbell, Keefe and Sanchez2006). However, analysing the effect of GI nematodes and control measures on the whole-farm performance requires a more integrative approach (Morgan et al., Reference Morgan, Charlier, Hendrickx, Biggeri, Catalan, von Samson-Himmelstjerna, Demeler, Müller, van Dijk, Kenyon, Skuce, Höglund, O’Kiely, van Ranst, de Waal, Rinaldi, Cringoli, Hertzberg, Torgerson, Wolstenholme and Vercruysse2013; van der Voort et al., Reference van der Voort, Charlier, Lauwers, Vercruysse, Van Huylenbroeck and Van Meensel2013).
In literature, studies are found that address the impact of animal diseases such as metabolic disorders, lameness (Lawson et al., Reference Lawson, Agger, Lund and Coelli2004; Barnes et al., Reference Barnes, Rutherford, Langford and Haskell2011) and GI nematode infections (van der Voort et al., Reference Vanderstichel, Dohoo, Sanchez and Conboy2014) on the technical efficiency (TE) of dairy farms. TE is a measure of the farmer’s ability to use a minimal amount of inputs (e.g. feed and labour) to produce a given level of outputs (e.g. milk and meat), or the ability to produce maximal amounts of outputs with a given level of inputs (Farrell, Reference Farrell1957). Inefficiency is identified by comparing the current performance levels of farms with their potential optimal performance level. The efficiency of a farm lies between 0 and 1, where 0 indicates full inefficiency and 1 full efficiency (Coelli et al., Reference Coelli, Rao, O’Donnell and Battese2005). An advantage of an efficiency score is that it integrates partial productivity indicators into one overall technical and/or economic performance measure of the farm. Existing efficiency studies in animal health economics face some important drawbacks, however.
First, the TE only measures a proportional reduction potential of inputs and therefore ignores allocative differences in input mixes. This limits the understanding of the input-output transformation, the disease and the economic performance. For example, farms with similar TE scores can use different combinations of roughage, concentrates and pasture, and they can pay different input prices (van der Voort et al., Reference van der Voort, Charlier, Lauwers, Vercruysse, Van Huylenbroeck and Van Meensel2013). This will not only influence the economic performance, but also the exposure to infection (Vanderstichel et al., Reference van der Voort, Van Meensel, Lauwers, Vercruysse, Van Huylenbroeck and Charlier2012).
Second, efficiency studies assume that the presence of an animal disease affects the TE of the farm. However, reverse causation may also be expected because the efficiency of farms may affect the level of animal disease. Thus, a unidirectional causality between efficiency and the animal disease may result in erroneous conclusions.
Finally, traditional efficiency studies do not take the farm-specific impact of animal diseases on farm performances sufficiently into account. Existing studies mainly report the average effect of diseases and management measures on TE. The heterogeneity of dairy farms may result in differences in exposure to infection and the actual impact of disease (Charlier et al., Reference Charlier, Duchateau, Claerebout, Williams and Vercruysse2007; Bennema et al., Reference Bennema, Vercruysse, Morgan, Stafford, Höglund, Demeler, von Samson-Himmelstjerna and Charlier2010). The factors influencing the level of disease and economic performance for each individual farm cannot be studied in a feasible way. However, by using classification systems, different types of farms may be identified with different interactions between input use, animal disease and efficiency (Usai et al., Reference Usai, Casu, Molle, Decandia, Ligios and Carta2006; Gelasakis et al., Reference Gelasakis, Valergakis, Arsenos and Banos2012).
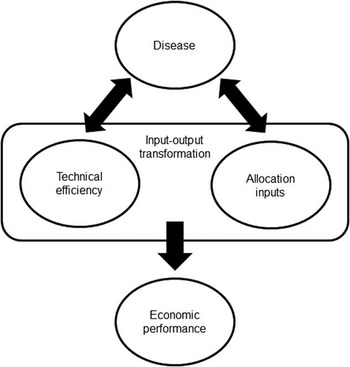
The objective of this paper is to study the relationship between exposure to GI nematode infections, TE and the allocation of inputs on dairy farms. The relation between the TE, allocation of inputs, economic farm performance and animal disease is presented in Figure 1. The link between input allocation and economic performance is traditionally captured by the cost allocative efficiency (CAE) score, but this is not sufficient for linking input allocation with infection levels. Therefore, an adjusted allocative efficiency index (AAEI) is introduced. In order to avoid erroneous conclusions, no a priori assumptions are made on the direction of causality between infection and the input-output transformation. Instead, farms with a similar input-output position are clustered and within each group the associations between GI nematode infection and economic parameters are described.
The relation between disease, the farm’s input-output transformation and economic performance.

Materials and methods
Data collection
In this study, we used a sample of dairy farms in Flanders. Data on the exposure to GI nematodes were collected from a yearly parasitic monitoring campaign. The same herds as described by Bennema et al. (Reference Bennema, Ducheyne, Vercruysse, Hendrickx, Claerebout and Charlier2011) were followed up for the period 2006–2010. The cows’ exposure to GI nematodes was monitored using antibody detection Ostertagia ostertagi ELISA (SVANOVIR® O. ostertagi-Ab, Boehringer Ingelheim Svanova, Uppsala, Sweden) applied to bulk-tank milk as described by Charlier et al. (Reference Charlier, Höglund, von Samson-Himmelstjerna, Dorny and Vercruysse2009). Farm accountancy data were also collected for the years 2006–2010 from the Tiber Farm Accounting System used by Boerenbond, a Flemish farmers’ union. The data of farms present in both the infection and accountancy data were merged. The data of the 5 consecutive years (2006–2010) were pooled to avoid the effect of seasonal variation, price fluctuations and measurement errors. The data pooling required that individual farm data were available for at least 2 consecutive years. This resulted in a cross-sectional sample of 152 farms.
To collect more details on the grazing management practices, the results of two survey questionnaires were also taken into account. Grazing management is indeed an important explanatory factor for the level of exposure to GI nematode infections (Bennema et al., Reference Bennema, Vercruysse, Morgan, Stafford, Höglund, Demeler, von Samson-Himmelstjerna and Charlier2010; Sekiya et al., Reference Sekiya, Zintl and Doherty2013). The data of the first questionnaire were collected in 2006 by Bennema et al. (Reference Bennema, Vercruysse, Morgan, Stafford, Höglund, Demeler, von Samson-Himmelstjerna and Charlier2010); data were available for 84 farms of the 152 farms in our data set. For the second questionnaire, all 152 farms received a questionnaire by post in the period October to December 2013; 75 farmers answered this questionnaire. The questionnaire includes questions referring to the 2013 situation about grazing management related to adult dairy cattle (from first calving onwards). In addition, the farmer’s opinion on the evolution (e.g. daily grazing time) of the farm during the past 5 years (2006-2013) was included to understand grazing management changes. By pooling all of these data, we created a unique data set for use in this study.
Data envelopment analysis (DEA)
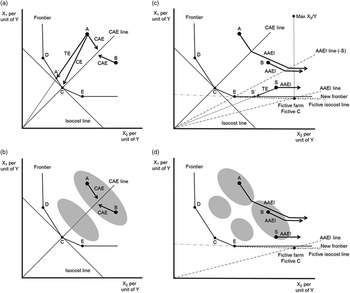
An input distance approach with DEA was used to measure the efficiency of the dairy farms. DEA involves linear programming to construct a non-parametric piecewise frontier over the data. This piecewise frontier links technically efficient farms that constitute the angular points of the frontier. Figure 2a illustrates the basic concept of an input-oriented DEA. For didactic reasons, a two-input (X) one-output (Y) framework is used. DEA compares the current input-output transformation of a farm with the efficient performance level. Farms C, D and E are technically efficient farms that define the frontier and represent the best practice technology (i.e. benchmark) of a particular group of farms at a given time. Farms A and B are technically inefficient farms. They do not lie on the frontier and can improve their TE by using the same proportion, but smaller amounts, of all inputs to produce the same amount of output, resulting in a radial move towards the frontier. The TE of farm A is represented by the distance between A and A'. On the frontier, an allocation of inputs can be identified that implies the minimisation of input costs (i.e. point C). This cost-efficient point is situated where the isocost line, representing input allocations with the same input costs given the input prices, is tangent to the frontier. The location of point C depends on the prices of inputs and the curvature of the frontier. Cost efficiency (CE) is the product of TE and CAE, where CAE represents the ability to use inputs in an optimal proportion given the input prices. A movement towards point C implies both an increase in TE (from point A to A') and CAE (from point A' to C). A detailed introductory description of DEA can be found in Coelli et al. (Reference Coelli, Rao, O’Donnell and Battese2005).
Using Data Envelopment Analysis to determine the farm’s allocation of inputs in a two-input one-output framework. (a) Efficiency framework presenting the concept of technical efficiency (TE), cost allocative efficiency (CAE), cost efficiency (CE), the cost-efficient point (C) and farms with a similar CAE scores (farms A and B) but a different input allocation; (b) example of groups of farms when clustered on TE and CAE, where farms with similar CAE scores, but different allocations of inputs are positioned in the same group; (c) introducing the adjusted allocative efficiency index (AAEI). A fictive technically efficient farm is formed that becomes part of a new frontier, based on the maximum X2/Y in the sample, and minimum X1/Y minus a very small number. This fictive farm allows construction of an AAEI line in such way that all farms of the sample become positioned at the same side of the AAEI line, including slacks (i.e. farm S). (d) Example of groups of farms when clustered on TE and AAEI scores, where farms with different AAEI scores (farms A and B) are grouped based on their unique allocation of inputs.

To assess the efficiency scores, milk production in litres of energy-corrected milk was considered as the output variable. Only one output was considered, because from a production economic viewpoint, the objective of specialised dairy farms is to produce milk. Moreover, for the farms in our data set, 90% of farm revenues came from milk sales. Our model included five input variables: (1) concentrate intake (expressed in kilograms used), (2) roughage intake (expressed in kilograms used), (3) pasture (expressed in hectares, i.e. the sum of grazed grassland and grassland used for roughage), (4) number of dairy cattle in the herd and (5) remaining variable costs. As the kilograms of roughage consumption were not directly available from the data set, we calculated them by using the average price per kilogram of each single-roughage product from the Belgium Farm Accountancy Data Network.
To study the technical and economic farm performances, TE, CE and CAE were estimated. To obtain the TE for the ith dairy farm the following linear programme was solved:
 $$\hskip -132pt { min}_{{\theta ,\lambda }} \theta $$
 $${\rm Subject \ to}\quad \matrix{ {\mathop \sum\limits_{i\,=\,1}^K \lambda _{i} y_{i} \,⩾\,y_{i} ,} \hfill \cr {\mathop \sum\limits_{i\,=\,1}^K \lambda _{i} x_{{n,i}} \,⩽\, \theta x_{{n,i}} ,\, n=1, \:\,\ldots\,, \:N, } \hfill \cr {\mathop \sum\limits_{i\,=\,1}^K \lambda _{i} \,⩾\, 0} \hfill \cr } $$
where λ i , x n,i , y i ⩾0, i=1, …, I; θ is the scalar TE score of farm i, y i the output produced by farm i, x n,i the amount of input n used by farm i and λ i the K×1 vector of weights that gives the technically efficient input-output combination for the ith farm. The linear programme was solved separately for each of the 152 farms. The study of van der Voort et al. (Reference Vanderstichel, Dohoo, Sanchez and Conboy2014) found the presence of constant returns to scale (CRS). This means that an increase in all inputs would result in an increase in output by the same factor. As the same data set was used is this study, CRS was assumed.
To obtain the CAE for the ith dairy farm, first the CE needs to be estimated by solving an additional linear programme. For obtaining the CE score for the ith farm, farm-specific prices were used, and the following equation was solved:
 $$\hskip -110pt min_{{\lambda ,xi}} \mathop \sum\limits_{i\,=\,1}^K w_{{n,i}} x_{{n,i}}^{{\asterisk}} $$
 $${\rm Subject \ to} \,\,\,\,\,\,\matrix{ {\mathop \sum\limits_{i\,=\,1}^K \lambda _{i} y_{i} \,⩾\, y_{i} ,} \hfill \cr {\mathop \sum\limits_{i\,=\,1}^K \lambda _{i} x_{{n,i}}^{{\asterisk}} \,⩽\, x_{{n,i}} , n=1, \:\,\ldots\,,\: N, } \hfill \cr {\mathop \sum\limits_{i\,=\,1}^K \lambda _{i} \,⩾\, 0} \hfill \cr } $$
where w n,i is the farm-specific price of input n (concentrates in €/kg, roughage in €/kg, pasture in €/ha and cow costs in €), and x n,i * the cost-efficient amount of input n used by farm i. The CE i was estimated as follows:
 $$CE_{i} ={{\sum_{i\,=\,1}^K w_{{n,i}} x_{{n,i}}^{{\asterisk}} } \over {\sum_{i\,=\,1}^K w_{{n,i}} x_{{n,i}} }}$$
Next, the CAE i was calculated residually by:
 $$CAE_{i} ={{CE_{i} } \over {TE_{i} }} $$
AAEI
An advantage of efficiency analysis is that the aggregate input-output transformation is considered against a performance benchmark. The challenge in our study was to determine the farms’ unique input-output position and link this position to the level of infection. The unique position of each farm can be determined by its TE and allocation of inputs.
Conventional CAE measures the extent to which inputs are used in a cost-minimising proportion, given the input prices and the curvature of the frontier. However, farms with similar CAE scores can have a different allocation of inputs (van der Voort et al., Reference van der Voort, Charlier, Lauwers, Vercruysse, Van Huylenbroeck and Van Meensel2013). Input prices may differ between farms and therefore, the location of the CAE line (i.e. the line representing the cost-minimising proportion of inputs at different TE levels, given the respective input prices) may also be different, resulting in similar CAE scores but representing different input allocations. Even when input prices and consequently also the CAE line are the same for all farms, similar CAE scores may imply different input allocations. Figure 2a shows that the distance to the CAE line is similar for farms A and B and therefore CAE scores are also similar. Nevertheless, both farms have a different allocation of inputs. Although CAE measures remain useful for the economic analysis (and are used below), they fail when classifying farms in similar input-output position groups. As illustrated by Figure 2b, farms with a different input allocation may be assigned to the same group when traditional CAE scores are used for clustering. Therefore, this study proposes a new measure that allows for estimating the farm’s unique allocation of inputs. We call this indicator the adjusted allocative efficiency index (AAEI).
The basis for the AAEI is the construction of a AAEI line, similar to the CAE line, but with all farms of the sample positioned at the same side of the line. The CAE line intersects the frontier in an angular point representing the technically efficient farm that has a cost-minimising input allocation. The AAEI line also intersects the frontier in an angular point. However, as illustrated in Figure 2c, this angular point cannot be an existing technically efficient farm (e.g. farm E) from our sample, because of the presence of so-called input slacks (illustrated by farm S). From its technically efficient point on the frontier (S'), farm S can further reduce the amount of input X2, whereas keeping the amount of the other input X1 and the amount of output unchanged (i.e. from point S' to E) (Coelli et al., Reference Coelli, Rao, O’Donnell and Battese2005). This means that when the intersection between the AAEI line (AAEI line (−S) in Figure 2c) and the frontier would be farm E, farms with an input slack for input X2 would still be positioned on the wrong side of the AAEI line.
Therefore, a fictive farm needs to be created, which is (1) technically efficient and (2) forms the intersection of the AAEI line and the frontier in such way that all farms of the sample become positioned at the same side of the AAEI line. In Figure 2c, a fictive farm is placed just underneath the initial frontier to become part of a new frontier, but without having an effect on the initial TE score of the farms in the sample. Therefore, the fictive farm uses an amount of input X1 per unit of output Y, which is the minimum amount of X1 per unit of Y over all farms in the sample minus a very small number, and an amount of input X2 per unit of Y, which is the maximum of X2 per unit of Y over all farms in the sample. In this study, we multiplied X1 per unit of Y with 0.999, which allowed to make the fictive farm technically efficient and thus an angular point from the frontier and without effecting the initial TE scores of the farms in the sample. As our study used five input variables, five fictive farms were determined. For each fictive farm, the minimum amount per unit of output minus a very small number was taken together with the maximum amount per unit of output of the other input variables. A set of fictive prices were chosen, which allowed the AAEI line to intersect the fictive farm. As illustrated by Figure 2d, the AAEI score represents the farm’s unique allocation of inputs. Together with the TE score, the AAEI scores allow to cluster farms based on their unique input-output position. In our study, the TE score of each farm was combined with five AAEI scores to determine the unique position of the farm, because five inputs were distinguished that allowed to construct five fictive farms.
Identifying groups of farms with similar input-output position
Next, cluster analysis was used to identify groups of dairy farms with similar input-output position, and to analyse whether these groups differ in their relation to the level of exposure to GI nematodes. Farms were clustered based on the TE and five AAEI scores. The number of clusters was chosen on the basis of the hierarchical Ward’s minimum variance method, minimising the sum of squared distances between individuals within a group and maximising the square distance between groups (Köbrich et al., Reference Köbrich, Rehman and Khan2003). The dendrogram and agglomeration schedule from Ward’s method and the interpretability of the obtained solutions were used to establish the most meaningful number of groups. When the appropriate number of groups was chosen, a non-hierarchical K-means cluster method was applied to cluster the farms. K-means clustering minimises the distance between the data and the corresponding cluster centroid. The squared Euclidean distance (the sum of the squared differences between the values of the clustering variables) was selected to measure the distance between cases in the cluster analysis.
Comparison of clusters
To characterise and compare the clusters, some descriptive statistics were calculated. The gross margin of each farm was calculated to explain the economic performances of dairy farms. Revenues and feed costs as components of the gross margin variable were calculated based on a price premium for milk and feed.
To explain differences between groups according to the input-output position, first, a Shapiro–Wilk test was performed to test the normality of the data. For the non-normal distributed data, a Kruskal–Wallis test was used to distinguish differences in the technical and economic variables among the identified groups of farms. For the normally distributed data, a one-way ANOVA was applied. A Bonferroni t-test was used for the mean comparison of data with equal variances and a post hoc Dunn test was used for the mean comparison of variables without equal variance. The level of significance was set at P<0.05. A Spearman’s rank test was performed to determine the correlation between the level of exposure to GI nematodes and the other variables. This analysis was performed to better understand the relationship between the position of the farm and the level of exposure to GI nematode infections.
Results
The farm groups
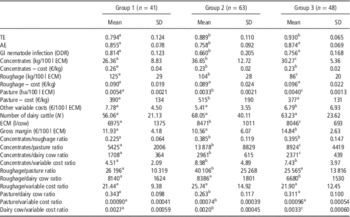
The three clusters included 48, 63 and 41 dairy farms, with distinct input-output positions based on TE and the AAEIs (Table 1). The farms of Group 1 had the lowest TE, their CAE lay between Groups 2 and 3, they used relatively low amounts of concentrates and they had the highest exposure to infection. In Group 2, the TE lay between Groups 1 and 3, the CAE was lowest, the farms used relatively high amounts of concentrates and the exposure to infection was lowest. Group 3 had the highest TE and CAE, used relatively low amounts of roughage and the exposure to infection lay between those of Groups 1 and 2. Below, we describe the economic performance and grazing management practices of the groups in more detail and assess the correlation of these parameters with the exposure to GI nematodes.
Means±standard deviation for continuous variables in three clusters and comparison between them

TE=technical efficiency; AE=allocative efficiency; GI=gastrointestinal; ODR=optical density ratio; ECM=energy-corrected milk.
a,b,cValues within a row with different superscripts differ significantly at P<0.05.
Group 1: low TE, relatively low use of concentrates and high level of exposure to infection
The low TE of Group 1 was reflected by the high use of roughage, pasture and the high variable costs per 100 l milk as well as the low milk production per cow (Table 1). In this group, use of concentrates was relatively low and use of pasture was relatively high. The average CAE lay between those of Groups 2 and 3. At the current price levels, becoming fully allocatively efficient was not possible in this group, because the allocatively efficient input combination can only be found in Group 3. The gross margin per 100 l milk lay between those of Groups 2 and 3.
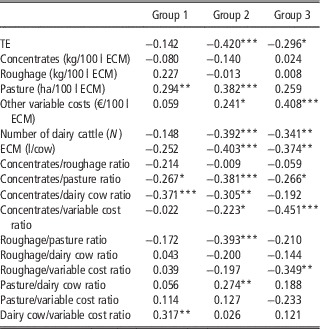
The level of exposure to infection was high. This was in accordance with the high proportion of grazed grass in the diet and the high proportion of farms with day and night grazing. A comparison of the answers on the two questionnaires indicated that over the years (2006–2013) the preventive measure of mowing pasture before grazing was less frequently applied and the length of the grazing season increased. All these changes are known to contribute to higher levels of GI nematode exposure (Bennema et al., Reference Bennema, Vercruysse, Morgan, Stafford, Höglund, Demeler, von Samson-Himmelstjerna and Charlier2010; Vanderstichel et al., Reference van der Voort, Van Meensel, Lauwers, Vercruysse, Van Huylenbroeck and Charlier2012; Morgan et al., Reference Morgan, Charlier, Hendrickx, Biggeri, Catalan, von Samson-Himmelstjerna, Demeler, Müller, van Dijk, Kenyon, Skuce, Höglund, O’Kiely, van Ranst, de Waal, Rinaldi, Cringoli, Hertzberg, Torgerson, Wolstenholme and Vercruysse2013). In Group 1, the level of exposure to infection was found to be positively correlated to pasture per 100 l milk and to the ratio ‘dairy cow/variable cost’ and negatively to the ratio ‘concentrates/pasture’ and ‘concentrates/dairy cow’ (Table 2).
Correlation to Ostertagia ostertagi infection level

TE=technical efficiency; ECM=energy-corrected milk.
*P<0.10, **P<0.05, ***P<0.01.
To improve the economic farm performances, farms can improve their TE by using less inputs or change the allocation of inputs by using the inputs in a more cost-minimising proportion. By using relatively more concentrates and/or less roughage the CAE of the farms can be improved. However, a change in TE or the allocation of inputs was not associated with a change in the level of exposure to infection.
Group 2: intermediate TE, relatively high use of concentrates and low level of exposure to infection level
Farms in Group 2 had an intermediate TE (Table 1). They used high amounts of concentrates per 100 l milk, used less pasture and variable costs per 100 l of milk and the milk production per cow was high. The CAE was lowest in Group 2. This indicates that, at the given input prices, the inputs were used in a low cost-minimising proportion. The gross margin was also lower compared with the other two groups. At the current price levels, becoming fully allocative efficient in Group 2 did not seem possible.
The low level of exposure in Group 2 could be explained by a more restricted access to pasture. When compared with Group 1, relatively less dairy farms of this group applied day and night access to pasture and relatively more farms mowed their pasture before grazing. In addition, over the years the grazing season and grazing time per day have been further decreased in this group. The TE and the ratio ‘concentrates/pasture’, ‘concentrates/dairy cattle’, ‘concentrates/variable cost’ and ‘roughage/pasture’ were negatively correlated with exposure to infection (Table 2). A strong positive correlation was observed between exposure to infection and pasture use per 100 l milk.
Economic improvement in this group was possible by a change in TE and/or allocation of inputs, which could be accompanied by a change in infection. Improving TE, in particular by using less pasture per 100 l of milk, was associated with a lower level of exposure to infection. Relatively, more pasture use and/or higher variable costs could may improve CAE, but both changes could have possibly resulted in a higher level of exposure to infection. This indicated a trade-off between optimising CAE and reducing exposure to infection.
Group 3: high TE, relatively low use of roughage and intermediate level of exposure to infection level
The high TE in this group was mainly owing to the low use of roughage per 100 l milk (Table 1). The use of concentrates and pasture per 100 l milk and the milk production per cow were intermediate. This group used a relatively low amount of roughage. The CAE was highest in Group 3. This indicated that the inputs were used in the most cost-minimising proportion, given the input prices. The gross margin was also highest for this group.
In Group 3, the level of exposure to infection lay between the two other groups. There were fewer farms with day and night grazing compared with Group 1, but compared with Group 2 cows spend more hours per day on grazing. Over the years, the average length of the grazing season decreased, but pasture was less frequently mowed before grazing. The TE, the milk production per cow and the ratio ‘concentrates/pasture’, ‘concentrates/variable costs’ and ‘roughage/variable costs’ were negatively correlated with infection (Table 2). The variable costs per 100 l of milk and exposure to infection were positively correlated.
Economic improvements in this group may be achieved by improving the TE and/or changing the allocation of inputs. Improving TE, in particular by producing more milk per cow and/or reducing the variable costs per 100 l of milk, were associated with a lower exposure to infection. Farms could become cost allocatively efficient in their own group by a relatively lower use of concentrates, roughage use and/or the variable costs. Relatively lower variable costs were associated with a lower level of exposure to infection. A win–win between optimising CAE and reducing the level of infection was thus possible for Group 3.
Discussion
The aim of this study was to shed more light on the relation between the level of exposure to GI nematode infections and the input-output position of dairy farms. Our method provides a novel approach by not only considering the TE and infection, but also the allocation of inputs. The approach allows for grouping farms according to their input-output position and to study the relations between input use and infections. This allows a more refined analysis than studying the average relation for a whole sample. In this section, we first discuss the methodology, followed by the interpretation and practical relevance of the results.
The approach used in this study extends the TE analysis with an allocative component, but not in a traditional way. The AAEI we constructed, in reaction to the problem that traditional CAE suffers from attributing the same score to different input combinations, may sound artificial at first glance. Indeed, many virtual sets of prices could be found that satisfy the objective to score farms on their unique allocation of inputs. However, although the use of different price combination results in different AAEI scores, but farms remain ranked in the same order and grouped in an identical way. The construction of the AAEI was applied under the assumption of CRS. Further research may determine whether and how this method can work under variable return to scale. This means that an increase in all inputs would result in an increase in output by more than the same factor.
Similar farms were grouped, given their unique position based on their TE and AAEI. Instead of using TE and AAEI for clustering, an alternative approach could be to cluster farms on single key variables, such as kilograms of concentrates used per litre milk and kilograms of roughage used per litre milk. However, the use of TE and AAEI scores results in more distinctive groups compared with clustering based on the farm’s input-output ratios (unpublished results). When clustering on the farm’s input-output ratios, only the variable ‘roughage per 100 l milk’ clearly differentiates between the groups. The other variables were diffusely scattered between groups.
The analysis of the relationship between GI nematode infection and farm economic performance does remain exploratory, as it is based on simple correlation analysis. Therefore, there may be a number of hidden confounding factors. Management factors, like feeding strategies, breeding practices and animal health practices can be confounding (Hansson and Öhlmér, Reference Hansson and Öhlmér2008; Hogeveen et al., Reference Hogeveen, Huijps and Lam2011). Other diseases may have interacted (Lawson et al., Reference Lawson, Agger, Lund and Coelli2004), because farms with a high exposure to GI nematodes may be more prone to other diseases as well. Moreover, the diagnostic ELISA applied cross-reacts with other helminthic infections (Charlier et al., Reference Charlier, Claerebout, Duchateau and Vercruysse2005). Despite these limiting factors, the following recommendations could be proposed for the groups.
As there was no correlation between TE and the allocation of inputs, the farms of Group 1 may better start by focussing on improving TE and CAE before considering a reduction in the level of exposure to infection. At the current prices, CAE improvement could be established by using relatively more concentrates and/or less roughage. Farms in Group 2 could not simultaneously improve CAE and reduce exposure to infection. Reducing infection was associated with lower pasture use, but also was expected to result in a lower CAE. As the level of exposure to infection was already low in this group, improving CAE may be a better choice. In Group 3, farms could increase CAE and reduce exposure to infection simultaneously. At the current prices, the CAE improvements suggested were to reduce concentrate use, roughage use and reduce variable costs.
This subcategorising of farms provides complementary information to refine recommendations regarding the control of GI nematode infections. Indeed, for each group, different relationships were found between TE, input allocation and the level of exposure to infection. This stresses the importance of farm-specific decisions in the case of GI nematode infections on dairy farms. For instance, in Group 2, a positive correlation was found between the ratio ‘pasture/dairy cow’ and the level of exposure, which was not found in the other groups. This may be explained by the limited access to pasture for adult dairy cattle or the presence of confinement housing found in this group. The results may suggest that increasing pasture has a more significant impact on infection on farms with limited access to pasture.
The results of this study depend on the current input prices. When relative prices of inputs change over time, the most cost-allocatively efficient combination can also change. The cost-allocatively efficient combination is now found in Group 3, but can move further away when prices for concentrates increase. Then the CAE of Group 3 may drop. Therefore, this study can be seen as a method, which can evolve into a decision support tool, where advice can be adjusted according to the current prices.
Efficiency analysis can be used in practice to give individual farm advice (Van Meensel et al., Reference Van Meensel, Lauwers, Kempen, Dessein and Van Huylenbroeck2012), but to make such practical farm decisions, more farm-specific information may be required. This study shows that accounting for the allocation of inputs on farms is important for current recommendations about GI nematode control. In this study, we focussed on allocating input use, but changes in grazing management and anthelmintic treatment can also significantly reduce the level of exposure to infection. Therefore, further research would be needed to understand the effects of changes in grazing management on the farm.
Conclusion
In the present study, we analysed the relationship between exposure to GI nematode infections, the TE and the allocation of inputs on dairy farms. Simultaneous improvement of farm economics and epidemiological performance is not easy; it depends on the farm input-output position and input prices. TE improvements were associated with lower levels of exposure to GI nematodes. However, the association between CAE improvement and the level of exposure to infection depends on the farm’s allocations of inputs and the level of input prices. Reducing infection seems to be most economically relevant for the group with a relatively high TE and a high level of exposure to infection. The results have demonstrated the need for determining input allocation as factor to evaluate farm performance in relation to GI nematode infections on dairy farms. Such insights can be further integrated into the development of practical decision support at individual farm level.
Acknowledgements
The work of M. v. d. V. was funded by a PhD grant of the Agency of Science and Technology of Flanders (IWT Vlaanderen, 101357). This study received funding from the EU FP7 GLOWORM project (Grant Agreement No. 288975CP-TP-KBBE.2011.1.3-04). The authors are grateful to Boerenbond and the dairy farmers for sharing their accountancy data.