Total protein and fat content are the two main criteria applied to sheep milk payment in many countries (Pirisi et al. Reference Pirisi, Lauret and Dubeuf2007). Further to that, most of the sheep milk is used for cheese making and it is well known that the cheese yield depends on the milk's protein content (Zervas & Tsiplakou, Reference Zervas and Tsiplakou2011). Proteins in ruminant milks are comprised of about 80% caseins and 20% whey proteins (Wang et al. Reference Wang, Gerstein and Snyder2009; Kukovics & Németh, Reference Kukovics, Németh, Park and Haenlein2013). In sheep milk, there exist six major proteins comprising about 95% of the total protein and classified into four caseins (αs1-, αs2-, β-and κ-) and two whey proteins (α-lactalbumin and β-lactoglobulin) encoded by CSN1S1, CSN1S2, CSN2, CSN3, LALBA and BLG genes respectively (Barłowska et al. Reference Barłowska, Wolanciuk, Litwińczuk and Król2012).
Despite the fact that the range of milk protein concentration is much narrower than that of fat, nutrition is one of the most important factors which can influence it. Up to now, the majority of the nutritional studies have determined the impact of the energy and crude protein content of the diet on sheep milk protein content (Pulina et al. Reference Pulina, Nudda, Battacone and Cannas2006). Indeed, Bocquier & Caja (Reference Bocquier and Caja2001) observed that the protein concentration in sheep milk (r = 0·64) is positively associated with the energy content of the diet, while Cannas et al. (Reference Cannas, Pes, Mancuso, Vodret and Nudda1998) found that increasing dietary crude protein content did not change the milk protein concentration but did increase the milk protein yield.
Despite the fact that the milk protein concentration or the milk protein yield in sheep is modified by the energy as well as the crude protein availability of the diet, no information exists so far concerning the nutritional regulation of genes encoding the six major milk proteins in the mammary tissue (MT) of sheep. Until now, the effects of energy restriction on the expression of some milk protein genes have been studied in cows in both mammary epithelial cells (MEC) purified from milk (Boutinaud et al. Reference Boutinaud, Ben Chedly, Delamaire and Guinard-Flament2008; Sigl et al. Reference Sigl, Meyer and Wiedemann2014) as well as in their mammary tissue (MT) (Dessauge et al. Reference Dessauge, Lollivier, Ponchon, Bruckmaier, Finot, Wiart, Cutullic, Disenhaus, Barbey and Bautinaud2011) and in goat MT after a 48 h food deprivation (Ollier et al. Reference Ollier, Robert-Granie, Bernard, Chilliard and Leroux2007).
Therefore, the aim of the present study was to determine the effect of long term under- and over-feeding on the expression of genes (CSN1S1, CSN1S2, CSN2, CSN3, LALBA and BLG) related to milk protein synthesis in sheep MT.
Materials and methods
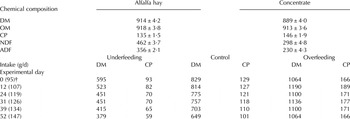
The experiment was conducted according to guidelines of the Agricultural University of Athens for the care and use of farm animals by the use of proper management in order to avoid any unnecessary discomfort to the animals. Twenty-four Friesian cross bred dairy sheep of 3-year-old at 90–98 d in milk were divided into three groups (n = 8) based on their mean body weight (BW) (59 ± 4·1 kg) and their mean daily milk yield (1·01 ± 0·197 kg). Each sheep of each group was fed individually throughout the experimental period which lasted 60 d (Zervas, Reference Zervas2007). The three groups (treatments) were fed with a diet which comprosed 70% (under-feeding), 100% (control), and 130% (over-feeding) of their daily individual energy and crude protein requirements, respectively. The quantities of food offered to the animals were adjusted at the 0, 12, 24, 31, 39 and 52 experimental day in order to meet the 70%, 100% and 130% of animal's requirements of each group respectively throughout the experimental period. The average daily dry matter and crude protein intake of each group is shown in Table 1. The nutritional status of each treated group in the present study corresponded to their feed intake and BW changes. Indeed, the control sheep kept more or less constant BW (+2 kg), while the underfed animals lost (−8 kg) and the overfed put on (+10 kg) weight throughout the experimental period. Moreover, the average fat corrected milk changes from the beginning to the end of the experimental period was −0·72, −0·53 and −0·10 kg for the underfed, control and overfed groups respectively, as already has been observed by Tsiplakou et al. (Reference Tsiplakou, Chadio and Zervas2012). The diet given to sheep consisted of alfalfa hay and concentrates with a forage/concentrate ratio = 50/50. The full experimental design has been described with details in the paper of Tsiplakou et al. (Reference Tsiplakou, Chadio and Zervas2012).
Chemical composition (g/kg) of alfalfa hay (n = 6) and concentrates (n = 6) and the daily dry matter (DM) and crude protein (CP) intake (g) throughout the experimental period

† Figures in brackets are shown the days in milk
Sample collection
Milk samples
Individual milk samples were collected from both halves of the udder before biopsies at the 30th and 60th experimental day for milk yield and protein measurements after mixing the yield from the evening and the morning milking on a per cent volume (5%). The milk samples were also analysed for protein and lactose with IR spectrometry (Milkoscan 133/ Foss Electric, Hilerød, Denmark), after appropriate calibration of the instrument according to Kjeldahl (IDF, 1993).
Mammary tissue
Mammary tissue samples were taken by biopsy on the 30th and 60th experimental day of each dietary treatment after the morning milking. Before the biopsy, the udder of the animals was shaved and cleaned, and local anaesthesia was administered by subcutaneous injection of 2 ml lidocaine hydrochloride (xylocaine 2%, AstraZenera, Athens, Greece). A 2-mm incision was made to facilitate the insertion of the biopsy needle. Biopsy samples were taken from the right udder using a Bard ®Magnum® Biopsy instrument (BARD, Athens, Greece) in which the BARD biopsy needle (14G) was adapted (BARD, Athens Greece). The length of the sample notch was about 1·9 cm and approximately 15 mg tissue was collected from a depth of 3–5 cm. After the tissue samples were taken, a stapler (Leukoclip SD, Smith and Nephew, England) was used to close the wound and the site of sampling received a prophylactic treatment with a disinfecting powder (Terramycin, w/Polymyxin, Pfizer, Athens, Hellas, containing 33·812 mg oxytetracycline hydrochloride and 1·457 mg Polymyxin B sulphate as active ingredients) and then covered with spray (Oxyvet spray, Provet, Athens, Greece, containing 2·2 g oxytetracycline HCL) for the plaster. Immediately after the biopsy sampling, all animals received antibiotic prophylaxis with 5 ml of Terramycin Long Acting (Pfizer, Athens, Hellas, containing 217·40 mg oxytetracycline dihydrate).
Determination of transcript levels using real-time RT-qPCR assay
Total RNA was isolated from 15 mg of MT using Trizol reagent (Thermo Fisher Scientific, Waltham, Massachusetts, USA) according to the manufacturer protocol. Prior to RT-PCR, the total RNA samples were treated with DNase I (Promega, Madison, WI) at 37 °C for 60 min. The RNA quality was assessed by agarose gel electrophoresis, the quantity was measured with a NanoDrop ND-1000 spectrophotometer, while the purity was determined by the ratio A260/A280 > 1·9. Successful removal of genomic DNA was tested by PCR using specific primers for the housekeeping genes [ribosomal protein S9 (RPS9) and ubiquitously expressed transcript protein (UXT)] and the absence of DNA contamination was confirmed by agarose gel. The complete digestion of genomic DNA was confirmed by real-time PCR reaction using our gene specific primers. First-strand cDNA was reverse transcribed from 2 μg of DNase-treated total RNA, using SuperScript II reverse transcriptase (Invitrogen), according to standard protocols. The resulted first-strand cDNA was diluted to a final volume of 100 μl, and SYBR green-labelled PCR fragments were amplified using gene-specific primers (Table 2) designed from the transcribed region of each gene using Primer Express 1·5 software (Applied Biosystems, Darmstadt, DE). RT-PCR reactions were performed on the Stratagene MX3005P real-time PCR apparatus using iTaq Fast SYBR Green Supermix with ROX (BioRad, Hercules, CA) at a final volume of 15 μl, gene-specific primers at a final concentration of 0·2 μm each and 1 μl of the cDNA as template. PCR cycling started at 95 °C for 10 min, followed by 40 cycles of 95 °C for 15 s and 60 °C for 1 min. The primer specificity and the formation of primer-dimmers were monitored by dissociation curve analysis and agarose gel electrophoresis. The geometrical average of the expression levels from RPS9 and UXT genes was used as internal standard (Bionaz & Loor, Reference Bionaz and Loor2007). Relative transcript levels of the gene of interest (X) were calculated as a ratio to the geometrical average of RPS9 and UXT (C), as (1+E)−ΔCt, where ΔCt was calculated as (CtX–CtC). PCR efficiency (E) (Table 2) for each amplicon was calculated employing the linear regression method on the Log (Fluorescence) per cycle number data, using the LinRegPCR software (Ramakers et al. Reference Ramakers, Ruijter, Deprez and Moorman2003). While some studies have identified stable references genes for cows (Bionaz & Loor, Reference Bionaz and Loor2007) and goats (Bonnet et al. Reference Bonnet, Bernard, Bes and Leroux2013) MT during lactation there is scarce information, to the best of our knowledge, for sheep. So, based on the fact that the UXT has been proposed both in cows and goats as a stable reference gene for the MT during lactation (Bionaz & Loor, Reference Bionaz and Loor2007; Bonnet et al. Reference Bonnet, Bernard, Bes and Leroux2013) it was also selected in the present study. Additionally, the UXT has been used as a reference gene in a recent study with sheep MT (Carcangiu et al. Reference Carcangiu, Mura, Daga, Luridiana, Bodano, Sanna, Diaz and Cosso2013). Regarding the choice of RPS9, this took into account that it has been characterised also by high stability in the MT of cows (Bionaz & Loor, Reference Bionaz and Loor2007) while in goats, Finot et al. (Reference Finot, Guy-Marnet and Dessauge2011) concluded that the choice of reference genes should include at least one ribosomal protein gene.
Primers used for real-time qPCR and the mean PCR efficiency for each gene as calculated by LinRegPCR software (Ramakers et al. Reference Ramakers, Ruijter, Deprez and Moorman2003)

Chemical composition of feed samples
Six samples of alfalfa hay and 6 concentrates were analysed for organic matter (OM; Official Method 7·009), dry matter (DM; Official Method 7·007) and crude protein (CP; Official Method 7·016) according to AOAC (1984) and for Neutral Detergent Fibre (NDF) assayed without a heat stable amylase and Acid Detergent Fibre (ADF) expressed exclusive of residual ash according to Van Soest et al. (Reference Van Soest, Robertson and Lewis1991) (Table 1).
Statistical analysis
The experimental data were analysed using the SPSS statistical package (version 16·0) using a general linear model (GLM) for repeated measures analysis of variance (ANOVA) with dietary treatments (T) (under-feeding = 70%; control = 100%; over-feeding = 130%) and sampling time (S) as fixed effects and their interactions (T × S) according to the model:
 $$Y_{ijk} \, = \,{\rm \mu} + T_i + S_j + (T \times S)_{ij} \, + \,A_k \, + \,e_{ijk} $$
where Y ijk is the dependent variable, μ the overall mean, Ti the effect of dietary treatment, S j the effect of sampling time, (T × S)ij the interaction between dietary treatments and sampling time, A k the animal's effect and e ijk the residual error. Multiple comparisons were obtained using Tukey's test. Pearson's correlation coefficients were used to determine relationships between genes expression data and milk protein and lactose yield as well as milk protein and lactose percentages. Kolmogorov-Smirnov test revealed that data followed normal distribution. Significance was set at 0·05.
Results
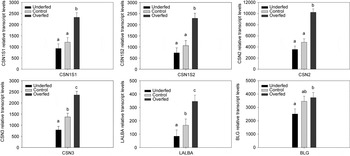
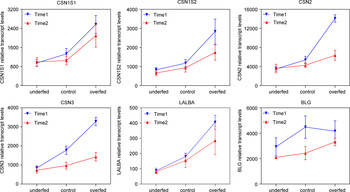
The results showed a significant reduction in the milk and protein yield of the underfed sheep compared with the overfed (Table 3). Significant down regulation on the expressions of CSN1S1, CSN1S2, CSN2, CSN3, LALBA and LBG gene in the MT of underfed sheep compared with the overfed was found (Fig. 1). The overfed sheep had significantly higher mRNA transcript accumulation of the six milk protein genes in their MT, not only from the underfed but as well as from the control animals (Fig. 1). Additionally, the mRNA levels of the CSN3 and LALBA gene were significantly lower in the MT of the underfed sheep in comparison with the respective control and overfed ones (Fig. 1). Moreover, a reduction in the mRNA abundance of the six milk protein genes in the MT of sheep between the sampling time (30th and 60th experimental day) was found with the results being significant for the CSN1S1, CSN2, CSN3 and LBG gene (Table 4). The interaction between the dietary treatments (T) and the sampling time (S) for the mRNA transcript accumulation of the milk protein genes are presented in Fig. 2. The interaction was significant only for the CSN2 and CSN3 gene. Finally, significantly positive correlations for the mRNA levels of milk protein genes with the milk protein yield, lactose content (%), lactose yield and the milk yield was found (Table 5). On the other hand significantly negative correlations between the mRNA abundance of the CSN1S1, CSN3 and LALBA gene with the milk protein content were observed (Table 5).
Relative transcript accumulation of genes involved in milk proteins metabolism: as1-casein : CSN1S1, as2-casein : CSN1S2, β-casein: CSN2, κ-casein: CSN3, α-lactalbumin: LALBA and β-lactoglobulin: BLG. Bars show means ± sem of both 30th and 60th experimental days. Superscripts with small letters (a,b,c) between the three dietary treatments (underfeeding/control/overfeeding) differ significantly (P < 0·05). The units in diagrams are arbitrary.

The interaction between dietary treatments (underfeeding/control/overfeeding) (T) and sampling time (30th and 60th experimental day) (S) for the relative transcript accumulation of milk proteins genes.

Milk yield (kg/d), protein and lactose content (%) and protein and lactose yield (g/d) in sheep of the three dietary treatments at the two sampling times (30th and 60th experimental day)

Means with different superscript (a, b) in each row (between the three dietary treatments, and between the two sampling times) for each parameter differ significantly (P ⩽ 0·05)
The mean relative transcript accumulation of milk proteins genes in sheep mammary gland of the three dietary treatments, at the two sampling times (30th and 60th experimental day).

Means with different superscript (a, b, c) in each row (between the three dietary treatments, and between the two sampling times) for each gene differ significantly (P ⩽ 0·05)
Pearson's correlation coefficients between the mRNA gene expression data and milk protein (%), protein yield (g/d), lactose (%), lactose yield (g/d) and milk yield (Kg/d) at the two sampling times (30th and 60th experimental day)

The units in the Table are arbitrary
* P < 0·05, **P < 0·01, and ***P < 0·001.
Discussion
Even though the dietary energy and crude protein content affects the protein yield in sheep milk, little is known so far about the impact of the feeding level on the molecular regulation of milk protein genes in their MT. In this study, a significant reduction on the mRNA levels of milk proteins (CSN1S1, CSN1S2, CSN2 and LBG) genes in the MT of underfed sheep compared with the overfed and between the CSN3 and LALBA genes expression in the MT of underfed sheep compared with the respective control and overfed was observed (Fig. 1), which was accompanied by a significant decrease in protein yield in their milk (Table 3). In agreement with our findings, a significant decrease has been found in the CSN1S1, CSN1S2, CSN2, LALBA and LBG transcripts accumulation in the MT of goats after a 48 h food deprivation, starting around the 48th day post partum, which was also associated with a sharp fall in protein yield in their milk (Ollier et al. Reference Ollier, Robert-Granie, Bernard, Chilliard and Leroux2007). The same was observed by Dessauge et al. (Reference Dessauge, Lollivier, Ponchon, Bruckmaier, Finot, Wiart, Cutullic, Disenhaus, Barbey and Bautinaud2011) for the CSN3 and LALBA gene expression in the MT of cows after 11 weeks of feed restriction which was followed by a significant drop in their milk protein yield. Since protein synthesis, after ion transport, is one of the most energetically costly processes in the cell, the impact of the positive energy balance on the milk protein genes expression in the MT may be due partly to the availability of energetic precursors. Further to that, another way with which the positive energy balance induces the milk protein genes expression in the MT may be also due through the increase in insulin secretion. Indeed, Menzies et al. (Reference Menzies, Lefévre, Macmillan and Nicholas2009) showed that insulin stimulates the expression of all casein genes in bovine MT and concluded that the maximum induction of both LALBA and BLG gene in bovine MT required insulin in the presence of hydrocortisone and prolactin. Additionally, Choi et al. (Reference Choi, Barash and Rhoads2004) indicated in vitro that there is an absolute requirement for insulin in the presence of prolactin for the induction of CSN2 gene expression in mouse epithelial cells, while Shao et al. (Reference Shao, Wall, McFadden, Misra, Qian, Blauwiekel, Kerr and Zhao2013) found that the combination of insulin with hydrocortisone and prolactin stimulates the mRNA expression of CSN2 gene in bovine mammary gland. Indeed, the overfed sheep of the present study had significantly higher blood plasma insulin concentration (1·33 ± 0·261 ng/ml) compared with the underfed (0·62 ± 0·261 ng/ml) as already has been found by Tsiplakou et al. (Reference Tsiplakou, Chadio and Zervas2012), results which confirm the positive role of insulin in milk casein genes expression.
Along with the availability of energy, the availability of amino acids is critical for mammary protein synthesis. The amount of these amino acids depends on the amounts of microbial cells and by-pass protein deriving from the rumen. Indeed even when the diet contains little non protein nitrogen, 50–80% of the N reaching the small intestine is likely to be of microbial origin (Hogan, Reference Hogan1975). Rumen microflora needs a source of dietary nitrogen and carbohydrates to build up amino acids. The proportion in which these nutrients are given to the animal and their characteristics greatly affect the rate of microbial protein biosynthesis. If the energy is limited, microorganisms degrade feed protein to ammonia to produce energy, but they cannot uptake the ammonia to build new amino acid and protein (Nocek & Russell, Reference Nocek and Russell1988). However, it should pointed out here that in our study, we had under or over supply of energy and crude protein at the same time, so it is difficult to differentiate where the differences occur. Perhaps both of them affect the milk proteins’ genes expression in the MT simultaneously. Notwithstanding, that the positive effect of the essential amino acids availability on casein genes expression has been proven in vitro in bovine MEC (Yang et al. Reference Yang, Wu and Liu2007; Chen et al. Reference Chen, Li, Wang and Wang2013) and that the addition of 1·2 mmol/l lysine and 0·5 mmol/l methionine at the medium of bovine MEC increased the expression not only of caseins but also the LALBA gene (Li, Reference Li2011), no information exists so far regarding the effect of crude protein level (under isoenergetic conditions) on the transcripts accumulation of these genes in ruminants MT. However, Geursen & Grigor (Reference Geursen and Grigor1987) observed a 50% reduction on the concentrations of each mRNA of the milk proteins in lactating rats fed with a low-protein diet.
Contrary to our results and to the above mentioned studies, Boutinaud et al. (Reference Boutinaud, Ben Chedly, Delamaire and Guinard-Flament2008) found that a 7 d feed restriction (70 % of their requirements) in cows which were at 162 ± 20 d in milk, had no effect on the mRNA level of CSN3 and LALBA gene in MEC purified from milk. No changes in the mRNA abundance of the LALBA gene were observed by Nørgaard et al. (Reference Nørgaard, Sørensen, Theil, Sehested and Sejrsen2008) in the MT of cows fed either with a normal or with a low feeding level. The same has been observed by Sigl et al. (Reference Sigl, Meyer and Wiedemann2014) in the mRNA transcripts accumulation of all the caseins and LALBA gene in cows MEC purified from milk when the animals were subjected to a short-term (3 d) feed restriction in mid lactation. However, the same researchers (Sigl et al. Reference Sigl, Meyer and Wiedemann2014) indicated that a short term feed restriction (3 d) in early lactation cows raised markedly the mRNA levels CSN3 and LALBA gene and tended to increase the other caseins genes in the MEC purified from milk. The first stage of lactation has become the centre of focus regarding how fragile the balance is between biological processes, especially in cows which are in negative energy balance. During this period, there is a need to coordinate the nutrient trafficking in priorities. So, the increase in casein genes expression in the MT of cows at the first stage of lactation, despite the negative energy balance, can be explained by the fact that at this period the maintenance of milk production by the animals was set in first priority in order to ensure the newborn survival, especially when the energy was limited. Thus, taking all of the above into consideration we can conclude that the duration of underfeeding (negative energy balance) in combination with the lactation stage have different impact on the expression of caseins genes in the MT of ruminants, while the impact of negative energy balance on caseins genes expression at early lactation in small ruminants needs further investigation.
In this study we found that the lower feeding level led to a 60% reduction of the transcripts accumulation of CSN1S1 in comparison with the higher feeding level, whereas this reduction was 67·9% for CSN1S2, 65·2% for CSN2, 66·6% for CSN3, 75·5% for LALBA and only 32·8% for BLG (Table 4 and Fig. 1). These different relative variations may depend on the polymorphism in the milk proteins’ genes and can be associated with quantitative and qualitative parameters of sheep milk (Selvaggi et al. Reference Selvaggi, Ladadio, Dario and Tufarelli2014; Giambra et al. Reference Giambra, Brandt and Erhardt2014). Up to now, reports in the literature on the relationships between nutrition and milk protein genotype and their effects on milk yield and chemical composition are limited, with controversial results mostly concerning cows and goats. Indeed, Mackle et al. (Reference Mackle, Bryant, Petch, Hill and Auldist1999) investigated the effects of under-nutrition on milk composition in cows characterised by different BLG genotypes and suggested that the advantage of using animals with strong protein genotype could be counterbalanced by a low nutrient supply. In contrast, Auldist et al. (Reference Auldist, Thomson, Mackle, Hill and Prosser2000) focusing on the effects of different pasture allowance on milk composition from cows of different BLG genotypes, found no interactions between nutrition and protein polymorphisms. More recently, Valenti et al. (Reference Valenti, Pagano and Avondo2012) used goats homozygous for strong and weak alleles at CSN1S1 loci to evaluate the effect of genotype and dietary energy intake on the composition of milk caseins. They found that the high energy diet resulted in significantly higher milk yields of αs1-, β- and κ- caseins. Additionally, the αs1-casein milk yield was higher in goats carrying strong alleles while the opposite was observed for the αs2-casein. No genotype effect was reported for β- and κ- caseins yield. Further to that, Pagano et al. (Reference Pagano, Pennisi, Valenti, Lanza, Di Trana, Di Gregorio, De Angelis and Avondo2010) observed differences in milk protein and caseins levels between three genotypes of CSN1S1 (homozygous for strong or weak alleles as well as heterozygous) in line with results expected from the different allele contribution. This conclusion was possible because the goats used in their study were genetically for the CSN1S2 and CSN2 (Pagano et al. Reference Pagano, Pennisi, Valenti, Lanza, Di Trana, Di Gregorio, De Angelis and Avondo2010). However, in the present study the ewes were not genotyped or the milk caseins yields were not determined, so it is not possible to associate possible genetic variations with different rates of the corresponding proteins synthesis.
A reduction on the mRNA levels of milk proteins’ genes in the MT of sheep (Table 4) was observed in this study between the two sampling times (124 vs. 154 DIM) with the results being significant for the CSN1S2, CSN2, CSN3 and BLG gene. In agreement with our results, a significant decline in all the casein genes expression, after reached their maximum mRNA levels at the first 2 weeks of lactation, in the MT of cows was found by Sigl et al. (Reference Sigl, Meyer and Wiedemann2014). Additionally, Bionaz & Loor (Reference Bionaz and Loor2007) observed that the expression pattern of the CSN3 gene was more or less similar to the lactation curve in the MT of cows. The above results might be indicative of an important role of milk protein genes in maintenance of milk protein synthesis. However, on the other hand, Colitti & Pulina (Reference Colitti and Pulina2010) observed no differences on the expression of casein genes in the MT of dairy ewes between 30, 60 and 150 DIM, but these researches took MT samples from different animals throughout the lactation period. As far as the expression of LALBA gene is concerned in the MT of dairy ewes, Colitti & Farinacci (Reference Colitti and Farinacci2009) found, by collecting MT from different animals also, that this reached the highest value at the end of lactation (150 DIM). On the other hand, Sigl et al. (Reference Sigl, Meyer and Wiedemann2014) found that the LALBA transcripts accumulation in the MT of cows decreased significantly throughout the lactation cycle. A significant decrease in the expression of the two whey protein genes (LALBA and LBG) during the course of lactation was found also in cows milk somatic cells by Wickramasinghe et al. (Reference Wickramasinghe, Rincon, Islas-Trejo and Medrano2012).
In this study, the mRNA levels were different among genes with CSN2 showing the highest and LALBA the lowest abundance in sheep MT (Fig. 1). However, Sigl et al. (Reference Sigl, Meyer and Wiedemann2012) found that CSN3 abundance was the highest and the LALBA the lowest expressed gene among the milk protein genes respectively in cows MEC isolated from milk. Additionally, Wickramasinghe et al. (Reference Wickramasinghe, Rincon, Islas-Trejo and Medrano2012) observed that the CSN2 gene had the highest expression among the caseins gene family throughout the lactation in bovine milk cells. Finally, as expected, significantly positive correlations were observed between the mRNA levels of milk protein genes with the milk protein yield and milk yield respectively (Table 5) which prove the significant relationship between the milk protein genes with both milk protein yield and milk volume. In accordance with our findings, Ben Chedly et al. (Reference Ben Chedly, Lacasse, Marnet, Komara, Marion and Boutinaud2011) observed that once-daily milking, which causes a reduction in milk yield, reduced the milk and protein yield as well as the CSN3 gene expression in goats. Additionally, Boutinaud et al. (Reference Boutinaud, Ben Chedly, Delamaire and Guinard-Flament2008) found also high correlation between the LALBA (r = 0·52) and CSN3 (r = 0·45) mRNA levels, of MEC purified from milk, with the milk yield respectively in cows subjected in once- daily milking.
Conclusions
Underfeeding in comparison with overfeeding caused a significant reduction in the mRNA levels of CSN1S1, CSN1S2, CSN2, CSN3, LALBA and BLG gene in sheep MT, which indicates that the decrease in nutrient availability affected this metabolic pathway leading to a lower rate of protein and milk yield synthesis. CSN2 was the most abundant transcript in sheep MT relative to the other milk proteins which indicates its pivotal role in protein and milk yield production.