INTRODUCTION
Icelandic explosive eruptions distribute tephras over large regions. As illustrated by the Eyjafjallajökull 2010 eruption, volcanic deposits from medium-sized eruptions are not always well preserved in proximal sites on land. Ice cover and strongly erosive conditions have also limited their preservation in the late Pleistocene and early Holocene (Geirsdóttir et al., 2007; Björnsson and Pálsson, Reference Björnsson and Pálsson2008). Eight of 20 Holocene tephra layers, which were identified at distal sites in northern Europe, were not identified on Iceland (Dugmore, Reference Dugmore1996 and references therein). Several historical eruptions have only been documented by direct observations or glacial records, but no deposits related to these eruptions have been found at proximal sites to the eruption (Thordarson and Self, Reference Thordarson and Self1993; Larsen et al., Reference Larsen, Gudmundsson and Björnsson1998). Distal ash deposits of explosive Icelandic eruptions have also been recognized in Greenland, the North Atlantic, the Faroe Islands, the British Isles, northern continental Europe, Svalbard, and the Mediterranean region (Grönvold et al., Reference Grönvold, Johnsen, Clausen, Hammer, Bond and Bard1995; Dugmore, Reference Dugmore1996; Lacasse et al., Reference Lacasse, Werner, Paterne, Sigurdsson, Carey and Pinte1998; Jennings et al., Reference Jennings, Syvitski, Gerson, Grönvold, Geirsdóttir, Hardardóttir, Andrews and Hagen2000; Larsen et al., Reference Larsen, Eiríksson, Knudsen and Heinemeier2000; Wastegård et al., Reference Wastegård, Björck, Grauert and Hannon2001; van den Bogaard and Schmincke, Reference van den Bogaard and Schmincke2002; Pilcher et al., Reference Pilcher, Bradley, Francus and Anderson2005; Davies et al., Reference Davies, Abbott, Meara, Pearce, Austin, Chapman and Svensson2014), some of which could be assigned to specific events. Therefore, consideration of only the on-land deposits in Iceland will result in the imprecise determination of volumes, distributions, and eruption frequencies, particularly for volcanoes located near the coast.
During large historical fissure eruptions, such as the Eldgjá 930s or Laki 1780s events, sulfur haze posed a major health threat to the North Atlantic region (e.g., Thordarson and Self, Reference Thordarson and Self1993; Thordarson et al., Reference Thordarson, Miller, Larsen, Self and Sigurdsson2001). The most recent eruptions of Eyjafjallajökull 2010 and Grímsvötn 2011 demonstrated the hazard that tephra causes to air traffic over the North Atlantic and large parts of Europe. Thus, to assess the record of Icelandic eruptions, not only large eruptions, which are recorded in visible ash layers, but also intermediate magnitude eruptions need to be considered, which may not form distinct ash layers. The seafloor offshore southern Iceland, located at medial distance from the volcanic source, could potentially preserve information about occurrence, distribution, and thicknesses of these eruptions and thus provide a complement to the proximal on-land and distal archives, especially considering eruptions that reached northern Europe. The processes involved in the deposition and preservation of tephra in this strongly variable depositional environment need to be understood in order to use this sedimentary archive for tephrostratigraphy. Primary deposits need to be distinguished from the large amount of reworked tephra typical in the background sediment around Iceland, especially at the southern margin.
From direct documentation, such as light detection and ranging (LIDAR), satellite imagery, and in situ tephra sampling, we know that tephra of considerable grain size (>10 µm) and amount was deposited on the ocean surface at the southern Icelandic margin during the Eyjafjallajökull 2010 eruption (Dellino et al., Reference Dellino, Gudmundsson, Larsen, Mele, Stevenson, Thordarson and Zimanowski2012; Gudmundsson et al., Reference Gudmundsson, Thordarson, Höskuldsson, Larsen, Björnsson, Prata and Oddsson2012). Because this tephra is not preserved well on Iceland and is compositionally distinct (Gudmundsson et al., Reference Gudmundsson, Thordarson, Höskuldsson, Larsen, Björnsson, Prata and Oddsson2012) and thus unequivocally identifiable, our aim was to determine its preservation potential offshore Iceland. We examine to what extent the ash cloud observed by remote-sensing techniques (Schumann et al., Reference Schumann, Weinzierl, Reitebuch, Schlager, Minikin, Forster and Baumann2011; Langmann et al., Reference Langmann, Folch, Hensch and Matthias2012) left traces on the seafloor. Our study of tephra in surface sediment from the seafloor around southern Iceland serves as a case study for the preservation potential of medium-size eruptions in the marine record at medial distances from the eruption center. Even in areas with very high sedimentation rates, these deposits should not be covered by sediment within 3 years after the eruption.
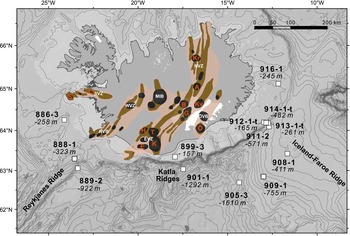
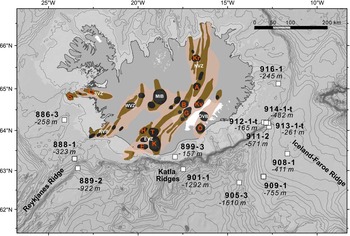
In 2013, we sampled the marine surface sediments at 13 sites along the southern and eastern Icelandic margin during R/V Poseidon cruise 457 (Fig. 1), because remote-sensing techniques identified this to be the major region over which the Eyjafjallajökull 2010 ash clouds passed. Major element analyses were used to assign volcanic particles from the samples to their potential eruptive source. The result was that very few Eyjafjallajökull 2010 ash particles (<0.5%) were identified in the 13 cores. We evaluate the different processes involved that prevented better preservation of the Eyjafjallajökull 2010 ash shards, such as background sedimentation, reworking, and ocean currents. The analyzed shard assemblages at the different sites, however, did provide a wealth of information on the distribution of material from other volcanic systems on Iceland, which we also summarize in this article. Finally, traces of historical eruptions were also found beyond their previously interpreted dispersal extent. Our study suggests that medium-sized eruptions are far more abundant than previously believed based on the various land, ice, and marine archives.
Iceland and the bathymetry of the surrounding ocean floor with sampling locations (white boxes) and depths below sea level. The volcanic systems each include a central volcano (black) and/or fissure or dyke swarms (brown) (Jakobsson, Reference Jakobsson1979; Saemundsson, 1979; Thordarson and Larsen, Reference Thordarson and Larsen2007). Situated on the rift in the Northern Volcanic Zone (NVZ) (beige), are the Krafla (Kr), Askja (A), and Kverkfjöll (Kv) volcanic systems. Located beneath northwest Vatnajökull at the northern part of the Eastern Volcanic Zone (EVZ) are the Grímsvötn (G) and Bárðarbunga (B) volcanic systems with their associated fissure swarms Lakagígar and Veiðivötn, respectively. At the EVZ’s southern end, Öræfajökull (Ö) is situated in an intraplate setting in the Öræfajökull Volcanic Belt (ÖVB). The southern part of the EVZ is defined as off-rift or flank zone and comprises the Hekla (H), Eyjafjallajökull (E), Torfajökull (T), and Katla (K) volcanic systems. Also shown are the Western Volcanic Zone (WVZ), Reykjanes Volcanic Belt (RVB), and Mid-Icelandic Belt (MIB). The Snaefellsnes Volcanic Zone (SVZ) contains Sneafelsjökull (S) and Ljósufjöll (Lj) volcanic systems. (For interpretation of the references to color in this figure legend, the reader is referred to the web version of this article.)
GEOLOGIC SETTING
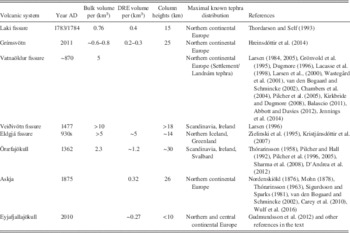
Overview of the major Icelandic volcanic systems and most relevant historical eruptions
Iceland was formed by the interaction of the Iceland hot spot with the Mid-Atlantic Ridge and is the only place on Earth where active midocean-ridge spreading centers are exposed on land (Jakobsson, Reference Jakobsson1979; Bjarnason et al., Reference Bjarnason, Wolfe and Solomon1996) (Fig. 1). Most active central volcanoes and proximal parts of their fissure swarms are covered by ice, which, together with lakes and high groundwater levels, results in water-magma interaction causing highly explosive eruptions (Larsen, Reference Larsen2005). Most of the volcanic activity on Iceland is associated with the neovolcanic rift zones. The most active are the Northern Volcanic Zone (NVZ), which propagates into the Eastern Volcanic Zone (EVZ), and the Reykjanes Volcanic Zone.
The following section and Table 1 review the seven major historically active volcanic systems on Iceland that contributed volcanic material to surface sediment at the sampled sites. The seven centers are primarily located in southeastern Iceland along the EVZ, except for Askja located in the southern part of the NVZ and the off-rift Hekla and Öræfajökull Volcanoes.
Major historical eruptions that contributed volcanic material to surface sediment at the sampled locations. DRE, dense rock equivalent.

The Grímsvötn and Bárðarbunga central volcanoes, two of the most productive volcanic systems on Iceland, are situated beneath the Vatnajökull ice sheet. The Grímsvötn-Lakagígar volcanic system produced more than 60 eruptions in the last 800 years (Sigmarsson et al., Reference Sigmarsson, Óladóttir and Larsen2010). Numerous small, historical eruptions at the Grímsvötn summit volcano were subglacial, or the tephra distribution to the area offshore southern Iceland was only minor (Thórarinsson, Reference Thórarinsson1974; Jóhannesson, Reference Jóhannesson1983; Larsen et al., 2014 and references therein). On the ice-covered part of the Bárðarbunga-Veiðivötn volcanic system, 22 basaltic phreatomagmatic eruptions took place over the last 1000 yr, only a quarter of which were deposited beyond Vatnajökull. Katla, located at the propagating tip of the EVZ, is the most productive volcanic system in Iceland in terms of erupted magma volume (Jakobsson, Reference Jakobsson1979; Eiríksson et al., Reference Eiríksson, Larsen, Knudsen, Heinemeier and Símonarson2004; Thordarson and Larsen, Reference Thordarson and Larsen2007). The ice-filled summit caldera and fissures account for 20 historical subglacial phreatomagmatic eruptions with basaltic tephra volumes of 0.01 to >1 km³ (Larsen, Reference Larsen2000). Eruptions of dacitic tephra, which occurred at vents below the ice sheet, are termed SILK (silicic Katla) (e.g., Larsen et al., Reference Larsen, Newton, Dugmore and Vilmundardóttir2001). The Hekla Volcano, located close to Katla at the western edge of the EVZ, produced several historical eruptions with <2 km³ of widespread basaltic-andesitic to dacitic tephra, whereas earlier Hekla eruptions also produced large volumes of rhyolites. Many of the Hekla eruptions have been established as chronostratigraphic marker horizons extending to northern continental Europe (Salmi, Reference Salmi1948; Thórarinsson, 1954; Dugmore, Reference Dugmore1996; Larsen et al., Reference Larsen, Dugmore and Newton1999; Thordarson and Larsen, Reference Thordarson and Larsen2007; Coulter et al., Reference Coulter, Pilcher, Plunkett, Baillie, Hall, Steffensen, Vinther, Clausen and Johnsen2012). Although Öræfajökull and Askja Volcanoes have not been as historically active as the aforementioned systems, both produced single large historical eruptions with compositionally distinct rhyolitic tephras. The Öræfajökull AD 1362 eruption was the most voluminous historical explosive Icelandic eruption. The Askja eruption in AD 1875 was considerably smaller, still reaching northern Europe.
The Eyjafjallajökull Volcano is located at the end of the EVZ just southwest of Katla and directly on the southern coast of Iceland. The eruption plume of the 2010 Eyjafjallajökull summit eruption (April 14 to May 22, 2010) stayed below 10 km, and the mass discharge rate below 106 kg/s, an order of magnitude smaller than the lower limit of Plinian events (Dellino et al., Reference Dellino, Gudmundsson, Larsen, Mele, Stevenson, Thordarson and Zimanowski2012). More than 90% of the irregular tephra particles produced were smaller than 1 mm (Gudmundsson et al., Reference Gudmundsson, Thordarson, Höskuldsson, Larsen, Björnsson, Prata and Oddsson2012). The ash plume drifted over the North Atlantic to central Europe (Ansmann et al., Reference Ansmann, Groß, Freudenthaler, Seifert, Hiebsch, Schmidt, Wandinger, Mattis, Müller and Wiegner2010; Flentje et al., Reference Flentje, Claude, Elste, Gilge, Köhler, Plass-Dülmer, Steinbrecht, Thomas, Werner and Fricke2010) and was recorded in detail by remote sensing, in situ measurements, and isopach mapping, providing information on the sequence of eruptive events, plume dispersal, tephra mass, grain-size, and particle concentrations (Supplementary Text 1) (Ansmann et al., Reference Ansmann, Groß, Freudenthaler, Seifert, Hiebsch, Schmidt, Wandinger, Mattis, Müller and Wiegner2010; Petersen, Reference Petersen2010; Pietruczuk et al., Reference Pietruczuk, Krzyścin, Jarosławskia, Podgórskia, Sobolewskia and Winka2010; Schumann et al., Reference Schumann, Weinzierl, Reitebuch, Schlager, Minikin, Forster and Baumann2011; Stohl et al., Reference Stohl, Prata, Eckhardt, Clarisse, Durant, Henne and Kristiansen2011; Taddeucci et al., Reference Taddeucci, Scarlato, Montanaro, Cimarelli, Del Bello, Freda, Andronico, Gudmundsson and Dingwell2011; Dellino et al., Reference Dellino, Gudmundsson, Larsen, Mele, Stevenson, Thordarson and Zimanowski2012; Petersen et al., Reference Petersen, Björnsson, Arason and von Löwis2012b).
Meteorologic, sedimentologic, and oceanographic setting of the study area
Tephra deposited in the ocean offshore southern Iceland is derived not only from primary tephra fall, but also rivers, jökulhlaups, (glacial outburst floods) and dust plumes that transport large volumes of volcanoclastic sediment from onshore Iceland into the study area. The distribution of volcanic particles is affected by meteorologic, sedimentologic, and oceanographic parameters, which are introduced in the following section.
Wind patterns in Iceland vary with elevation and season. Westerly winds will carry tephra over the southern Icelandic margin, potentially toward northern Europe, as was the case during the Eyjafjallajökull 2010 eruption. Icelandic eruption columns below 15 km are predominantly dispersed by westerly to southerly winds (Lacasse, Reference Lacasse2001; Petersen et al., Reference Petersen, Björnsson and Arason2012a). The dispersal of tephra from eruption columns exceeding heights of 20 km is controlled by strong westerlies during fall and winter or weak easterlies during spring and summer (Lacasse, Reference Lacasse2001).
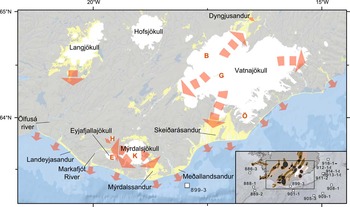
Approximately 11% of Iceland is covered by glaciers (Björnsson, Reference Björnsson1978) (Fig. 2). Tephra that is deposited on the glaciers’ accumulation areas is subsequently buried by snow and carried downward by ice flow (Björnsson and Pálsson, Reference Björnsson and Pálsson2008). Erosion of bedrock and sediment facilitates incorporation of volcanic material in the ice. In the ablation areas (Larsen et al., Reference Larsen, Gudmundsson and Björnsson1998; Larsen and Eiríksson, Reference Larsen and Eiríksson2008), the material is released into meltwater up to 1000 yr later and deposited on or transported over the sandurs (glacial outwash plains) at Iceland’s southern coast by glacial rivers or jökulhlaups (Fig. 2).
(color online) Iceland’s largest glaciers and sandurs. Arrows denote fluvial and eolian transport directions. Major dust plume source areas contributing eolian dust to the study area are as follows: (1) south of Langjökull, northerly winds cause dust plumes in periodically dry glacier lakes; and (2) along the southern coastline, a continuous area of unstable sand (Arnalds, Reference Arnalds2010) is frequently subjected to storms blowing to the south (Arnalds and Metúsalemsson, 2004). The largest sandur is Skeiðarársandur (1000 km²). Also shown is the sandur build up by Ölfusá river sediment, drained from Langjökull; the Landeyjasandur (Markarfljót River), fed by meltwater and jökulhlaups from Mýrdalsjökull and Eyjafjallajökull (Arnalds, Reference Arnalds2010; Thorsteinsson et al., Reference Thorsteinsson, Gísladóttir, Bullard and McTainsh2011; Prospero et al., Reference Prospero, Bullard and Hodgkins2012); and Mýrdalssandur and Meðallandssandur, drained by meltwater from Mýrdalsjökull and Vatnajökull. Abbreviations as in Figure 1.

Eolian redistribution of loose volcanic sediments from the sandurs, which are effectively arctic deserts (Ovadnevaite et al., Reference Ovadnevaite, Ceburnis, Plauskaite-Sukiene, Modini, Dupuy, Rimselyte and Ramonet2009), is stronger in Iceland than elsewhere on Earth (Arnalds, Reference Arnalds2010) (Fig. 2). At the glacier flanks, strong katabatic winds can, under dry conditions, deflate fine material. Wind erosion of sediment, freshly deposited by jökulhlaups (Prospero et al., Reference Prospero, Bullard and Hodgkins2012), can cause large, multiday dust events upon drying.
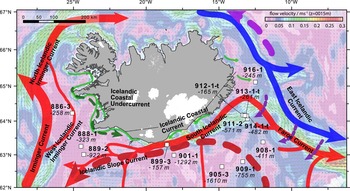
A considerable amount of sediment out of the glaciers and from the sandurs reaches the ocean especially southeast and south of Iceland (Fig. 2). Coastal currents distribute it over the shallow shelf areas, and turbidity plumes can carry it even beyond the shelf edge up to 35 km from the shore (Boulton et al., Reference Boulton, Thors and Jarvis1988). The depositional regime of the particles in the study area is influenced by ocean currents, which are governed by the large-scale ocean dynamics and regional seafloor morphology (Fig. 3, Supplementary Text 1).
(color online) Simulated mean flow field around Iceland at 15 m depth and circulation scheme of Icelandic waters (Beaird et al., Reference Beaird, Rhines and Eriksen2013; Logemann et al., Reference Logemann, Ólafsson, Snorrason, Valdimarsson and Marteinsdóttir2013). Dashed arrows denote deep currents. Sampling sites with depths below sea level (white boxes). A detailed description of the ocean current system around southern Iceland is given in Supplementary Text 1.

SAMPLE SITES AND SAMPLING PROCEDURE
Samples were taken during R/V Poseidon cruise 457 in August 2013. Thirteen box corers (60×60×60 cm) recovered sediment from water depths of 100–1600 m offshore southwestern, southern, and eastern Iceland, 18–180 km from the coast (Fig. 1). We sampled the uppermost surface (1 mm to 1 cm) of the box cores that recovered an undisturbed sediment body including an intact mud line (seawater-sediment interface). Three box cores were not completely filled and contained only disturbed sediment; thus, we studied the entire sediment (denoted with “t” in the sample names, indicating that the “total” recovered sediment was studied). All samples were wet sieved to separate the fractions <32 µm, >32 µm, and, if necessary, >1 mm. For the specimen preparation, random portions of the homogeneously mixed samples were mounted, embedded in epoxy, and polished.
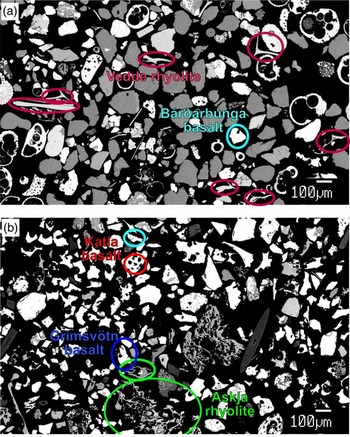
The sediment is heterogeneous silty clay to silty sand, containing volcanic glass shards (usually <0.2 mm), minerals, and lava fragments, as well as variable amounts of marine microorganisms (Fig. 4). Detailed descriptions of the box corer surfaces are given in Supplementary Table 1. Supplementary Figure 1a–k shows the echo-sounding profiles of the sampling sites, which were used to evaluate the relevant general depositional settings in each area.
Backscatter electron image of surface sediment samples >32 µm. (a) Location 905-3: rhyolitic shards with composition similar to Vedde tephra (Katla) (ruby colored) and basaltic Bárðarbunga shard (turquois). (b) Location 888-1: rhyolitic shards of Askja 1875 composition (green) and basaltic shards compositionally corresponding to Katla (red), Grímsvötn (blue), and Bárðarbunga (turquois). Marine microorganisms of variable amount, minerals, and lava fragments surround the volcanic glass shards. Comparatively large minerals (dark), foraminifera, diatoms, and sponge spicules in sample 905-3 (a) contrast with the high amount of relatively small glass shards and minerals and few organic particles, such as diatoms, in sample 888-1 (b). (For interpretation of the references to color in this figure legend, the reader is referred to the web version of this article.)

ANALYTICAL METHODS
All grain-size fractions were analyzed. Chemical analyses were performed on volcanic shards along transects of the specimens to get a nonbiased representation of the shard populations. Major element compositions of volcanic glass (Fig. 4) were analyzed with a JEOL JXA 8200 electron microprobe at GEOMAR Helmholtz Centre for Ocean Research Kiel (15 kV, 6 nA; other parameters and reference material are given in Supplementary Text 2 and Supplementary Table 2). Tephra grains were assigned to their volcanic source based on comparison of their major element compositions with those of known eruptions from literature and new data (references are given in Supplementary Table 3).
RESULTS
Tephra particle composition
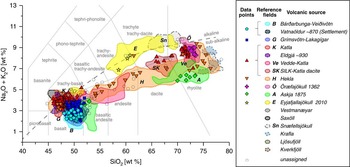
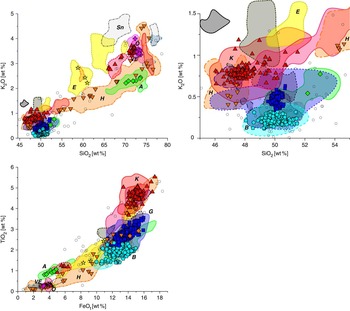
The major element compositions of the 882 analyzed volcanic glass shards were normalized to 100% on a volatile-free basis and ranged from basalt to rhyolite (Fig. 5, Supplementary Table 2). The basalts form two clusters at SiO2=47.0–48.5 wt% (alkali-basalts to transitional tholeiites) and SiO2=49.0–51.5 wt% (tholeiitic-basalts). The low- and high-silica basalts form positive trends on the FeOt versus TiO2 diagram (Fig. 6c).
(color online) TAS total alkali vs. silica diagram after Le Maitre et al. (1989) with major element compositions of glass shards from surface samples compared with fields for major Icelandic volcanic sources (for data sources, see Supplementary Table 3). The shards show a bimodal distribution. Of all measured data points, 86% have basic (<60 wt% SiO2) and 14% silicic (>60 wt% SiO2) compositions. The alkaline/subalkaline line from Irvine and Baragar (Reference Irvine and Baragar1971) separates transitional (Katla) from tholeiitic (Grímsvötn and Bárðarbunga) volcanic systems.

(color online) Major element variation diagrams displaying (a) SiO2 versus K2O; (b) the enlarged basic part of panel a; and (c) FeOt versus TiO2 with compositions of glass shards from surface samples compared with fields for major Icelandic volcanic sources (for data sources, see Supplementary Table 3). Unassigned data points are marked with circles; data points assigned to specific volcanic systems are marked with respective symbols denoted in the key in Figure 5.
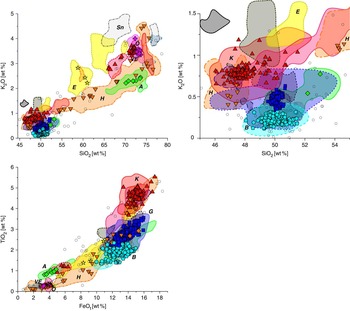
The eruption products of most volcanic systems can be distinguished by their unique geochemical fingerprint (Jakobsson, Reference Jakobsson1979; Larsen et al., Reference Larsen, Dugmore and Newton1999; Gudmundsdóttir et al., Reference Gudmundsdóttir, Eiríksson and Larsen2011). The data points were assigned to their source volcanic systems or individual eruption events based on compositional fields developed on the basis of reference data summed up in Supplementary Table 3. On diagrams of SiO2 plotted against K2O (Fig. 6b), FeOt, MgO, TiO2, and CaO, the high-silica basalts can be subdivided into low-K (K2O=0.1–0.3 wt%, overlapping with the reference fields of Bárðarbunga-Veiðivötn) and high-K (K2O=0.3–0.6 wt%, correlating with Grímsvötn-Lakagígar field) groups. Most data of the low-K, high-silica basalts plot in the Bárðarbunga-Veiðivötn reference field with FeOt=12–14 wt% and TiO2=1.5–1.9 wt%. The high-K, high-silica basalts overlap the Grímsvötn-Lakagígar reference field with FeOt=12–15.5 wt% and TiO2=2.3–3.5 wt%. The low-silica basalts have the highest K2O (0.7–0.9 wt%), overlapping the Eldgjá and Katla reference fields, also characterized by high FeOt (14.2–15.5 wt%) and TiO2 (4.5–5 wt%) (Fig. 6c).
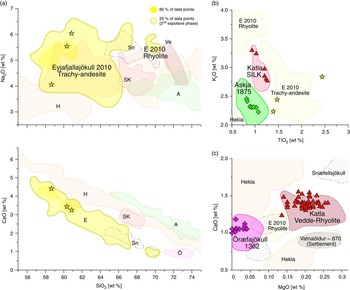
Most of the more felsic tephra particles are of rhyolitic composition (Fig. 5) with SiO2=70.8–73.5 wt% and total alkalis (Na2O + K2O)=8.1–9.0 wt%. Shards with high SiO2 (70–79 wt%) and low Na2O + K2O (5.8–8.1 wt%) also have high TiO2 at a given FeOt (Fig. 6b) and plot within the field for the Askja 1875 eruption, which can clearly be distinguished in the TiO2 versus K2O diagram (Fig. 7a). Three trachy-andesitic shards, overlapping with the reference data of tephra from the Eyjafjallajökull 2010 eruption, have high K2O at a given SiO2 (Fig. 6a). The Öræfajökull 1362 composition can clearly be distinguished on the MgO versus CaO diagram (Fig. 7b).
(color online) Major element variation diagrams displaying ratios of major element glass compositions, which best distinguish the following volcanic sources: (a) SiO2 versus CaO and Na2O shows the assignment of three shards to the trachy-andesitic phase of the Eyjafjallajökull 2010 eruption. (b) TiO2 versus K2O separates Askja 1875, silicic Katla (SILK), and Eyjafjallajökull 2010 trachy-andesite. (c) MgO versus CaO evolved extract distinguishes Öræfajökull 1362 and Katla Vedde-Rhyolite; andesites are not shown.

The number of analyzed particles varies at each site. In order to estimate the relative contribution of a volcanic system to the total tephra inventory of the study area (C), we therefore average the relative proportions of each individual site
 ${\rm C} ={1 \over n} \times\mathop{\sum}\nolimits_{i=1}^n C_i } $
with n being the number of sites. This results in a total contribution of 22% from Bárðarbunga-Veiðivötn, 33% from Grímsvötn-Lakagígar and 28 % from Katla volcanic systems (Fig. 8). Of the silicic glass shards with Katla composition, 87% are rhyolites identical to the 12 ka Vedde tephra but with slightly higher CaO contents (Fig. 7a). Minor amounts of particles were assigned to Hekla (3.1%), the Askja 1875 eruption (1.3%), and the Öræfajökull 1362 eruption (1.4%). Only three trachy-andesitic particles (0.5%) were identified from the Eyjafjallajökull 2010 eruption: two particles from site 911-2 and one particle with a less evolved composition from site 908-1. Eleven percent of the data points could not be clearly assigned to a specific volcanic system.
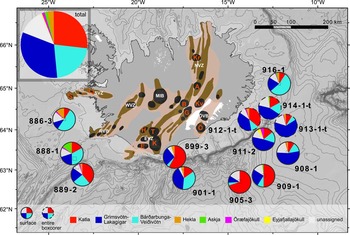
(color online) Iceland and the bathymetry of the surrounding ocean floor with sample locations and depths. Pie charts show the percentages of material from the different volcanic systems (sources) in the samples. Solid lines around the pie charts mark samples that were taken from the surface of the box corer, whereas dashed lines denote assemblages from the entire material of the box corer samples. For these, the sample names end with a “t” denoting that the “total” sediment in the box core was investigated. Abbreviations as in Figure 1.

DISCUSSION
Implications for the marine preservation of tephra from medium-sized eruptions using Eyjafjallajökull 2010 as a test case
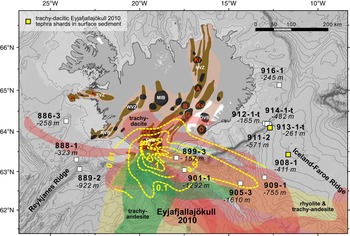
In all our samples, only three particles, corresponding to 0.5%, were derived from the Eyjafjallajökull 2010 eruption (Figs. 5, 7, 9, and 11). Results from remote sensing, in situ measurements, and isopach mapping (Ansmann et al., Reference Ansmann, Groß, Freudenthaler, Seifert, Hiebsch, Schmidt, Wandinger, Mattis, Müller and Wiegner2010; Petersen, Reference Petersen2010; Pietruczuk et al., Reference Pietruczuk, Krzyścin, Jarosławskia, Podgórskia, Sobolewskia and Winka2010; Schumann et al., Reference Schumann, Weinzierl, Reitebuch, Schlager, Minikin, Forster and Baumann2011; Stohl et al., Reference Stohl, Prata, Eckhardt, Clarisse, Durant, Henne and Kristiansen2011; Taddeucci et al., Reference Taddeucci, Scarlato, Montanaro, Cimarelli, Del Bello, Freda, Andronico, Gudmundsson and Dingwell2011; Dellino et al., Reference Dellino, Gudmundsson, Larsen, Mele, Stevenson, Thordarson and Zimanowski2012; Petersen et al., Reference Petersen, Björnsson, Arason and von Löwis2012b; Dürig et al., Reference Dürig, Gudmundsson, Karmann, Zimanowski, Dellino, Rietze and Büttner2015) show that our entire study area was affected by particle deposition. Figure 9 shows a summary of the major phases of the eruption from satellite images compiled by Gudmundsson et al. (Reference Gudmundsson, Thordarson, Höskuldsson, Larsen, Björnsson, Prata and Oddsson2012), but note that data for ash distribution for some days are missing from this compilation (see Supplementary Text 1 for details on the drift of the ash plume). Other satellite data showed that ash was observed along the entire southwest to southeast Icelandic coast (EUMETSAT, NASA, and, e.g., Schumann et al., Reference Schumann, Weinzierl, Reitebuch, Schlager, Minikin, Forster and Baumann2011; Stohl et al., Reference Stohl, Prata, Eckhardt, Clarisse, Durant, Henne and Kristiansen2011). The tephra formed a continuous 360° blanket around Eyjafjallajökull, extending 30–80 km from the vent. Low concentrations of the tephra cover an area of 7 million km² (Gudmundsson et al., Reference Gudmundsson, Thordarson, Höskuldsson, Larsen, Björnsson, Prata and Oddsson2012). To specify the compositions and sizes of particles that we expect at our sampling sites, we have compiled constraints on the amount of tephra and its grain-size distribution in the different parts of the depositional fan, which vary in accordance with the different observational methods. We evaluated these different approaches to make certain that the scarce occurrence of Eyjafjallajökull 2010 particles in our samples could not be an artifact of grain-size selection in our analysis.
Using isopach mapping and satellite data (Fig. 9), Gudmundsson et al. (Reference Gudmundsson, Thordarson, Höskuldsson, Larsen, Björnsson, Prata and Oddsson2012) estimated a total erupted mass of 4.8±1.2×10¹¹kg. Of the tephra volume, 2.7±0.7×10¹⁰ m³ was airborne, only half of which (1.4±0.2×10¹⁰ m³) was deposited on Iceland. Only ~107 m3 of tephra spread beyond 250–300 km and 30±10×106 m³ was transported out of the crater with meltwater (Gudmundsson et al., Reference Gudmundsson, Thordarson, Höskuldsson, Larsen, Björnsson, Prata and Oddsson2012). The material fragmented to particles <28 µm is estimated to have been 7×10¹⁰ kg (Gudmundsson et al., Reference Gudmundsson, Thordarson, Höskuldsson, Larsen, Björnsson, Prata and Oddsson2012) or 8.3±4.3×10⁹ kg (excluding <2.8 µm) (Schumann et al., Reference Schumann, Weinzierl, Reitebuch, Schlager, Minikin, Forster and Baumann2011; Stohl et al., Reference Stohl, Prata, Eckhardt, Clarisse, Durant, Henne and Kristiansen2011).
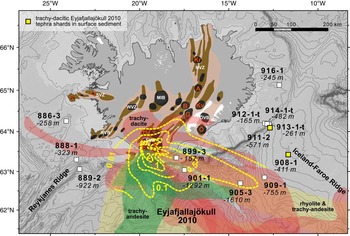
Tephra distribution of different phases during the Eyjafjallajökull 2010 eruption from MODIS, MERIS, and NOAAAVHRR satellite images from Gudmundsson et al. (Reference Gudmundsson, Thordarson, Höskuldsson, Larsen, Björnsson, Prata and Oddsson2012). Note: Data for some days are missing. Ash was observed all around Iceland. Dotted lines show isopach thickness in centimeters of tephra from total fallout on land from April 14 to May 22 and estimated fallout thickness to the south and southeast of Iceland after Gudmundsson et al. (Reference Gudmundsson, Thordarson, Höskuldsson, Larsen, Björnsson, Prata and Oddsson2012). During the different eruptive phases, tephra with compositions varying from trachy-andesite (green) to trachy-dacite (red) to rhyolite (yellow) was carried by winds from different directions at different altitudes. Meteosat satellite observations (EUMETSAT, NASA, and, e.g., Schumann et al., Reference Schumann, Weinzierl, Reitebuch, Schlager, Minikin, Forster and Baumann2011; Stohl et al., Reference Stohl, Prata, Eckhardt, Clarisse, Durant, Henne and Kristiansen2011) reveal ash distribution all around the southern Icelandic coast. Yellow squares denote locations where particles of trachy-dacitic composition have been identified in surface sediments. Abbreviations as in Figure 1. (For interpretation of the references to color in this figure legend, the reader is referred to the web version of this article.)
On board the RRS Discovery, at a distance of 75 km southeast of Eyjafjallajökull (63°6' 28.7994'', 18°36' 39.6''), which is close to sites 899-3 and 901-1 of this study, 34 g of tephra per m2 (±50%) (130 µm modal; 420 µm maximum) was deposited within 78 minutes (Stevenson et al., Reference Stevenson, Loughlin, Rae, Thordarson, Milodowski, Gilbert and Harangi2012; Cassidy, M., personal communication, 2015). On the Faroe Islands, 0.6 g/m2 was collected in rainwater gauges from April 14 to May 17 (40 µm modal; ~100 µm maximum) (Gudmundsson et al., Reference Gudmundsson, Thordarson, Höskuldsson, Larsen, Björnsson, Prata and Oddsson2012; Stevenson et al., Reference Stevenson, Loughlin, Rae, Thordarson, Milodowski, Gilbert and Harangi2012).
Additional in situ rain gauge measurements from the British Isles and continental Europe, as well as ash-mass concentration measurements taken by airplanes and mass fluxes estimated from LIDAR data, are summarized in Supplementary Text 1.
The Eyjafjallajökull 2010 eruption created a unique plume. It formed a thin, elongated ash plume in the vicinity of the volcano for most of the eruption and was only dispersed into a wider plume farther away from the volcano. Despite this fact and some uncertainties and the inconsistent information on tephra volumes and respective mass eruption rates (Schumann et al., Reference Schumann, Weinzierl, Reitebuch, Schlager, Minikin, Forster and Baumann2011; Stohl et al., Reference Stohl, Prata, Eckhardt, Clarisse, Durant, Henne and Kristiansen2011; Gudmundsson et al., Reference Gudmundsson, Thordarson, Höskuldsson, Larsen, Björnsson, Prata and Oddsson2012, Reference Gudmundsson, Dürig, Höskuldsson and Thordarson2015; Dürig et al., Reference Dürig, Gudmundsson, Karmann, Zimanowski, Dellino, Rietze and Büttner2015), we conclude that particles sufficiently large to be considered in our study were deposited in our sampling area at distances of 18–180 km from the source. Because this eruption took place only 3 yr before our sampling campaign, we expected that tephra from the Eyjafjallajökull 2010 eruption would be preserved on the surface of the seafloor. However, those study sites that lie within the 1-cm and 0.5-cm isopach lines (899 and 901, respectively) (Fig. 9; Gudmundsson et al. Reference Gudmundsson, Thordarson, Höskuldsson, Larsen, Björnsson, Prata and Oddsson2012) are located in a high-energy environment where high background sedimentation of other volcanic material is to be expected and could explain the obvious dilution of the Eyjafjallajökull particles. Core 905 is situated on the 0.1-cm isopach. Considering the Holocene sedimentation rates, we would expect ~0.01 cm sediment deposited in 3 yr after the eruption. In this case, we could statistically expect 5 shards out of the 49 measured shards to be from the eruption. Surprisingly, the only sites where shards from the Eyjafjallajökull 2010 eruptions were found are 908-1 and 911-2, farther to the east (Fig. 9). Overall, the 13 different sites cover a large area with a high diversity of depositional environments and a wide variety of ocean depths at different distances from Iceland. Therefore, this study is representative of the preservation potential of medium-size eruptions such as the Eyjafjallajökull 2010 eruption at medial distances from their source.
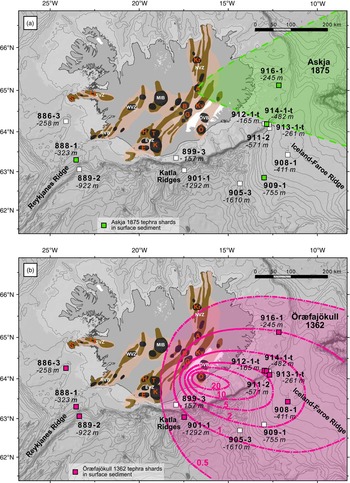
Previously constrained distribution fans of historical eruptions Askja 1875 (a) (Carey et al., Reference Carey, Houghton and Thordarson2010) and Öræfajökull 1362 (b) with estimated isopach depth in centimeters (Thórarinsson, Reference Thórarinsson1958) and sampling locations denoted with squares. Green (a) and pink (b) squares denote locations where particles from the eruptions have been discovered. Abbreviations as in Figure 1. (For interpretation of the references to color in this figure legend, the reader is referred to the web version of this article.)

In order to understand what the lack of deposits from the Eyjafjallajökull 2010 eruption at the medial sites at the south Icelandic margin means in a broader sense, we now compare this eruption with other historical eruptions and the traces they have left elsewhere. Tephra from explosive Icelandic, commonly Plinian, but also smaller eruptions has repeatedly been carried as far as continental Europe. Recurrence times of 10–20 yr are estimated for eruptions with a volcanic explosivity index (VEI) ≥3 (0.01–0.1 km³) (Gudmundsson et al., Reference Gudmundsson, Larsen, Höskuldsson and Gylfason2008), and eight have occurred since 1970 (Thordarson and Larsen, Reference Thordarson and Larsen2007; Jude-Eton et al., Reference Jude-Eton, Thordarson, Gudmundsson and Oddsson2012). Ash fall from the Laki 1780s eruption, which produced 0.8 km³ (0.4 km3 dense rock equivalent), was recorded at up to 2000 km distance from the vent (Kekonen et al., Reference Kekonen, Moore, Perämäki and Martma2005). Tephra from the Hekla 1510 eruption, which produced only 0.5 km³ of tephra (Thórarinsson, Reference Thórarinsson1967; Larsen et al., Reference Larsen, Eiríksson, Knudsen and Heinemeier2000), has been detected in the British Isles (Dugmore, Reference Dugmore1996). In Irish bogs, ~300 shards/cm3 were preserved from the Hekla 1104 and 1947 eruptions, which produced 2 km³ and 0.21 km³ of tephra, respectively (Larsen and Eiríksson, Reference Larsen and Eiríksson2008; Swindles et al., Reference Swindles, Lawson, Savov, Connor and Plunkett2011). Prior to the Eyjafjallajökull 2010 eruption, the farthest tephra distribution was reported for the 1947 eruption, during which tephra fell 2300 km away in Helsinki (Salmi, Reference Salmi1948; Thórarinsson, 1954). However, because of lack of proper instrumentation, some long-distance tephra transport from earlier eruptions no doubt has been overlooked. Techniques to better record tephra distribution are now available—for example, air quality monitoring at ground level. During the Eyjafjallajökull 2010 eruption, such techniques facilitated the collection of tephra grains from sites at more than 3000 km distance from the source, such as Hungary (Stevenson et al., Reference Stevenson, Loughlin, Rae, Thordarson, Milodowski, Gilbert and Harangi2012), southern Germany (Schleicher et al., Reference Schleicher, Kramar, Dietze, Kaminski and Norra2012), Switzerland (Bukowiecki et al., Reference Bukowiecki, Zieger, Weingartner, Jurányi, Gysel, Neininger and Schneider2011), Slovenia (Gao et al., Reference Gao, Stanič, Bergant, Bolte, Coren, He and Hrabar2011), and possibly Italy (Lettino et al., Reference Lettino, Caggiano, Fiore, Macchiato, Sabia and Trippetta2012; Rossini et al., Reference Rossini, Molinaroli, De Falco, Fiesoletti, Papa, Pari and Renzulli2012). Potentially overlooked older eruptions at these distal sites imply that the 16% probability of a cloud reaching northern Europe within one decade estimated by Swindles et al. (Reference Swindles, Lawson, Savov, Connor and Plunkett2011) should be considered as a minimum estimate, with a higher probability being very likely.
An important question is whether the Eyjafjallajökull 2010 particles would be preserved as cryptotephra at the aforementioned far-distal sites. The grain counts of rain gauge samples from continental Europe, the British Isles, and the Faroe Islands (8–218 grains/cm2) (Stevenson et al., Reference Stevenson, Loughlin, Rae, Thordarson, Milodowski, Gilbert and Harangi2012) show similar density per unit compared to measurements from cryptotephra horizons. Vice versa, some cryptotephra layers, for which the extent of the eruption is not clear, do not necessarily have to have been very large (Dugmore, Reference Dugmore1996). The grains from the Eyjafjallajökull eruption that were detected in Europe are very small (2–10 µm), but coarser material might have been missed by equipment designed for sampling <10 µm particles (Stevenson et al., Reference Stevenson, Loughlin, Rae, Thordarson, Milodowski, Gilbert and Harangi2012).
Concentration of tephra from the Eyjafjallajökull 2010 eruption in the surface sediment offshore southern Iceland is too small to constitute a detectable layer because of the high dilution by background sedimentation or redeposition by currents or bioturbation. However, the deposits from this eruption might be detectable in European bog or lake sediments as cryptotephras, as has been demonstrated with past eruptions (e.g., Dugmore, Reference Dugmore1996; van den Bogaard and Schmincke, Reference van den Bogaard and Schmincke2002; Larsen and Eiríksson, Reference Larsen and Eiríksson2008; Swindles et al., Reference Swindles, Lawson, Savov, Connor and Plunkett2011). Nevertheless, this would be difficult because of the small size of grains that reached Europe during the Eyjafjallajlökull 2010 eruption, making it difficult to detect them and analyze their geochemistry. Marine sites with a lower-energy environment would potentially preserve such medium-size eruptions better, especially at sites where the sedimentation rates are high and these eruptions can be separated such as in the North Icelandic shelf (Eiríksson et al., Reference Eiríksson, Knudsen, Haflidason and Henriksen2000; Guðmundsdóttir et al., Reference Guðmundsdóttir, Eiríksson and Larsen2012). The main dispersal direction especially of those eruptions threatening northern Europe, however, is to the south and southeast, and these eruptions are unlikely to have left traces at the North Icelandic shelf. At far-distal marine sites, it has been shown that ice-rafted tephra, turbidites, ocean bottom currents, and bioturbation can cause redistribution of sediment, so that primary tephra fall is not preserved as single well-defined tephra layers (Davies et al., Reference Davies, Abbott, Pearce, Wastegård and Blockley2012; Griggs et al., Reference Griggs, Davies, Abbott, Rasmussen and Palmer2014; Rasmussen and Wastegård, Reference Rasmussen and Wastegård2014). The deposition of tephra is instantaneous on a geologic time scale, and therefore, large eruptions can produce stratigraphic marker horizons independent of their depositional history. However, this does not include medium-size events such as the Eyjafjallajökull 2010 eruption.
In summary, the recent eruption of Eyjafjallajökull in 2010 was observed by a number of remote-sensing techniques, documenting tephra dispersal as far as Hungary. The lack of deposits in the marine sediment at sites within 180 km of the southern half of Iceland, over which the eruption plume traveled, provides a striking example that medium-sized eruptions (VEI 3–4) are not always traceable in the marine sedimentary archive at medial distance from the source, although they can reach continental Europe. This observation questions the representativeness of mapped tephra deposits on the seafloor for the actual tephra dispersal in the atmosphere. Although even small-volume eruptions may be manifested in tephra horizons at distal sites, this study shows that eruptions dispersed over large areas and distances do not necessarily produce detectable marine tephra deposits at medial distance to the source. Within the scope of assessing the probability that a future Icelandic eruption may affect Europe, medium-sized events also need to be considered. Because depositional evidence of these eruptions may be missing on Iceland and on the seafloor at medial distances from the Icelandic eruptive vents, medium-sized eruptions are likely to have been more frequent in the past than previously recognized. In order to correctly reconstruct eruption frequencies at Iceland and other coastal settings, our results emphasize the need for detailed investigation of all available archives and the significance of cryptotephras at different distances from the eruptive source.
Transport mechanisms of volcanic particles from the source volcanoes to the Atlantic Ocean
One reason for the scarcity of the Eyjafjallajökull 2010 particles in the surface sediments is that fluviatile and eolian erosion also deliver volcaniclastic sediment to these sites, diluting the potential deposits of the Eyjafjallajökull 2010 eruption with other volcanic material. Subsequently, we will quantify the contribution of these three transport mechanisms to evaluate their control on delivery of particles from the volcanic sources to the sampling sites.
Primary tephra fall
The majority of Icelandic eruptions are medium-sized, with uncompacted tephra volumes of 0.1–1 km³ (basaltic) and 0.1–0.5 km³ (silicic) (Larsen and Eiríksson, Reference Larsen and Eiríksson2008). To estimate the annual amount of material deposited by the flux of primary tephra, we use the average Holocene frequency of Icelandic eruptions of ~0.2 eruptions/yr (Larsen and Eiríksson, Reference Larsen and Eiríksson2008), even though this average includes eruptions with volumes below 0.1 km³, which will not always have produced deposits beyond Iceland, depending on their proximity to the coast. A representative example for medium-sized eruptions is the well-documented Eyjafjallajökull 2010 eruption, which produced 5×10¹¹ kg tephra (Gudmundsson et al., Reference Gudmundsson, Thordarson, Höskuldsson, Larsen, Björnsson, Prata and Oddsson2012). The annual primary tephra flux is thus approximated to ~1×10¹¹ kg, much of which reaches the North Atlantic around southern Iceland.
Fluviatile input
Meltwater sediment supply from Iceland is high, increasing substantially during glacial surges and in particular during jökulhlaups (Pálsson and Vigfússon, Reference Pálsson and Vigfússon1996; Sigurdsson, Reference Sigurdsson1998; Pálsson et al., Reference Pálsson, Harðardóttir, Vigfússon and Snorrason2000). Although it is not possible to estimate the total annual flux of material transported into the study area, we give several examples to indicate the dimension and importance of this mechanism for sediment supply. The glaciers cause high denudation rates, which at Vatnajökull are 320 cm/ka Björnsson, Reference Björnsson1979; locally, rates can temporarily rise as high as 70,000 cm/ka (Björnsson, Reference Björnsson1996). Total annual suspended sediment loads of Icelandic rivers are >4.5×10⁷ kg (Orwin et al., Reference Orwin, Lamoureux, Warburton and Beylich2010). During jökulhlaups, this baseline increases significantly, because jökulhlaups are highly erosive and can transport five times more sediment in a few weeks when caused by geothermal activity and an even greater amount in a few days during volcanic eruptions (Björnsson and Pálsson, Reference Björnsson and Pálsson2008). Many come from subglacial lakes beneath Vatnajökull. Over the last 200 yr, 15 catastrophic jökulhlaups drained the subglacial Grímsvötn Lake beneath Vatnajökull onto the Skeiðarársandur (Fig. 2) (Thórarinsson, Reference Thórarinsson1974; Larsen and Gudmundsson, Reference Larsen and Gudmundsson1997). Single jökulhlaups, especially on Mýrdalssandur, triggered by Katla eruptions (Fig. 2), can advance the coastlines several hundred meters seaward of river mouths (Björnsson and Pálsson, Reference Björnsson and Pálsson2008). They typically transport a suspended sediment load on the order of 1010 kg (Björnsson, Reference Björnsson2002 and references therein). The 1996 Gjálp jökulhlaup extended the coastline by 800 m, giving rise to approximately 7 km2 of new land (Snorrason et al., Reference Snorrason, Jónsson, Sigurdsson, Pálsson, Árnason, Víkingsson and Kaldal2002). During the 1918 Katla eruption, a jökulhlaup discharged ~2.5×10¹² kg volcanic material (Tómasson, Reference Tómasson1996), of which ~2.5×10¹¹ kg (40%) was delivered directly into the sea (Larsen and Ásbjörnsson, Reference Larsen and Ásbjörnsson1995). This is on the same order of magnitude as the annual input from primary tephra fall. We note, however, that between 2010 and 2013 no jökulhlaups were reported that could have locally removed or covered the deposits from the Eyjafjallajökull 2010 eruption. The material transported into the ocean by jökulhlaups and rivers can be transported even farther offshore by turbidity flows or ocean bottom currents.
Eolian sedimentation
Wind erosion on the vast sandurs (volcanic deserts) is another major mechanism for relocating volcaniclastic material. Of the material that is picked up during dust plume events, 500 g/m2/yr is deposited on Iceland (Arnalds, Reference Arnalds2010). A large amount, however, is transported from southern coastal regions (Fig. 2) to the south and southeast, in some cases >400 km across the ocean (Ovadnevaite et al., Reference Ovadnevaite, Ceburnis, Plauskaite-Sukiene, Modini, Dupuy, Rimselyte and Ramonet2009; Arnalds, Reference Arnalds2010; Prospero et al., Reference Prospero, Bullard and Hodgkins2012). On Dyngjusandur, 5–20 dust plume events occur per year (Arnalds, Reference Arnalds2010). They are capable of carrying at least 200 kg/s (PM10: particles ø 2.5–10 µm) equating to an emission rate of 35 g/m2/h (Thorsteinsson et al., Reference Thorsteinsson, Gísladóttir, Bullard and McTainsh2011). Combining these rates, ~0.8–3×10⁹ kg of eolian sediment of the PM10 fraction is produced per year. However, larger particles are not included, and this estimate refers only to the major dust plume area on Dyngjusandur. Iceland comprises more than 20,000 km² of sandy deserts with active eolian processes (Arnalds, Reference Arnalds2010). Kjaran and Sigurjónsson (Reference Kjaran and Sigurjónsson2004) estimated that major events may move up to 1–5 kg/m2 of sediment (bulk solid particles). A conservative estimate, assuming a plume frequency of 5 events per year and transport of 1 kg/m2 for the entire area, is that 1×10¹¹ kg is transported into the Atlantic Ocean per year, which is of the same order as the amount contributed to this area by annual primary tephra fall.
Relevant for the distribution of volcanic material over the study area is also the resuspension of tephra during or shortly after eruptions. When freshly fallen tephra is still dry and loose, winds can easily pick it up. Tephra can be transported offshore—for example, by katabatic winds with wind intensities or directions differing from those during the actual eruption. Thus, eolian processes can cause a broader distribution of volcanic material than the primary tephra plume. This was observed during the Eyjafjallajökull eruption on satellite images. Resuspension of previously deposited ash formed a wide plume beneath the actual eruption plume south of the volcano (Thorsteinsson et al., Reference Thorsteinsson, Jóhannsson, Stohl and Kristiansen2012).
Although tephra is blown higher into the atmosphere during eruptions and thus can be transported farther than during the dust storms, these estimates demonstrate that the offshore contribution of sediment from dust plumes can be considerable for spatial and quantitative extent of volcanic particle dispersal.
Conclusion
Averaged over time and space and despite the errors in estimation, the largest portion of volcanic material that is carried into the ocean per year is transported by rivers and jökulhlaups. The remainder is contributed by primary tephra fall and secondary eolian resite, both having similar dimensions. The sediment carried into the ocean by fluvial and eolian processes includes fresh material from volcanic eruptions; material that was former hard rock, such as lava, eroded and ground by glaciers; and material that was deposited on the glaciers in the past or tephra that has been deposited directly on sandurs. Volcanic sediment delivered by jökulhlaups, rivers, or dust storms will carry the geochemical signature of the volcanic provenance region. Material that is deflated or drained from sandurs around Vatnajökull has Grímsvötn and Bárðarbunga composition, and that from Mýrdalsjökull has a Katla geochemical signature (Figs. 2 and 8). In the particle assemblages at our different coring sites, we consider these provenance differences to get an idea of the dimension of the respective portion derived from the different volcanic systems.
Depositional environment: particle transport distance, ocean bottom currents, sedimentation rates, and bioturbation
We now look at the processes that affect the distribution of tephra particles between when they have been deposited on the sea surface to when they have been deposited on the seafloor. These include the distribution of the volcanic particles by ocean currents, which cause drift during sinking as well as erosion and resedimentation on the seafloor and bioturbation.
According to estimates based on particle residence times in the water column and current velocities in the study area (Supplementary Text 1), particles that have fallen onto the ocean surface can be transported horizontally no more than 80 km while sinking to the ocean floor. This distance will be decreased by tephra accumulation and vertical gravity currents (Carey, Reference Carey1997) and by deeper currents flowing in different directions than surface currents, or increased by turbulent water conditions and density boundaries (Wallrabe-Adams and Lackschewitz, Reference Wallrabe-Adams and Lackschewitz2003).
Sedimentation rates in the study area have varied widely from 1 cm/ka (Thornalley et al., Reference Thornalley, McCave and Elderfield2011) at deep sites in the late Pleistocene to more than 300 cm/ka as a result of jökulhlaups or debris flows at the onset of the Holocene (Jennings et al., Reference Jennings, Syvitski, Gerson, Grönvold, Geirsdóttir, Hardardóttir, Andrews and Hagen2000; Thornalley et al., Reference Thornalley, McCave and Elderfield2011). The depositional conditions at the study sites can be further constrained by considering sample descriptions (Supplementary Table 1) and echo-sounding profiles (Supplementary Figure 1a–k), reflecting the seafloor morphology near the sampling site. At site 886-3 on the shallow slope of the western shelf or site 905-3 southwest of the Iceland-Faroe Ridge, the sediment cover reaches 25 m thickness (Supplementary Figure 1g). At these sites, the sediment was usually finer grained (sandy silt), and sedimentation rates are thus expected to have been higher. In contrast, at sites 911 to 914 on the steep slope of the southeastern shelf, the sediment cover is very thin. This is evident from only minor box corer recovery as well as the reflecting layers in echo-sounding profiles (Supplementary Figure 1j), which reveal structures such as erosion gullies pointing to bypass sedimentation. Such sedimentation processes can deposit the coarser-grained material we found in the cores, which is composed of coarse sand, gravel, and cobbles up to 20 cm in diameter (Supplementary Table 1). In such areas, strong bottom currents may permanently or temporarily prevent sedimentation. Also under such erosive conditions, younger material is reworked and deposited elsewhere, and the material of older eruptions is exhumed.
Sediment on the surface of the seafloor may be locally mixed up by bioturbation (Teal et al., Reference Teal, Bulling, Parker and Solan2008; Thornalley et al., Reference Thornalley, McCave and Elderfield2010; Todd et al., Reference Todd, Austin and Abbott2014; Griggs et al., Reference Griggs, Davies, Abbott, Coleman and Adrian2015). This is substantial in regions of low sedimentation rates, where burrowing can cause intermixing of up to 10 cm/ka of the entire sediment body (Thornalley, D., personal communication, 2016) and thus can have a relevant influence on the mixing of the surface sediment with deeper sediment layers even within a short period of time. On the other hand, high sedimentation rates lead to limited bioturbation with effective depths of <2 cm, but also other factors such as nutrient supply influence the burying intensity of worms and other fauna (Thornalley et al., Reference Thornalley, McCave and Elderfield2010).
In summary, on the scale of the overall depositional fan of a tephra from a medium-sized Icelandic eruption, ocean currents are not a relevant parameter for tephra distribution. Bottom currents and, to a lesser degree, bioturbation can cause considerable redistribution of material after its deposition on the seafloor.
Sources of volcanic material in surface sediments at the different sampling sites
The percentages of material from the different volcanic sources in the samples from the 13 sites (Fig. 8) show significant variations. We now discuss the causes for the observed distribution of volcanic particles from the different sources.
Half of the volcanic material from the northernmost site on the eastern shelf (916-1; Fig. 8) is composed of particles with Bárðarbunga-Veiðivötn composition. Sediment from the sandurs containing outwash from Vatnajökull does not reach this site (Fig. 2). Only the influx of terrestrial sediment from rivers draining northern Iceland is possible at this site because the Iceland Coastal Current flows clockwise around Iceland (Fig. 3). Thus, site 916-1 has probably experienced only minor dilution by background sediment. A likely origin for the highly abundant particles with Bárðarbunga-Veiðivötn composition at this site is the 1477 Veiðivötn fissure eruption (VEI 5–6; Larsen, Reference Larsen1984; Thordarson and Larsen, Reference Thordarson and Larsen2007).
The eastern and southeastern parts of the study area (908-1 and 911-2 to 914-2) are dominated by particles with Grímsvötn-Lakagígar composition (up to 53%) (Fig. 8). Box core 912-1-t, taken on the southeast shelf at 165 m water depths, has a high proportion of particles with Katla composition (36%), which might predominantly be background sediment from Katla transported from the Mýrdalssandur delta eastward along the shelf by the South Icelandic Current. The proportion of particles with Grímsvötn-Lakagígar composition is particularly high (up to 64%) at the sites on the southeastern shelf slope (912-1-t, 913-1-t, and 914-1-t). As these sites have not been affected by the Grímsvötn 2011 eruption (Stevenson et al., Reference Stevenson, Loughlin, Font, Fuller, Macleod, Oliver, Jackson, Horwell, Thordarson and Dawson2013), we expect the Laki 1780 eruption to be the major source for primary tephra fall, although some minor Grímsvötn eruptions might also have reached the coast in this area (Thórarinsson, Reference Thórarinsson1974; Jóhannesson, Reference Jóhannesson1983; Gudmundsson et al., Reference Gudmundsson, Högnadóttir, Pálsson and Björnsson2000; Oddsson, Reference Oddsson2007; Óladóttir et al., 2011; Larsen et al., 2014 and references therein). Particles of Bárðarbunga-Veiðivötn composition in these samples could be derived from tephra fall from the 1477 Veiðivötn fissure eruption because tephra dispersal from this eruption was in this direction. Furthermore, background sediment at the sites in the eastern and southeastern areas contains abundant particles with Grímsvötn-Lakagígar and Bárðarbunga-Veiðivötn compositions transported by fluvial and eolian processes from the Vatnajökull glacier and associated sandurs (Fig. 2). Among those, the large amounts of the abundant Grímsvötn-Lakagígar material at site 901-1 could be derived from the 1996 Gjálp jökulhlaup because its discharge area is located downslope of this site.
Site 899-3, which contains a high proportion of shards of Katla composition, is located on the southern Icelandic shelf ~15 km from the outwash plain of Mýrdalssandur delta (Fig. 8). This site is exposed to a high sediment influx from rivers and jökulhlaups, which have accompanied all historical Katla eruptions recorded to date (Thordarson and Larsen, Reference Thordarson and Larsen2007) (Fig. 2). Primary tephra fall from the Eldgjá 930s eruption and other Katla and Grímsvötn eruptions (Larsen, Reference Larsen2000; Thordarson and Larsen, Reference Thordarson and Larsen2007), as well as secondary sediment from Katla and the other volcanic systems, is likely to be the contributor of material along the southern shelf.
The deepest site is 905-3, located at depth of 1610 m. At this site, ocean currents are weak (Fig. 3), suggesting high accumulation rates, consistent with the thick sediment cover indicated in the echo-sounding profile (Supplementary Figure 1g). At this site, the portion of rhyolitic shards with elongated, angular shape is strikingly high (Fig. 4a). Their composition corresponds to the series of widespread eruptions from Katla that have identical rhyolitic compositions, including the 12 ka Vedde tephra (Fig. 7a) (Lane et al., Reference Lane, Blockley, Mangerud, Smith, Lohne, Tomlinson, Matthews and Lotter2012). We suggest that this material has been reworked from a presumably thick Vedde-like tephra deposit. Turbidity currents may also have transported material from Katla to deep sites 905-3 and 909-1, south of the Iceland-Faroe Ridge.
The flux of terrestrial sediment to the southwestern shelf is lower than to the eastern shelf because there are fewer sandurs along that part of the coast supplying sediment to the sample sites (Fig. 2). Therefore, a relatively greater percentage of primary tephra fall is suggested for this area. Deposits with Bárðarbunga-Veiðivötn composition dominate site 888-1 on the southwestern shelf and site 886-3 south of Snæfellsnes. The most likely source for primary tephra fallout in the region at the western shelf is the Vatnaöldur ~870 eruption, which produced the widely dispersed Settlement/Landnám tephra (Larsen, Reference Larsen1984), whose 1 cm isopach reaches the southern coastline (Larsen, Reference Larsen1984) suggesting that large quantities of tephra were deposited on the southern and southwestern shelf. Some of these particles may also have been eroded from the primarily effusive Reykjanes volcanic system (Sigurgeirsson and Einarsson, Reference Sigurgeirsson and Einarsson2015), which has similar geochemistry (Larsen and Eiríksson, Reference Larsen and Eiríksson2008), or from submarine Surtseyan eruptions, which occurred southwest of the Reykjanes ridge segment, producing pumice (Thoroddsen, Reference Thoroddsen1925; Thorarinsson, 1965; Jakobsson Reference Jakobsson1974; Jakobsson et al., Reference Jakobsson, Jónasson and Sigurdsson2008).
Askja AD 1875
We found particles from the Askja 1875 eruption at three sites (913-1-t, 909-1, and 888-1; Fig. 7a) outside of the distributional fan published by Carey et al. (Reference Carey, Houghton and Thordarson2010) (Fig. 10a). Their work is based on deposits from onshore Iceland, delineating a narrow proximal fan toward the east. Distal isopachs (10−2–10−3 cm) extending beyond Iceland are moderately well constrained in Scandinavia. No evidence has previously been provided from sediment core data from the North Atlantic that constrain the isopachs on the seafloor. Conspicuously large and highly vesicular rhyolitic shards assigned to the Askja 1875 eruption (Fig. 4b) have been found at site 888-1 on the western shelf, southwest of the Reykjanes Ridge (Fig. 8). Even though a minor amount of basaltic material was ejected during the Askja 1875 eruption (Sigurdsson and Sparks, Reference Sigurdsson and Sparks1981), only material from the rhyolitic phase has been discovered in northern continental Europe (Oldfield et al., Reference Oldfield, Thompson, Crooks, Hall, Harkness, Housley and McCormac1997; Pilcher et al., Reference Pilcher, Bradley, Francus and Anderson2005; Wulf et al., Reference Wulf, Dräger, Ott, Serb, Appelt, Gudmundsdóttir, van den Bogaard, Słowiński, Błaszkiewicz and Brauer2016), explaining why mostly rhyolitic shards were found in the samples offshore Iceland. It remains unclear how particles with Askja 1875 composition reached site 888-1 south of the Reykjanes Ridge. Possible transport mechanisms include river drainage from central Iceland, where Askja 1875 tephra was possibly deposited, and flotation of pumice along the southern coastline, which, however, was not reported for this eruption (Larsen et al., 2014).
Öræfajökull AD 1362
Particles from the Öræfajökull 1362 eruption (VEI 5–6; Thórarinsson, Reference Thórarinsson1958; Sharma et al., Reference Sharma, Self, Blake, Thordarson and Larsen2008) have been identified at nine different sites across the entire study area (Figs. 7b and 10b). According to previous studies (Thórarinsson, Reference Thórarinsson1958; Sharma et al., Reference Sharma, Self, Blake, Thordarson and Larsen2008), comprising historical reports, tephra from this eruption was only distributed toward the east but mainly to the southeast, producing a symmetric depositional fan (Fig. 10b) (Thórarinsson, Reference Thórarinsson1958). The only occurrence of fine ash particles to the west detected in a Greenland ice core were explained by transport through circumpolar atmospheric easterly winds (Palais et al., 1991). Here we present the first findings of tephra from this eruption in the North Atlantic and also to the west.
This finding is plausible when considering the eruption dynamics provided by Sharma et al. (Reference Sharma, Self, Blake, Thordarson and Larsen2008), who determined neutral buoyancy heights for erupted tephra of 15–17 km and maximum eruption column heights of 21–24 km. The majority of tephra particles in the umbrella cloud at the neutral buoyancy heights were transported by westerly winds over the eastern Icelandic shelf, reaching the distant sites in northern continental Europe. However, the portion of the tephra that reached the overshoot level could have been subject to strong easterly stratospheric winds, which prevail at elevations of >20 km during the early summer months (Lacasse, Reference Lacasse2001), facilitating transport of fine-grained tephra at the top of the eruption column to the southwestern Icelandic shelf and to Greenland.
Mechanisms transporting material from the Öræfajökull 1362 eruption to the marine environment to the west, other than direct air fall, include discharge into the sea along the southern Icelandic shore by jökulhlaups and possibly also directly by pyroclastic density currents. Also thick pumice rafts related to this eruption were reported off Iceland’s western fjords (Jónsson et al., 2007; Larsen et al., 2014). Coastal ocean currents, in contrast, are not capable of transporting material from this eruption as far offshore as the western shelf sites, but reworking of the material downslope of the southwestern shelf is possible.
How well do the percentages of particles in the cores, as assigned to their eruptive sources, reflect the respective volumes of historical eruptions?
In order to place the identification of only 0.5% Eyjafjallajökull 2010 shards in a broader context, we compare the percentages of particles from different volcanic centers of our samples with the record of airborne Icelandic tephra found in other depositional environments (Fig. 11). To begin with, the ratio of 86% basaltic to 14% silicic particles recorded in the surface sediment coincides with the on-land Iceland record in the Holocene of 89% basaltic to 11% silicic eruptions (Larsen and Eiríksson, Reference Larsen and Eiríksson2008) and with the record from the North Atlantic with a ratio of 80%/20% for the late Pleistocene (Davies et al., Reference Davies, Abbott, Meara, Pearce, Austin, Chapman and Svensson2014). Despite their lower intensity and smaller eruption columns, basaltic phreatomagmatic eruptions produced larger volumes of tephra than silicic eruptions because mafic eruptions generally last longer and are more frequent. As weak eruptions are prone to be affected by seasonal and regional atmospheric variations at low altitudes (Petersen et al., Reference Petersen, Björnsson and Arason2012a), basaltic tephra is likely to be distributed over a widespread area at proximal and medial distances from the source, including the Icelandic mainland and our study area offshore southern Iceland. Silicic Plinian eruptions, on the other hand, are usually short lived, but characterized by high-intensity injection of large amounts of tephra into the stratosphere (Larsen and Eiríksson, Reference Larsen and Eiríksson2008), where winds tend to be stronger. Atmospheric particle residence times are longer for Plinian eruptions because the particles are transported to higher altitudes, are platier in shape, and are less dense because of higher vesicularity. In addition, stratospheric winds are stronger and thus can transport particles farther. These reasons explain the slightly higher relative proportion of silicic particles at distal sites in the North Atlantic compared with our coring sites at medial distance from the eruptive sources.
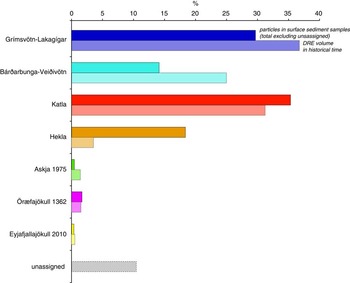
(color online) Each pair of columns compares the percentage of the respective volcanic source in the surface sediment (modal %) with percentages of dense rock equivalent (DRE) volumes of erupted magma of historical eruptions (since ~AD 870). We calculated percentages assuming that the seven listed eruptions equal 100%. Volumes for major volcanic systems (Grímsvötn-Lakagígar, Bárðarbunga-Veiðivötn, and Katla) are from Gudmundsson et al. (Reference Gudmundsson, Larsen, Höskuldsson and Gylfason2008); for volumes of eruption events, see references in Table 1. Some of the unassigned shards may be from Hekla.

The major volcanic sources for the material in our study area are Grímsvötn-Lakagígar and Katla followed by Bárðarbunga-Veiðivötn and Hekla. The historical silicic eruptions Öræfajökull 1362, Askja 1875, and Eyjafjallajökull 2010 make up less than 2% of the particles. Percentages of particles from the different volcanic systems present in the samples crudely reflect erupted magma volumes since ~AD 870 (Gudmundsson et al., Reference Gudmundsson, Larsen, Höskuldsson and Gylfason2008 and references therein) (Fig. 11). However, the Grímsvötn-Lakagígar and especially Bárðarbunga-Veiðivötn volcanic systems are slightly overrepresented; Katla and especially Hekla, on the other hand, are underrepresented in our samples.
Grímsvötn-Lakagígar is the volcanic system that has erupted the largest amount of volcanic material (Gudmundsson et al., Reference Gudmundsson, Larsen, Höskuldsson and Gylfason2008; Larsen and Eiríksson, Reference Larsen and Eiríksson2008), and its eruption frequency recorded in ice is greater than that of the Bárðarbunga-Veiðivötn volcanic system (Larsen et al., Reference Larsen, Gudmundsson and Björnsson1998). This is mirrored in the surface sediment, where the amount of Grímsvötn-Lakagígar material is also greater (Figs. 8 and 11). The discrepancy in the relative amount of material in our samples compared with the relative erupted volume since ~870 is caused by the bias in distribution of basaltic versus silicic eruptions and the input of material from the different volcanic systems through erosion. Katla and Hekla had many explosive historical eruptions. The Grímsvötn-Lakagígar and Bárðarbunga-Veiðivötn volcanic systems, on the other hand, produced many basaltic subglacial or effusive fissure eruptions. Moreover, they are situated in highly erosive milieus beneath Vatnajökull. Thus, material from the subglacial, fissure, and low-intensity explosive eruptions, which was deposited in close vicinity to the volcanoes, reached the ocean by fluvial or eolian mechanisms. Unlike the previously discussed volcanic systems, Hekla is not situated under a glacier, and thus erosion of its primary tephra deposits is minimal. In addition, the high explosiveness of Hekla eruptions results in more material being deposited farther from the source. These factors explain the strong underrepresentation of Hekla particles in our samples compared with the historical erupted volume. Finally, a high proportion of the unassigned particles might be from Hekla, but they cannot be assigned unequivocally.
In conclusion, the percentages of particles assigned to the different volcanic systems in this study represent both the direct input from explosive eruptions and the background sediment derived from onshore erosion, which also includes low-intensity eruptions from which tephra did not reach the sampling sites by primary air fall. All historical eruptions with a VEI >4 that can be identified by their unique geochemical characteristics are represented in our samples. Their percentages are similar to the historically erupted volumes in the literature, if compared to those of products from other volcanic systems. Tephra from medium-size events that is deposited on the seafloor is diluted by the incoming background sediment. Therefore, the surface sediment is not dominated by the most recent eruption of Eyjafjallajökull in 2010, but rather reflects the erupted magma volumes from the different volcanic systems, covering at least the last 1000 yr.
CONCLUSIONS
The upper 1 cm of the surface sediments at 12 sites offshore southern Iceland contain particles from all historical eruptions exceeding VEI 4 and contributions from all major volcanic centers in southwestern Iceland, as well as Askja. The proportions of tephra from the different volcanic systems at the different sites are similar to the erupted percentages over the last 870 yr. They are, however, derived not only from primary tephra fall but also from erosion of on-land deposits. The scarcity of the Eyjafjallajökull 2010 particles in the cores reflects the complex processes that affect the tephra particles on their journey from the source to the marine archive. These processes cause reworking of primary tephra fall deposits and their intermixing with background sediment. The Eyjafjallajökull 2010 eruption plume was located above our sampling sites, which cover a large variety of marine depositional regimes along the Icelandic margin. The eruption, however, did not leave a traceable deposit on the seafloor at any of the sites, because the erupted tephra was diluted by background sediment and/or reworked. This case study demonstrates that medial proximal marine sites are not necessarily the best sites to sample medium-sized eruptions. Further studies are necessary, such as sampling profiles oriented perpendicular to Iceland going to the east, southeast, and south of Iceland beyond the area sampled in this study, in order to determine if the preservation potential is better at more distal sites and to evaluate the optimal marine sites for Icelandic tephra preservation. Areas near continental shelves, however, should be avoided, because they will have problems with background sedimentation and reworking similar to the high-energy sites close to Iceland. Nevertheless, not all of our sites were located in a high-energy environment (e.g., 905-2 and 909), and therefore we expected better preservation of tephra from medium-sized eruptions at those sites, which, however, was not the case for the Eyjafjallajökull 2010 eruption. Therefore, this study demonstrates that eruptions, which disperse tephra over large areas and distances and can threaten northern Europe, do not necessarily produce detectable marine tephra deposits at medial proximity to the source because of dilution of the primary tephra by high background sedimentation and reworking processes. With respect to the aim of correctly reconstructing eruption frequencies at Iceland and other coastal settings, we conclude that the frequency of past medium-sized eruptions may often be higher than detectable in the marine archive. Our results also emphasize the need for detailed investigation of all available archives, not just visible ash layers, and the significance of cryptotephras.
Acknowledgments
Credit is due to Steffen Kutterolf and Christel van den Bogaard for helpful discussion and comments on the manuscript and to Nadine Schattel who provided geochemical data. We also thank Mario Thöner for assisting with the electron microprobe measurements and all participants of R/V Poseidon cruise 457, in particular the chief scientist Reinhard Werner. We also thank Stefan Wastegård and two anonymous reviewers, as well as the editors who provided helpful comments on this manuscript.
SUPPLEMENTARY MATERIAL
To view supplementary material for this article, please visit https://doi.org/10.1017/qua.2017.15