Introduction
The meiotic spindle in MII oocytes can be identified, using polarized light microscopy, prior to microinjection of sperm (Cooke et al., Reference Cooke, Tyler and Driscoll2003). Studies have suggested that spindle morphology has potential value in the assessment of the quality of oocytes (Kilani et al., Reference Kilani, Cooke and Chapman2006). There is evidence that the presence of a meiotic spindle in MII oocytes has a positive relationship with outcomes in IVF (Cooke et al., Reference Cooke, Tyler and Driscoll2003; Kilani et al., Reference Kilani, Cooke, Kan and Chapman2009). Wang et al. (Reference Wang, Meng, Hackett, Odenbourg and Keefe2001, Reference Wang, Meng, Hackett, Oldenbourg and Keefe2002) showed that oocytes with a visible spindle have higher fertilization rates and result in better embryo development to blastocyst stage. Those oocytes with an absent spindle had lower fertilization rates and poorer embryo development.
A study by Eichenlaub-Ritter et al. (Reference Eichenlaub-Ritter, Shen and Tinneberg2002) showed that spindles may still be present in metaphase II human oocytes that do not exhibit birefringent spindles, but these spindles are usually dysmorphic, and frequently have unaligned chromosomes. Oocytes with absent or abnormal spindles, if fertilized, have a lower overall capacity to develop into a normal embryo (Kilani et al., Reference Kilani, Cooke and Chapman2006; Shen et al., Reference Shen, Stalf, Mehnert, De Santis, Cino, Tinneberg and Eichenlaub-Ritter2006).
Furthermore, it is possible to identify oocytes with spindles displaced from the oolemma next to the first polar body (Liu et al., Reference Liu, Trimarchi, Oldenbourg and Keefe2000; Rienzi et al., Reference Rienzi, Ubaldi, Martinez, Iacobelli, Minasi, Ferrero, Tesarik and Greco2003) or oocytes, which are still in cytokinesis/telophase I of maturation and are therefore not suitable for ICSI (Eichenlaub-Ritter et al., Reference Eichenlaub-Ritter, Shen and Tinneberg2002; Montag et al., Reference Montag, Schimming and van der Ven2006).
In addition to observation of their presence and shape, there has been work studying the magnitude of the retardance of the spindle using polarized light microscopy (Liu et al., Reference Liu, Trimarchi, Oldenbourg and Keefe2000; Shen et al., Reference Shen, Stalf, Mehnert, De Santis, Cino, Tinneberg and Eichenlaub-Ritter2006). Liu et al. (Reference Liu, Trimarchi, Oldenbourg and Keefe2000) calculated mean retardance in oocyte spindles of the mouse after parthenogenetic activation or fertilization either in the whole spindle area or in line scans through the spindle equator. His results were different to those calculated by Pelletier et al. (2004). Shen et al. (Reference Shen, Stalf, Mehnert, De Santis, Cino, Tinneberg and Eichenlaub-Ritter2006) suggested that it is difficult to standardize measurements and compare absolute values between different laboratories because of the differences in optics and culture conditions. However, here data from a large cohort of oocytes showed that there was a significantly higher retardance in oocytes resulting in conception compared with those failing to result in pregnancy.
Other studies showed that prolonged ageing at metaphase II, for instance during postovulatory ageing in vivo or in vitro, may result in deterioration of spindle, as shown in animal and human oocytes (Eichenlaub-Ritter et al., Reference Eichenlaub-Ritter, Chandley and Gosden1986, Reference Eichenlaub-Ritter, Stahl and Luciani1988; Segers et al., Reference Segers, Adriaenssens, Coucke, Cortvrindt and Smitz2008).
Based upon the studies performed to date, one might expect that the time when a maximum number of oocytes in a cohort possess spindles, as implicated by spindle birefringence, could be the best time for microinjection, in terms of fertilization rates, embryo development and eventually pregnancy rates (Shen et al., Reference Shen, Betzendahl, Tinneberg and Eichenlaub-Ritter2008).
In this unique study, we have therefore followed the changes that occur in the meiotic spindle over time in culture with the aim of finding whether there is a time when a maximum number of oocytes possess spindles of presumably highest quality/robustness as implicated by spindle birefringence.
Materials and Methods
Inclusion criteria
Oocytes of patients ≤ 38 years of age (average age: 32.2 years; range 22–38 years) undergoing IVF/ICSI were included in this study. Patients with between 5 to 10 MII oocytes were included. The average number of oocytes collected were 11.9 ± 2.8, of those an average of 7.1 ± 1.6 MII oocytes were studied.
Controlled ovarian stimulation
Controlled ovarian stimulation was achieved by a long-down regulation combination of a GnRH-agonist and follicle-stimulating hormone (FSH). The GnRH-agonist was either a subcutaneous injection (Lucrin, leuprorelin acetate) or a nasal spray (Syneral, nafarelin acetate solution, Searle). Recombinant FSH was used (GONAL-F, Serono or Puregon, Organon) to induce follicular growth, and 250 IU of hCG (Ovidrel, Serono) was administered to achieve final maturation and trigger ovulation when at least two follicles were at least 18 mm in diameter as measured by trans-vaginal ultrasound. Thirty-six hours later, ultrasoundguided oocyte retrieval was performed using a single lumen 17G ovum pick-up set (Cook). All oocytes were returned to the IVF laboratory in HEPES-buffered medium (Sage) at 37°C in a portable incubator (LEC-960, LEC Instruments).
Trial design
Oocytes were collected at 36 h post hCG (Ovidrel 250IU Serono, Frenchs Forest, Australia). During egg collection temperature was maintained at all stages using equilibrated warm stages and LEC-960 (LEC Instruments) portable incubator.
Immediately after collection, oocytes were denuded using a HEPES-buffered pre-warmed 30 IU of hyalase (CP Pharmaceutical Ltd) on a temperature checked warm stage and by using a four-well pre-warmed Nunc dish (Nuclon).
Each MII oocyte was then placed separately in a 5 μl droplet of fertilization medium + HSA (Sage, BioPharma) covered with warm tissue culture oil (Sage, BioPharma) in a pre-warmed/pre-equilibrated glass bottomed dish (Wilco Wells BV).
Oocytes were checked by using the PolScope for the presence of the spindle on a temperature controlled stage (Olympus). The oocytes were rotated at least four times around each axis (X–Y–Z), to identify the spindle and optimize its properties for measurements.
The previous process were repeated at the six time intervals 36–36.5 h (directly after denuding), 36.5–37 h, 38–38.5 h, 39–39.5 h, 40–40.5 h and 40.5–41 h. Images were captured at each stage and saved for later analysis.
Between each interval, the glass bottomed dish containing the oocytes was then incubated in a triple gas mix of (5% CO2, 5% O2, 90% N2) Minc incubator (Minc-1000, Cook).
The final image were captured at 40–40.5 h post hCG when the oocytes were injected. Intracytoplasmic sperm injection (ICSI) was performed by holding the oocyte with the meiotic spindle at 12 o'clock and the injecting pipette is inserted at 3 o'clock towards the 9 o'clock position.
Embryos generated from these oocytes were transferred on day 2 post ICSI. Selection criteria of transferred embryos were determined by the morphological shape of the embryos using IVF Australia scoring system (best embryos were 3–4 cells on day 2 with < 20% cell fragmentation). The rest of the embryos were either frozen or discarded.
Image analysis
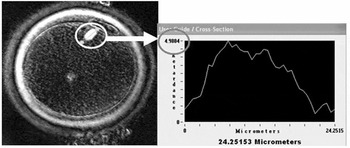
Saved images of oocytes were retrieved and were analysed for the presence or absence of a meiotic spindle at the six time intervals. Spindle retardance was determined by taking the highest density measurement across the spindle by pulling a scan line along the spindle equator and from pole to pole (Fig. 1). Average spindle retardance was taken as the mean of four measurements of the highest density, along the longitude axis of the spindle as defined in Kilani et al. (Reference Kilani, Cooke, Kan and Chapman2009).
Method used for measuring spindle retardance.

Study endpoints
The endpoints of the study were the detection of a meiotic spindle and the measurement of spindle retardance at each of the six time intervals.
Statistical analysis
Chi-squared test was used to compare percentages of meiotic spindles detected at each time interval. Two-tailed Student's t-test was used for quantitative analysis of spindle retardance. ANOVA test for comparison of multiple variables was utilized. Data analysis was performed using SPSS software.
Approval for the study was obtained from the IVF Australia NHMRC Human Research Ethics Committee.
Results
Seventy eight oocytes from 12 patients were studied. The average age of studied patients were 32.2 years (range: 22–38 years) and the average number of oocytes collected was 11.9 ± 2.8. An average number of 7.1 ± 1.6 oocytes were MII and therefore were included in the study.
All 78 oocytes were micro-injected at 40–41 h post hCG. 58 (74%) of these oocytes were normally fertilized. An average of 1.2 embryos was transferred on day 2 of culture. In four of the 12 (33%) patients, a fetal heart was detected.
Meiotic spindle detection
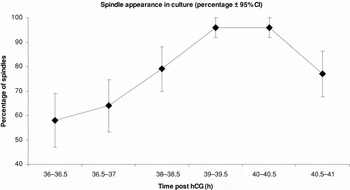
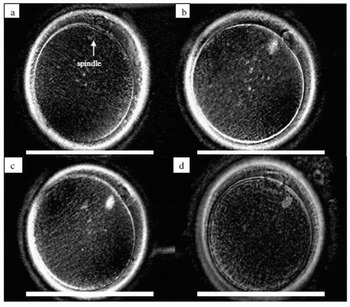
Fifty eight per cent of the MII oocytes had a detectable meiotic spindle directly after transvaginal oocyte retrieval and denudation, which was 36.0–36.5 h following hCG injection. This percentage increased after 30 min (36.5–37.0 h post hCG) of in vitro culturing (64% vs. 58%, p = 0.3) and increased again 38–38.5 h post hCG (79% vs. 64%, p > 0.05). At 39–39.5 h post hCG, the percentage of spindles detected had increased significantly from 36.5–37.0 h (96% vs. 64%, p = 0.001) although not significantly from 38–38.5 h (96% vs. 79%, p = 0.05). It then stabilized at 40–40.5 h before the percentage dropped significantly at 40.5–41.0 h post hCG (77% vs. 96%, p = 0.001) (see Table 1, Fig. 2).
Meiotic spindle appearance over time in in vitro culture.

Chi-squared test b>ap = 0.001 39–39.5 h post hCG compared with 36–36.5 h.
Chi-squared test c>dp = 0.001 40–40.5 h post hCG compared with 40.5–41 h.
Percentage of oocytes with a spindle at different levels of culture.

Meiotic spindle retardance
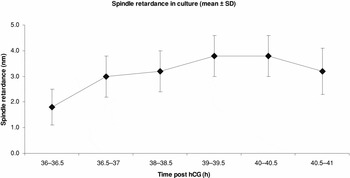
Directly after retrieval, the average spindle retardance was (1.8 ± 0.7 nm). This average increased significantly after 30 min of culture (1.8 ± 0.7 nm vs. 3.0 ± 0.8 nm, p = 0.0008). At 38–38.5 h post hCG the average spindle retardance slightly increased to 3.2 ± 0.8 nm but this increase was not significant. However, at 39–39.5 h the average spindle retardance increased significantly and peaked at (3.8 ± 0.8 nm vs. 3.2 ± 0.8 nm, p = 0.0001). The retardance then stabilized at 40–40.5 h before dropping significantly at 40.5–41.0 h post hCG (3.2 ± 0.9 nm vs. 3.8 ± 0.8; p = 0.0001) (see Table 2, Fig. 3).
Meiotic spindle retardance through in vitro culture.

t-test b>ap = 0.001 39–39.5 h post hCG compared with 36–36.5 h.
t-test c>dp = 0.001 40–40.5 h post hCG compared with 40.5–41 h.
Meiotic spindle retardance through in vitro culture.

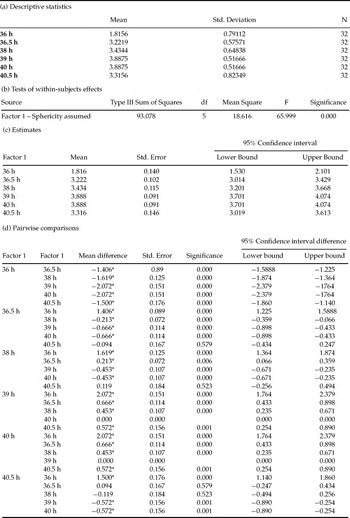
Further analysis using ANOVA test for comparison of multiple variables showed that 32 (41%) of oocytes had a visible spindle throughout the six time intervals (Table 3). These oocytes underwent a significant change in the mean spindle density over time (Fig. 4).
ANOVA analysis for the 32 oocytes that showed a visible meiotic spindle throughout the six time intervals.

Images showing the typical meiotic spindle changes over time in culture in one single oocyte. Bar = 100 μm. (a) At 36–36.5 h post hCG, showing an oocyte with a faint spindle (arrow). (b) At 38–38.5 h post hCG, the spindle becomes distinct. (c) At 39–39.5 h post hCG, the spindle image is distinct; spindle is clearly bipolar. (d) At 40–40.5 h post hCG, the spindle starts to disappear.

Each time interval (six intervals) was analysed for the difference in the mean spindle density when compared with the other five intervals. The analysis is shown in the following:
1. Interval 1 (36–36.5 h): There were a significant difference in the mean spindle density between oocytes analysed at 36–36.5 h post hCG and 36.5–37.0 h, 38–38.5 h, 39–39.5 h, 40–40.5 h and 40.5–41 h (p = 0.000).
2. Interval 2 (36.5–37 h): The mean spindle densities of oocytes analysed at 36.5–37.0 h post hCG showed significant difference from those checked at 36–36.5 h, 38–38.5 h, 39–39.5 h and 40–40.5 h post hCG (p = 0.000). However, there was no significant difference in the mean spindle density at 36.5–37.0 h and 40.5–41.0 h post hCG (p = 0.579).
3. Interval 3 (38–38.5 h): There were a significant difference in the mean spindle density at 38–38.5 h post hCG and 36–36.5 h, 36.5–37.0 h, 39.0–39.5 h, 40.0–40.5 h post hCG (p = 0.000). Oocytes analysed at 38–38.5 h post hCG and those analysed at 40.5–41.0 h post hCG showed no significant difference in the mean spindle density (p = 0.523).
4. Interval 4 (39–39.5 h): The mean spindle density was significantly different at 39.0–39.5 h compared with 36.0–36.5 h, 36.5–37.0 h, 38–38.5 h and 40.5–41.0 h post hCG (p = 0.000). There was no difference in spindle density in oocytes analysed at 38–38.5 h and 39.0–39.5 h post hCG.
5. Interval 5 (40–40.5 h): Analysis of oocytes showed that there was no significant difference in spindle density between oocytes at 40.0–40.5 h and 36.0–36.5 h, 36.5–37.0 h, 38–38.5 h, 39–39.5 h and 40.5–41.0 h post hCG.
6. Interval 6 (40.5–41 h): There was a significant difference in mean spindle density of oocytes at 40.5–41.0 h and 36–36.5 h, 40–40.5 h and 40.5–41.0 h post hCG (p < 0.05). The difference between mean spindle density of oocytes at 40.5–41.0 h and mean spindle density at 36.5–37.0 h and 38–38.5 h was not significantly different (p = 0.579; p = 523).
Discussion
This study of meiotic spindle changes over multiple time intervals is unique. It has demonstrated that the meiotic spindle is a dynamic structure altering over time, and that there is a specific period when the meiotic spindles are detectable at a maximum incidence before they start to disaggregate. Directly after egg collection, only 58% of the MII oocytes had a birefringent spindle (36–36.5 h post hCG). Data published in the literature to date have not investigated spindles as early as 36 h post hCG or directly after oocyte retrieval. The earliest assessment has been at 38 h when 79% presence has been reported (Montag et al., Reference Montag, Schimming and van der Ven2006). The lower percentage of oocytes with spindles after denuding might be due to temperature fluctuations through the process of oocyte handling at retrieval and transport to the laboratory, an issue that has been addressed previously in the literature (Wang et al., Reference Wang, Meng, Hackett, Odenbourg and Keefe2001, Reference Wang, Meng, Hackett, Oldenbourg and Keefe2002; Eichenlaub-Ritter et al., Reference Eichenlaub-Ritter, Shen and Tinneberg2002). The slight increase in this percentage after 30min in culture (36.5–37.0 h post hCG) could be due to the stabilization of the temperature which is thought to make the spindle reassemble. But the change was only slight, and so we believe the 58% presence at 36 h is a valid observation.
In our laboratory, every attempt is made to keep a stable temperature environment by the use of heated stages with continuous temperature checking using a calibrated NATA thermometer and minimal handling of the oocytes outside the incubators. In this study we also handled no more than one patient per day to ensure minimum delays in the spindle checking process. Therefore, we believe temperature variation to be of minimum impact in this study. Had temperature been an issue, it should have resulted in a constantly lower percentage of spindle detection.
The percentage of detectable spindles increased to 79% 38–38.5 h post hCG. These results are comparable with a study performed by (Montag et al., Reference Montag, Schimming and van der Ven2006), where 79.8% of MII oocytes showed a birefringent spindle 38 h post hCG.
The maximum number of oocytes with a spindle was at an interval of 39–40.5 h post hCG, when 96% had a birefringent spindle. However, lower maximum spindle detection has been reported in previous studies with the highest reported as 92% (Cooke et al., Reference Cooke, Tyler and Driscoll2003). This may be due to their failure to standardize the time post hCG when assessing the meiotic spindle, as they either did not report timing or it was reported as a broader range of 38–40 h post hCG.
The percentage of detectable spindles declined significantly after 40.5–41 h post hCG (77%) when the spindle starts to disassemble. There were no data later than 40.5–41 h post hCG as injection needed to be done to ensure the best outcome for patients. It would be interesting to know the fate of spindles after this time.
Rapid deterioration of spindles has been detected in vitro matured oocytes at 48h of culture, which had the highest maturation/PB rate at 36 h and accordingly aged for 12 h (Eichenlaub-Ritter et al., Reference Eichenlaub-Ritter, Chandley and Gosden1986, Reference Eichenlaub-Ritter, Stahl and Luciani1988; Segers et al., Reference Segers, Adriaenssens, Coucke, Cortvrindt and Smitz2008).
The spindle retardance has been shown to be an indicator of spindle integrity (Rama Raju et al., Reference Rama Raju, Prakash, Krishna and Madan2007). In this study it peaked at the same time interval (i.e. 39–40.5 h post hCG), which probably indicates optimum oocyte maturity at this time.
Based on our results we would propose that the optimum time for ICSI is 39–40.5 h post hCG under the standard stimulation protocol and with oocytes from patients under 38 years. In a preliminary analysis, retrospectively reviewing the outcome of oocytes injected at different times in our laboratory seemed to support this view, with the highest fertilization rates and number of good quality embryos resulting from oocytes injected between 39–40.5 h post hCG (unpublished data).
The results of the current study were observed following standard stimulation protocol and one type of culture medium. Other stimulation protocols and culture condition might influence the optimal time for ICSI. Therefore, the optimal time might need to be determined in each IVF laboratory and for each age group. Optimal maturity might correlate to highest average retardance and, possibly, best developmental potential. Further studies are obviously required to assess the impact of age and stimulation protocols.
Conclusion
The results of this unique study show that the meiotic spindle is a dynamic structure that can appear and disappear over time in culture. The highest spindle detection rate and density was at 39–40.5 h post hCG after which spindles start to break down and disaggregate. As it has previously been shown that oocytes with a visible spindle and higher retardance have higher fertilization rates and produce higher quality embryos, these results suggest that the best time to inject oocytes is at 39–40.5 h post hCG.
Acknowledgements
The authors are most grateful to the staff at IVF Australia for their cooperation throughout the study. We also thank Mr Alex Wang, of the Perinatal Reproductive Epidemiology Research Unit, University of New South Wales, for his contributions to the statistical analysis of these data.