





1. Introduction
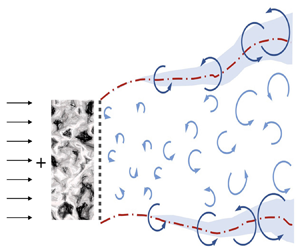
The complexity of wind energy conversion stems from the interplay between the atmospheric turbulent flow and wind turbines and their wakes (Sørensen Reference Sørensen2011; Stevens & Meneveau Reference Stevens and Meneveau2017; Meneveau Reference Meneveau2019; Veers et al. Reference Veers2019). The atmospheric turbulence happens over a broad range of spatial and temporal scales. Using only turbulence intensity (TI), which is commonly done in wind energy applications, is certainly not enough to describe how atmospheric turbulence affects the energy conversion and wake development for a wind turbine. Several factors, such as terrain and atmospheric stability, affect the characteristics of atmospheric turbulence. This, combined with aerodynamics at the blade scale, makes the study of the impacts of atmospheric turbulence on wind energy conversion rather complicated. A permeable disk, neglecting blade aerodynamics, is often employed in numerical and laboratory experiments to model the aerodynamics of a horizontal axis wind turbine. In this study, we carry out large-eddy simulations (LESs) to investigate the impacts of inflow turbulence intensity and inflow turbulence length scale on the flow past a permeable disk, with focus on flow recovery in the wake, the capability of a disk in extracting inflow turbulence kinetic energy (TKE) and the statistics of wake-added turbulence.
Inflow turbulence affects wind turbine aerodynamics in several aspects. It affects the efficiency of wind energy conversion. In wind tunnel experiments, Gambuzza & Ganapathisubramani (Reference Gambuzza and Ganapathisubramani2021) showed that increasing inflow TI increases the power output of a model wind turbine. Such an increase is caused by the dependence of blade aerodynamics on inflow turbulence, especially the flow separation on the suction side of a blade (Talavera & Shu Reference Talavera and Shu2017). In the field, on the other hand, complex variations of power output with TI, depending on the wind turbine operation regime and the thermal stratification condition, were observed (St Martin et al. Reference St Martin, Lundquist, Clifton, Poulos and Schreck2016). Inflow turbulence affects the wake recovery. In general, the wake recovers faster for higher inflow TIs as shown in wind tunnel experiments (Barlas, Buckingham & van Beeck Reference Barlas, Buckingham and van Beeck2016), numerical simulations (Liu et al. Reference Liu, Li, Yang, Xu, Kang and Khosronejad2022) and field measurements (Carbajo Fuertes, Markfort & Porté-Agel Reference Carbajo Fuertes, Markfort and Porté-Agel2018). The wake recovery can be described using two parameters, the wake recovery rate and the near wake length. The field measurements by Carbajo Fuertes et al. (Reference Carbajo Fuertes, Markfort and Porté-Agel2018) showed that increasing inflow TI shortens the near wake length and increases the wake recovery rate. Empirical relations were proposed to correlate the expansion coefficient and near wake length with inflow TI (e.g. Bastankhah & Porté-Agel Reference Bastankhah and Porté-Agel2016; Carbajo Fuertes et al. Reference Carbajo Fuertes, Markfort and Porté-Agel2018; Ishihara & Qian Reference Ishihara and Qian2018; Vahidi & Porté-Agel Reference Vahidi and Porté-Agel2022). It should be noted that the near wake length employed for calculating the growth of the wake width is often not the same as the wind turbine downwind distance for pressure recovery.
Inflow turbulence affects the evolution of coherent flow structures in wind turbine wakes. Both the atmospheric flow and wind turbine wakes consist of flow structures over a broad range of scales, and their interplay affects the wake evolution in different ways. Tip vortices are the typical flow structures in the near-wake region, which separate the low momentum wake flow from the high momentum ambient flow. Ivanell et al. (Reference Ivanell, Mikkelsen, Sørensen and Henningson2010) showed that the tip vortex instability is sensitive to inflow perturbations of certain frequencies. Wake meandering, a low-frequency, large-scale motion of wake in the transverse directions, is the dominant flow phenomenon in the far wake. Two mechanisms exist for wake meandering, i.e. the large eddy mechanism and the shear layer instability mechanism. In the first mechanism, inflow eddies with scales greater than a critical scale advect the wake as passive scalars. In the second mechanism, the wake meandering occurring at certain frequencies is similar to vortex shedding from a bluff body. The coexistence of the two mechanisms has been shown in both field measurements and numerical simulations (Heisel, Hong & Guala Reference Heisel, Hong and Guala2018; Yang & Sotiropoulos Reference Yang and Sotiropoulos2019). For the first mechanism, it is crucial to define the critical large scale. Our recent work based on energy analysis in scale space showed that the critical scale is around  $3D$ (where
 $D$ is the rotor diameter). As for the second mechanism, it was found that inflow perturbations with frequencies in the range of
 $0.25< St<0.63$ (where
 $St=fD/U_{\infty }$) are effective in triggering wake meandering (Mao & Sørensen Reference Mao and Sørensen2018). A similar range of frequencies was also observed for the motion of a floating offshore wind turbine, at which a small-amplitude wind turbine motion (
 ${\sim }0.01D$) can trigger wake meandering motion of amplitude in the order of
 $D$ (Li, Dong & Yang Reference Li, Dong and Yang2022).
The interactions between the inflow turbulence and the wind turbine and its wake are scale-dependent. However, the investigations in this aspect are limited (Chamorro et al. Reference Chamorro, Guala, Arndt and Sotiropoulos2012; Blackmore, Batten & Bahaj Reference Blackmore, Batten and Bahaj2014; Jin et al. Reference Jin, Liu, Aggarwal, Singh and Chamorro2016; Gambuzza & Ganapathisubramani Reference Gambuzza and Ganapathisubramani2023), with the TI often being the only metric employed in engineering models (Vermeer, Sørensen & Crespo Reference Vermeer, Sørensen and Crespo2003). In wind tunnel experiments, Chamorro et al. (Reference Chamorro, Guala, Arndt and Sotiropoulos2012) showed that the inflow TKE is reduced at low frequencies when airflow passes a rotor, while the TKE is added at relatively high frequencies in wake, indicating a dual role of a wind turbine as a high-pass filter and an active turbulence generator. In their later experiments for free stream turbulence (Jin et al. Reference Jin, Liu, Aggarwal, Singh and Chamorro2016), it was shown that the TKE is added to a range of frequencies with  $0.1< St<1.0$ for inflow TI 11.5 %. In recent wind tunnel experiments carried out by Gambuzza & Ganapathisubramani (Reference Gambuzza and Ganapathisubramani2023), the impacts of free stream turbulence of both Kolmogorov-like and non-Kolmogorov-like on the wake of a model wind turbine were investigated. Their results showed that the low-frequency velocity fluctuations (with
 $St \approx 0.01$ and
 $0.02$) in the non-Kolmogorov-like flows are inefficient in promoting the mixing of the wake with the ambient flow. The characteristics of inflow turbulence can be well controlled in numerical simulations. In the LES studies by Blackmore et al. (Reference Blackmore, Batten and Bahaj2014) and Ghate et al. (Reference Ghate, Ghaisas, Lele and Towne2018), it was shown that inflow TI has limited effects on wake width while increasing inflow integral length scale increases wake width (with the inflow TI approximately the same). The above studies shed light on the scale-dependent nature of the ‘inflow turbulence’–‘wind turbine’–‘wake’ interactions. However, the detailed dynamics is yet to be investigated for a wide range of parameters. Particularly, the knowledge gaps we attempt to fill in this work are as follows.
(i) Field data showed the dependence of the growth rate of wake width on inflow TI (Carbajo Fuertes et al. Reference Carbajo Fuertes, Markfort and Porté-Agel2018), without distinguishing the influences of the inflow length scale. The LES results, on the other hand, indicated significant impacts from the inflow length scale on the growth rate (Blackmore et al. Reference Blackmore, Batten and Bahaj2014; Ghate et al. Reference Ghate, Ghaisas, Lele and Towne2018). The exact roles of inflow TI and integral length scale on the flow recovery in the wake are missing.
(ii) The wind tunnel experiments by Chamorro et al. (Reference Chamorro, Guala, Arndt and Sotiropoulos2012) showed that a wind turbine acts as a high-pass filter of the inflow turbulence for a particular case. The nature as a filter for different inflow TIs and integral length scales is unclear.
(iii) It has been shown that wake-added TKE is located at a certain range of frequencies for one inflow TI (Jin et al. Reference Jin, Liu, Aggarwal, Singh and Chamorro2016). How the inflow TI and integral length scale impact the spectral characteristics of wake-added TKE is yet to be uncovered.
Numerical simulations, in which the inflow can be specified in a precise way, are effective for investigating how inflow turbulence affects the energy conversion and wake development of a wind turbine. In this work, we employ several simplifications to facilitate the investigation, which cannot be easily done for a utility-scale wind turbine under realistic atmospheric wind conditions. The simplifications include the actuator disk (AD) model without rotation (Yang, Kang & Sotiropoulos Reference Yang, Kang and Sotiropoulos2012) for blade aerodynamics, and the synthetic turbulence technique for generating inflow turbulence with specified TI and turbulence integral length scale. The investigation carried out is of practical importance in developing scale-dependent engineering models, e.g. including both inflow TI and integral length scale in the formulation of the wake expansion model and to describe the wake-added turbulence.
The interaction with the inflow turbulence and the wake for a real-life wind turbine rotor involves a broad range of scales from blade aerodynamics to the atmospheric boundary layer and beyond. The idea of this work is to simplify the problem in order to focus on the impact of the primary role of a wind turbine rotor, i.e. energy extraction, on the scale dynamics. The blade aerodynamics, which is overlooked in this work, should be considered for further analysis of the energy extraction process and dynamics in the near wake. This, however, needs to be done case by case considering various blade designs, which may significantly affect the wake dynamics (Dong et al. Reference Dong, Qin, Li and Yang2023).
The rest of the paper is structured as follows. In § 2, the numerical method employed is described. Then, the case set-ups are presented in § 3. The obtained results are analysed in § 4. Finally, conclusions are drawn in § 5.
2. Numerical method
Large-eddy simulations are performed using the VFS-Wind code (Yang et al. Reference Yang, Sotiropoulos, Conzemius, Wachtler and Strong2015b), which has been validated against experiments (Yang & Sotiropoulos Reference Yang and Sotiropoulos2013; Yang et al. Reference Yang, Sotiropoulos, Conzemius, Wachtler and Strong2015b; Yang & Sotiropoulos Reference Yang and Sotiropoulos2018), applied to reveal the mechanism of wind turbine wake (Li & Yang Reference Li and Yang2021; Dong et al. Reference Dong, Qin, Li and Yang2023) and wind farm flows (Dong et al. Reference Dong, Li, Qin and Yang2022; Wang et al. Reference Wang, Dong, Li and Yang2023) and employed to develop reduced-order models (Li & Yang Reference Li and Yang2024). In this study, the atmospheric stability condition is set as neutral. The Coriolis force is not considered. In the LES module of the VFS-Wind code, the spatially filtered incompressible Navier–Stokes equations are solved to obtain the flow field, which read as follows:
 \begin{equation} \frac{\partial \tilde{u}_i}{\partial x_i} = 0, \end{equation}
 \begin{equation} \frac{\partial \tilde{u}_i}{\partial t} + \frac{\partial \tilde{u}_i \tilde{u}_j}{\partial x_j} ={-}\frac{1}{\rho}\frac{\partial \tilde{p}}{\partial x_i} + \nu \frac{\partial^2 \tilde{u}_i }{\partial x_j \partial x_j} - \frac{\partial \tau_{ij}}{\partial x_j}+ f_i, \end{equation}
where  $i,j=1,2,3$ are directional indices,
 $u_i$ the velocity components,
 $p$ the pressure,
 $\nu$ the kinematic viscosity,
 $\tilde {{\cdot }}$ the spatial-filtering operator and
 $\tau _{ij}$ is the residual stress tensor resulting from the spatial-filtering process. The residual stress tensor
 $\tau _{ij}$ is modelled using an eddy viscosity model as follows:
 \begin{equation} \tau_{ij} - \tfrac{1}{3}\tau_{kk}\delta_{ij}={-}2\nu_{t}\tilde{S}_{ij}, \end{equation}
where  $\tilde {S}_{ij}=({\partial \tilde {u}_i}/{\partial x_j} + {\partial \tilde {u}_j}/{\partial x_i})/2$ is the filtered strain-rate tensor. The eddy viscosity
 $\nu _{t}$ is calculated by
 \begin{equation} \nu_{t} = Cs^{2}\varDelta^{2}\left|\tilde{S}\right|, \end{equation}
where  $|\tilde {S}| = \sqrt {2|\tilde {S}_{ij}||\tilde {S}_{ij}|}$,
 $\varDelta$ is the filter size and
 $Cs$ is the Smagorinsky coefficient computed using the dynamic approach (Germano et al. Reference Germano, Piomelli, Moin and Cabot1991). In (2.2), the source term
 $f_i$ represents the body force resulting from the permeable disk (AD concept) (Yang et al. Reference Yang, Kang and Sotiropoulos2012; Yang & Sotiropoulos Reference Yang and Sotiropoulos2013). In the employed AD model, the thrust of the permeable disk
 $T$ is uniformly distributed on the disk. The tangential force due to rotor rotation is neglected. The thrust
 $T$ is computed by specifying the thrust coefficient and using the incoming velocity
 $U_{\infty }$ via
 $T = \tfrac {1}{2} \rho C_T U^2_\infty A$, where
 $\rho$ is the air density and
 $A={\rm \pi} R^2$ (where
 $R$ is the radius of the AD). In the present implementation of the AD model, the
 $U_{\infty }$ is obtained by averaging the instantaneous streamwise velocity over a disk of radius
 $R$ located at one disk diameter upstream.
The governing equations are spatially discretized using the second-order accurate central difference scheme, and the fractional step method is used for the integration in time (Ge & Sotiropoulos Reference Ge and Sotiropoulos2007). The Jacobian-free Newton–Krylov method (Knoll & Keyes Reference Knoll and Keyes2004) is used to solve the momentum equation. The pressure Poisson equation is solved using the generalized minimum residuals method with an algebraic multigrid acceleration (Saad Reference Saad1993).
The inflow turbulence is generated using Mann's method (Mann Reference Mann1998) which employs the von Kármán spectrum given as follows:
 \begin{equation} E(k) = \alpha \varepsilon^{{2}/{3}} {L}^{{5}/{3}} \frac{(Lk)^4}{(1 + (Lk)^2)^{{17}/{6}}}, \end{equation}
where  $k$ is the wavenumber,
 $L$ the length scale,
 $\alpha$ the Kolmogorov constant and
 $\varepsilon$ the rate of viscous dissipation of specific TKE.
The inflow TI and integral length scale ( $L_\infty$) are obtained by tuning the two parameters (i.e.
 $\varepsilon$ and
 $L$.) in (2.5).
3. Case set-up
We consider three TIs and three integral length scales ( $L_\infty$) for the inflow, with two different permeable disk thrust coefficients (
 $C_T$), resulting in a total of 25 different cases, listed in table 1. The employed computational domain and the probes for collecting time series of velocities are shown in figure 1. The size of the computational is
 $L_{x}\times {L_{y}}\times {L_{z}} = 16D\times {8D}\times {8D}$ with the corresponding grid number
 $N_{x}\times {N_{y}}\times {N_{z}} = 256\times {128}\times {128}$, where
 $x, y$ and
 $z$ denote the streamwise, spanwise and vertical directions, respectively. A uniform mesh with
 ${\Delta }x = D/16$,
 ${\Delta }y = D/16$ and
 ${\Delta }z = D/16$ is employed.
Case set-up. The  $\checkmark$ and
 $\ast$ denote the simulated cases, in which detailed analyses are carried out for the former.

Schematic of the computational domain employed in the work and how the time series of velocity are extracted. The values are extracted for the marked dots.

The Courant–Friedrichs–Lewy number is 0.64. The permeable disk is located at  $3D$ downstream of the inlet plane. The periodic boundary condition is applied in the transverse directions. At the outlet, the Neumann boundary condition is employed. At the inlet, a uniform velocity is superposed with the velocity fluctuations generated using Mann's method.
Each case is run for 32 flow-throughs, including approximately one flow-through to achieve a fully developed state and approximately 31 flow-throughs for computing flow statistics. As the inflow velocity is uniform, there is no mechanism to maintain turbulence, then the turbulence decays in the downstream direction. To separate the inflow turbulence decay from the wake development, a simulation without a disk is conducted for each inflow. When calculating the flow statistics, the azimuthal averaging at four sampled points along the edge is further carried out whenever possible to increase the number of samples.
In addition to the dynamic model, the Smagorinsky model with  $C_S=0.1$ and the Lagrangian dynamic model (Meneveau, Lund & Cabot Reference Meneveau, Lund and Cabot1996) were tested. The results show (not shown in the paper) that the differences in the velocity deficit and the TKE predicted by the three subgrid scale models are negligible, which was also shown in the literature (Sarlak, Meneveau & Sørensen Reference Sarlak, Meneveau and Sørensen2015; Martinez-Tossas et al. Reference Martinez-Tossas, Churchfield, Yilmaz, Sarlak, Johnson, Sørensen, Meyers and Meneveau2018). The dependence of the predictions on grid resolution was also tested for
 $\Delta x = \Delta y = \Delta z = D/10$,
 $D/16$,
 $D/20$. The results show (not shown in the paper) that the velocity deficits and the wake-added TKE in the shear layer are not sensitive to the grid resolution. The TKE reduction in the very near wake, on the other hand, is observed being sensitive to the grid resolution for the lowest inflow TI cases. However, considering that the TKE reduction is not dominant for the low inflow TI cases, which is approximately two orders of magnitude lower for the
 $I_{\infty } = 2.5\,\%$ case in comparison with the
 $I_{\infty } = 25\,\%$ case. The employed grid resolution is considered to be adequate for the present study.
4. Results
In this section, we analyse the simulation results focusing on velocity deficits ( $\Delta {\bar {u}}$), wake-added TKE (
 $\Delta {k}$), premultiplied spectra of TKE (
 $\,f\varPhi _{k} = f(\varPhi _{u} + \varPhi _{v} + \varPhi _{w})$, where
 $\varPhi _{u}$,
 $\varPhi _{v}$ and
 $\varPhi _{w}$ are the power spectral densities (PSDs) of velocity fluctuations, and energy density in scale space. One particular focus of the analysis is on mean kinetic energy (MKE),
 $K_m$, and TKE,
 $k$, which are defined as
 \begin{align} K_m = \tfrac{1}{2}\left(\bar{u}^2 + \bar{v}^2 + \bar{w}^2\right), \end{align}
 \begin{align} k = \tfrac{1}{2}\left(\overline{{u^\prime}^2} + \overline{{v^\prime}^2} + \overline{{w^\prime}^2}\right), \end{align}
where  $\bar {{\cdot }}$ denotes the averaging in time. The velocity deficits and wake-added TKE are calculated relative to the velocity and TKE obtained from corresponding simulations without a disk. The
 $\Delta g$ is defined as
 $\Delta g = g_{{D}} -g_{{noD}}$ where
 $g_{{D}}$ and
 $g_{{noD}}$ are quantities from the cases with and without the permeable disk, respectively. The
 $\langle {\cdot } \rangle _D$ denotes the averaging over a circular disk of radius
 $R$.
The time-averaged thrust and power (i.e.  $\bar {T}$ and
 $\bar {P}$) are first examined in figure 2, which are normalized by the corresponding values from the case with uniform inflow (i.e.
 $T_0$ and
 $P_0$). As seen, the differences are less than 3 % and 2 % for
 $\bar {T}$ and
 $\bar {P}$, respectively, indicating that the impacts of variations in
 $\bar {T}$ and
 $\bar {P}$ on the wake dynamics are negligible. The instantaneous flow fields for several typical cases are demonstrated. Specifically, the snapshots at three consecutive instants are shown in figures 3 and 4 for varying inflow turbulence intensities and length scales, respectively. The mean streamwise velocity at the inlet is subtracted to show better the velocity fluctuations. A two-dimensional box filter of width
 $0.5D$ is employed to obtain the filtered streamwise velocity. The filtered velocity fluctuation fields from the cases with different inflow TIs are shown in figure 3. It is seen that the wake boundary is distorted at far wake locations (
 $5D$–
 $6D$ permeable disk downwind) for the low inflow TI case. When the inflow TI is high, on the other hand, intense interactions between the wake and the ambient flow happen right after the disk. It is observed in figure 4 that the interaction between the inflow turbulence and the wake depends on the inflow turbulence length scale: (i) when the inflow length scale is smaller (i.e.
 $L_{\infty }/D=0.5$), the wake is longer with its boundary distorted by the ambient turbulence; (ii) when the inflow length scale is larger (i.e.
 $L_{\infty }/D=1.5$), the wake is shorter and modulated as a whole by the inflow eddy with relatively smooth wake boundaries. Animations showing the temporal variations of the filtered instantaneous flow fields can be found in the supplemental files (Movie 1 and Movie 2) available at https://doi.org/10.1017/jfm.2024.876. The interaction between the inflow turbulence and the wake flow is further examined by analysing 12 400 snapshots using the snapshot proper orthogonal decomposition (POD) method (Sirovich Reference Sirovich1987).
(a) Normalized time-averaged thrust of the permeable disk. (b) Normalized time-averaged power of the permeable disk. The thrust coefficient  $C_T=0.7$.

Contours of filtered streamwise velocity fluctuations (the mean streamwise velocity at the inlet is subtracted) at three consecutive instants for different inflow TIs. Here (a i–iii)  $I_{\infty } = 2.5\,\%$; (b i–iii)
 $I_{\infty } = 25\,\%$ with the inflow length scale
 $L_{\infty }/D=1.0$ and the thrust coefficient
 $C_T=0.7$.

Contours of filtered streamwise velocity fluctuations (the mean streamwise velocity at the inlet is subtracted) at three consecutive instants for different inflow length scales. Here (a i–iii)  $L_{\infty } / D = 0.5$; (b i–iii)
 $L_{\infty } / D = 1.5$ with the inflow TI
 $I_{\infty }=10\,\%$ and the thrust coefficient
 $C_T=0.7$.

The first five POD modes for the cases with different inflow TIs and different inflow length scales are shown in figures 5 and 6, respectively. It is seen in figure 5 that the first five most energetic modes are mainly from the wake flow when inflow TI  $I_{\infty }=2.5\,\%$, while are dominated by the inflow turbulence when the inflow TI
 $I_{\infty }=25\,\%$. The inflow length scale affects the patterns of the dominant POD modes. For the same inflow TI, the intensity of the wake-induced POD patterns is greater than that of the ambient flow when the inflow length scale
 $L_{\infty }/D=0.5$, while it can be considered as perturbance to the inflow modes for the first three POD modes when the inflow length scale
 $L_{\infty }/D=1.5$. The POD results are consistent with the observations in the instantaneous flow fields (figures 3 and 4), providing another aspect on the qualitative understanding of the space–time characteristics of velocity fluctuations.
Contours of the first five POD modes of the filtered streamwise velocity normalized by  $U_{\infty }$ (the percentage in parentheses represents the proportion of modal energy). Panels (a–e) for
 $I_{\infty } = 2.5\,\%$, ( f–j) for
 $I_{\infty } = 25\,\%$ with the inflow length scale
 $L_{\infty } / D =1.0$ and the thrust coefficient
 $C_T=0.7$. The solid black lines represent the permeable disk.

Contours of the first five POD modes of the filtered streamwise velocity normalized by  $U_{\infty }$ (the percentage in parentheses represents the proportion of modal energy). Panels (a–e) for
 $L_{\infty } / D = 0.5$, ( f–j) for
 $L_{\infty } / D = 1.5$ with the inflow TI
 $I_{\infty } =10\,\%$ and the thrust coefficient
 $C_T=0.7$. The solid black lines represent the permeable disk.

Before systematically analysing the impacts of the inflow TI and integral length scale on the statistics of velocity fluctuations, the maximum TKE reduction (which appears in the immediate downstream of the disk) and wake-added TKE in the tip shear layer for the simulated cases are shown in figures 7(a) and 7(b), respectively, to show an overall picture of the interaction between the inflow turbulence and the wake flow. It is seen that the maximum TKE reduction increases when increasing  $L_{\infty }$ and
 $I_{\infty }$ of the inflow. The maximum wake-added TKE increases with the increase of
 $L_{\infty }$, while decreases with the increase of
 $I_{\infty }$. It should be noted that the variations of the maximum TKE deficit and the maximum TKE increase shown in the figure are not caused by the variations in thrust, which are less than 3 % (shown in figure 2) and cannot cause the considerable variations shown in figure 7.
Maximum disk-extracted TKE (a) and maximum wake-added TKE (b) along the wake centreline and the edge of the permeable disk, respectively, for various inflow turbulence intensities ( $I_{\infty }$) and integral length scales (
 $L_{\infty }$).

4.1. Influences of inflow TI
In this section, we examine the influence of inflow TI, which is of the same integral length scale ( $L_\infty$) of
 $1.0D$, on the energy conversion and wake statistics of a permeable disk.
4.1.1. Time-averaged flow statistics
When flow goes past a permeable disk, part of the inflow MKE, TKE and the potential energy in pressure are extracted. In the wake of the disk, the pressure restores, the MKE recovers and the TKE first increases and then decays. To investigate how inflow TI affects the above process, the downstream variations of the normalized temporal and disk-averaged (along wake centreline with radius of rotor radius  $R$) MKE difference
 $\langle \Delta {K_m}\rangle _D / U_{\infty }^2$, TKE difference
 $\langle \Delta {k}\rangle _D / U_{\infty }^2$ and pressure difference
 $\langle \Delta {\bar {p}}\rangle _D / U_{\infty }^2$ relative to the corresponding non-permeable disk case are plotted in figure 8 for the considered inflow turbulence intensities.
Time- and disk-averaged MKE difference  $\langle \Delta {K_m}\rangle _D / U_{\infty }^{2}$ (a i,ii), TKE difference
 $\langle \Delta {k}\rangle _D / U_{\infty }^{2}$ (b i,ii) and pressure difference
 $\langle \Delta {\bar {p}}\rangle _D$ (c i,ii). The dashed black line represents the zero reference line. Here
 $C_T= 0.2$ (solid lines) and
 $C_T= 0.7$ (dashed lines).

It is seen that the energy extracted by the permeable disk is mainly converted from MKE and potential energy in pressure, with a small percentage from TKE. With the increase of the inflow TI, the part converted from MKE decreases and the TKE part increases. It is interesting to notice that the pressure drops are almost the same for different inflow TIs for both  $C_T$. As expected, the MKE recovers at a faster rate for a higher inflow TI. As for
 $\langle \Delta {k}\rangle _D$, the position of the maximum peaks is located closer to the permeable disk for a higher inflow TI.
After showing the energy conversion process for different inflow TIs, in the following we examine the statistics of the mean wake. Figure 9 shows contours of the time-averaged streamwise velocity deficit ( $\Delta {\bar {u}}$) on the
 $x\unicode{x2013}y$ plane passing through the rotor centre. The downstream variations of the velocity deficit along the wake centreline are shown in figure 10 for the simulated cases. It is seen that the evolution of maximum velocity deficit approximately follows a power law starting from a certain disk downstream position. The inflow TI affects the starting position of flow recovery in the wake and the recovery rate, being closer to the disk and of a higher value for a higher inflow TI. An overall higher wake recovery rate is observed when
 $C_T$ is larger. This is because the momentum entrainment due to the wake shear layer is higher for a larger
 $C_T$, with that due to the ambient turbulence being the same.
Contours of time-averaged streamwise velocity deficits ( $\Delta {\bar {u}} / U_\infty$) in the spanwise plane passing through the permeable disk centre at
 $C_T=0.7$: (a)
 $I_\infty =2.5\,\%$; (b)
 $I_\infty =10\,\%$; (c)
 $I_\infty =25\,\%$. The solid black lines represent the permeable disk.

Streamwise variations of the streamwise velocity deficits along disk centreline for (a)  $C_T= 0.2$ (solid lines) and (b)
 $C_T= 0.7$ (dashed lines) for different inflow turbulence intensities. The solid (
 $\sim x^{-2/3}$) and dashed (
 $\sim x^{-2}$) black lines represent the two limit cases: (i) the ambient flow is non-turbulent, and the wake shear layer is the cause for flow recovery, and (ii) the wake is considered as a passive scalar with the ambient turbulence as the cause for flow recovery, respectively.

Figure 11 shows the variations of wake half-width ( $R_{1/2}$) along the downstream direction, which is defined as the distance from the wake centre where velocity deficit is half of the maximum value. As seen, the wake expands from a position closer to the permeable disk when the inflow TI is higher. A larger wake expansion rate is not observed for a higher inflow TI, possibly because the intensity of momentum entrainment is not always positively correlated with the inflow TI, as reported by Kankanwadi & Buxton (Reference Kankanwadi and Buxton2020). As for the effect of
 $C_T$, the wake's half-width is greater and the wake starts expansion earlier for
 $C_T=0.7$ when compared with
 $C_T=0.2$. To better understand the trends demonstrated in figures 10 and 11, the reference scaling from the two limiting cases, i.e. (i) the wake shear layer serves as the cause for the flow recovery, with the ambient flow being non-turbulent, and (ii) the wake considered as a passive scalar advected by the ambient turbulence are added. The scaling laws can be obtained using the dimensional analysis and the conservation of momentum (Lissaman Reference Lissaman1979; Schlichting & Gersten Reference Schlichting and Gersten2016). It is seen that the trends from the LES cases are located between the scaling laws from the two limit cases. The goodness of the fitting of the exponents for the velocity deficit and wake width is shown in Appendix A.
Streamwise variations of the time-averaged wake half-width  $R_{1/2}$ for different inflow turbulence intensities.
 $C_T= 0.2$, solid lines;
 $C_T= 0.7$, dashed lines. The solid (
 $\sim x^{1/3}$) and dashed (
 $\sim x$) black lines represent the two limit cases: (i) the ambient flow is non-turbulent, and the wake shear layer is the cause for flow recovery, and (i) the wake is considered as a passive scalar with the ambient turbulence as the cause for flow recovery, respectively.

To probe into the mechanism for flow recovery in the wake, various terms in the MKE budget equation are analysed as in the literature (Meyers & Meneveau Reference Meyers and Meneveau2013; Yang et al. Reference Yang, Howard, Guala and Sotiropoulos2015a; Cortina, Calaf & Cal Reference Cortina, Calaf and Cal2016; Ge et al. Reference Ge, Zhang, Meng and Ma2020). Specifically, the MKE budget equation integrated over the  $y\unicode{x2013}z$ plane is employed to analyse the variations of various terms in the downstream direction. The integration starts from
 $y_1 = y_c - R$ to
 $y_2 = y_c + R$ and
 $z_1 = z_c - R$ to
 $z_2 = z_c + R$ in the transverse directions, with
 $y_c$ and
 $z_c$ the coordinates of the wake centreline. The employed MKE budget equation is in the following form:
 \begin{align} &\underbrace{\int_{y_{1}}^{y_{2}} \int_{z_{1}}^{z_{2}}{\frac{\partial {\overline{u_{i}}}\,{\overline{u_{i}}} / 2}{\partial t}}{\,\mathrm{d}}y{\,\mathrm{d}}z}_{{=}0} = \int_{y_{1}}^{y_{2}} \int_{z_{1}}^{z_{2}} \left\{ \underbrace{-{\overline{u_{j}}} \frac{\partial {\overline{u_{i}}}\, \mathop{\overline{u_{i}}} / 2}{\partial x_{j}}}_{\text{ mean convection }(C_{m})} \right.\nonumber\\ &\qquad \underbrace{-\frac{\partial\left({\bar{p}} \,{\overline{u_{j}}} / \rho\right)}{\partial x_{j}} }_{\text{ pressure transport }(P_{t})} \underbrace{-\frac{\partial\left({\overline{u_{i}^{\prime} u_{j}^{\prime}}}\, {\overline{u_{i}}}\right)}{\partial x_{j}} }_{\text{ turbulence convection }(C_{t})} \underbrace{+2 \frac{\partial\left(v+v_{t}\right) S_{i j}\overline{u_{i}}}{\partial x_{j}}}_{\text{ diffusion }(D_{f})}\nonumber\\ &\qquad \underbrace{+ \overline{u_{i}^{\prime} u_{j}^{\prime}} \frac{\partial\overline{u_{i}}}{\partial x_{j}}}_{\text{turbulence production}(T_{p})} \left. \underbrace{-2\left(v+v_{t}\right) S_{i j} \frac{\partial \overline{u_{i}}}{\partial x_{j}} }_{\text{dissipation}(D_{p})} \underbrace{+ {{\overline{f_{i}}}\,{\overline{u_{i}}}}}_{W_D} \right\}{\,\mathrm{d}}y{\,\mathrm{d}}z. \end{align}
Since the considered case is statistically steady, the time derivative term on the left-hand side is zero after averaging the momentum equation in time. The various terms on the right-hand side are the mean convection ( $C_m$), pressure transport (
 $P_t$), turbulence convection (
 $C_t$), diffusion (
 $D_f$), turbulence production (
 $T_p$), dissipation (
 $D_p$) and the work done by the permeable disk (
 $W_D$) (Wu & Porté-Agel Reference Wu and Porté-Agel2012; Abkar & Porté-Agel Reference Abkar and Porté-Agel2015). The integration operation is included for various terms in the above equation in the presented results, although each term is labelled in the curly braces with the integration operation placed outside.
In figure 12, we focus on the analysis of the turbulence production ( $P_{t}$), pressure transport (
 $T_{p}$), turbulence convection (
 $C_{t}$) and mean convection (
 $C_{m}$) terms. The
 $W_D + \text {Res}$ term (
 $Res$ stands for residual) is shown in figure 12(e), which is negligible at most locations except near the disk where the magnitude of the
 $W_D$ term is large. It is seen that the inflow TI mainly affects the
 $P_{t}$,
 $C_{t}$ and
 $C_{m}$ terms, in a way that the magnitudes of the peaks become larger with the corresponding streamwise locations located closer to the disk for higher inflow TIs. The
 $T_{p}$ terms, on the other hand, are approximately the same for different inflow TIs. From the MKE analysis, it is clear that the faster recovery of MKE for higher inflow TI is achieved by allocating the region with a high
 $C_{t}$ term to near-wake locations and by enhancing the intensity of the
 $C_{t}$ term.
(a i,ii) Turbulence production ( $T_{p}$), (b i,ii) pressure transport (
 $P_{t}$), (c i,ii) turbulence convection (
 $C_{t}$), (d i,ii) mean convection (
 $C_{m}$) and (e i,ii)
 $W_D + \text {Res}$ terms in the MKE budget equation for different inflow TIs, in which subpanels (i) are for
 $C_T = 0.2$ (solid lines) and subpanels (ii) are for
 $C_T = 0.7$ (dashed lines). The MKE budget terms are normalized using
 $U_\infty$ and
 $D$.

After showing the downstream variation of MKE, in the following, we examine wake-added TKE ( $\Delta {k}$). In figure 13, we show contours of
 $\Delta {k}$ on the
 $x\unicode{x2013}y$ plane pass through the wake centreline. As seen, the TKE is increased along the wake edge because of the existence of the wake shear layer. With the increase of inflow TI, the location for the maximum
 $\Delta {k}$ is located closer to the disk, with its magnitude decreasing especially for TI from 10 % to 25 %. One important observation is that
 $\Delta {k}$ becomes negative in the near-wake region for high TIs, indicating that a part of TKE is extracted by the permeable disk. For
 $C_T=0.2$,
 $\Delta {k}$ is negative for a long range of wake when
 $I_\infty =25\,\%$. A quantitative comparison of
 $\Delta {k}$ is shown in figure 14 for the two values of
 $C_T$.
Contours of wake-added TKE ( $\Delta {k}$) on the
 $x\unicode{x2013}y$ plane passing through wake centreline for different inflow TIs: (a i,ii)
 $I_\infty =2.5\,\%$, (b i,ii)
 $I_\infty =10\,\%$, (c i,ii)
 $I_\infty =25\,\%$. The solid black lines represent the permeable disk. The black dots indicate the positions with the maximum wake-added TKE at the edge region of the permeable disk. Here solid lines,
 $C_T= 0.2$; dashed lines,
 $C_T= 0.7$.

Comparison of transverse profiles of wake-added TKE ( $\Delta {k}$) at various disk downstream locations for different inflow TIs for (a)
 $C_T= 0.2$ (solid lines), (b)
 $C_T= 0.7$ (dashed lines). The horizontal black dotted lines at
 $y/D = \pm 0.5$ are the tip locations.

4.1.2. Spectral analysis
To understand how turbulent fluctuations of different scales are affected by a permeable disk and its wake, we carry out spectral analysis in both frequency space and scale space. We first show the premultiplied spectra of TKE ( $\,f \varPhi _{k}$) along the edge of the disk to probe into how a disk adds turbulence to ambient flow in figure 15. The Strouhal number (
 $St$) is defined based on the disk diameter and the inflow wind speed. The most important observation is that the range of frequencies affected by a disk wake depends on the inflow TI, being wider for lower inflow TI. Specifically, a significant amount of TKE can be added to
 $St<2.0$,
 $St<1.5$ and
 $0.1< St<1.0$ for
 $I_\infty = 2.5\,\%$,
 $10\,\%$ and
 $25\,\%$, respectively. Dependence on
 $C_T$ is observed as well – that the disk becomes almost incapable of adding TKE to the wake when
 $C_T$ is small and the inflow TI is high.
Premultiplied PSD of TKE along disk edge at various disk downstream locations for different inflow TIs. Here (a)  $I_{\infty } = 2.5\,\%$; (b)
 $I_{\infty } = 10\,\%$; (c)
 $I_{\infty } = 25\,\%$. Here solid lines,
 $C_T= 0.2$; dashed lines,
 $C_T= 0.7$; grey lines, cases without a disk.

The premultiplied spectra of TKE ( $\,f \varPhi _{k}$) along the disk centreline are examined in figure 16. As expected, the downstream variations of
 $f \varPhi _{k}$ are different from that along the disk edge, because of the time taken for the shear layer around the edge to expand and meet at the centre. One focus here is to examine the range of frequencies at which TKE is extracted by the disk. It is observed from
 $f \varPhi _{k}$ at a
 $0.5D$ disk downstream that such TKE reduction mostly happens at relatively low frequencies with
 $St<0.15$ and relatively high frequencies with
 $St>1.5$, respectively.
Premultiplied PSD of TKE along wake centreline at various disk downstream locations for different inflow TIs. Here (a)  $I_{\infty } = 2.5\,\%$; (b)
 $I_{\infty } = 10\,\%$; (c)
 $I_{\infty } = 25\,\%$. Here solid lines,
 $C_T= 0.2$; dashed lines,
 $C_T= 0.7$; grey lines, cases without a disk.

After the examination of TKE variations in frequency space, we analyse how TKE of different scales is extracted by the disk and added by the wake by decomposing velocity fluctuations in scale space using the method proposed in our previous work (Zhang, Yang & He Reference Zhang, Yang and He2023). In the employed approach, the decomposition of velocity fluctuations in scale space is carried out using a sphere-averaged filter. In this study, the sphere-averaged filtering is conducted on the  $x\unicode{x2013}y$ plane at the disk centre, that the velocity fluctuations larger than and smaller than the filter scale (
 $s$), i.e.
 $u_{i}^{\prime, s>}$ and
 ${u}_{i}^{\prime, s<}$, are computed as follows:
 \begin{gather} {u}_{i}^{\prime, s>}(x, y) = {f}*u_{i}^{\prime}(x, y) = {\int}_{-\infty}^{+ \infty}{\int}_{-\infty}^{+ \infty}{{f}(x - x^{\prime}, y - y^{\prime})u_{i}^{\prime}(x^{\prime}, y^{\prime})\,\mathrm{d}\kern0.7pt x^{\prime}\,\mathrm{d} y^{\prime}}, \end{gather}
 \begin{gather} {u}_{i}^{\prime, s<}(x, y) = (1 - {f})*u_{i}^{\prime}(x, y) = u_i^{\prime}(x, y) - {u}_{i}^{\prime, s>}(x, y), \end{gather}
where  ${f}(r_{d}, s)$ is the kernel function defined as
 \begin{equation} {f}(r_{d}, s) = \frac{{\epsilon}\left(\dfrac{s}{2} - r_d\right)}{C_{d}s^{d}}, \end{equation}
in which  $r_{d} = \sqrt {{\sum _{i=1}^d}(x_i - x_i^{\prime })^2}$.
With the velocity decomposition in scale space, the corresponding energy density can be computed as follows:
 \begin{equation} E(x, s) ={-} \frac{{\partial} {Q}}{{\partial}s}, \end{equation}
where  ${Q} = \tfrac {1}{2} \langle {u}_{i}^{\prime, s>}{u}_{i}^{\prime, s>} \rangle$ is the TKE calculated using the filtered velocity fluctuations.
Since the inflow TKE decays in the downstream direction, we plot the energy density difference between the cases with and without a disk. Figure 17 shows the contours of energy density difference  $\Delta E$ on the
 $x\unicode{x2013}s$ plane for different inflow TIs. The extraction of TKE in the near wake is clearly demonstrated. At low inflow TI (i.e.
 $I_\infty =2.5\,\%$ for this work), no TKE extraction happens. For the two high inflow TIs (i.e.
 $I_\infty =10\,\%, 25\,\%$), similar patterns are observed indicating two types of TKE extraction. The first one is governed by the disk. The second one happens in the near wake as the pressure restores to the inflow level. The first one mainly happens at large scales, while the second one happens at a much wider range of scales. Increase in TKE occurs at farther downstream locations. It is seen that changing inflow TI influences the distribution of
 $\Delta E$ over
 $s$. For low inflow TI (e.g.
 $I_\infty =2.5\,\%$),
 $\Delta E$ is concentrated at small scales (e.g.
 $s/D<0.5$ for
 $I_\infty =2.5\,\%$), which is spread over a wide range of scales for high inflow TI (e.g.
 $s/D<1.5$ for
 $I_\infty =25\,\%$). One interesting observation is that, the TKE of large scales arrives the peak earlier than that of small scales, being consistent with the energy cascade process. The critical scale separating the large and small scales is approximately in the range of
 $0.3D$ to
 $0.6D$, being larger for
 $I_\infty =25\,\%$.
Contours of energy density difference  ${\Delta }E(x,s)$ on the
 $x\unicode{x2013}s$ plane for (a)
 $I_\infty = 2.5\,\%$, (b)
 $I_\infty = 10\,\%$ and (c)
 $I_\infty = 25\,\%$, respectively, for
 $C_T = 0.7$ and
 $L_\infty / D= 1.0$ cases. The white dashed line corresponds to 0.25 times of the maximum of TKE reduction. The black dashed line is the peak of energy density in the streamwise location for each scale. The vertical black dotted line indicates the permeable disk position.

The premultiplied energy density differences at various disk streamwise positions are examined in figure 18. It is seen that the disk is capable of extracting inflow TKE for scales greater than approximately  $0.5D$, with slight changes in the critical scale when the inflow TI increases from
 $10\,\%$ to
 $25\,\%$, and the peak is located around
 $2.0D$. The TKE added by the wake, on the other hand, is mainly located for scales less than
 $3D$, with slight decreases in the critical scale when the inflow TI increases from
 $2.5\,\%$ to
 $25\,\%$, and the peak is located around
 $1.0D$.
Premultiplied energy density difference ( ${\Delta }sE$) in scale space (
 $s$) at different streamwise locations for cases with different inflow TIs for (a)
 $I_{\infty } = 2.5\,\%$, (b)
 $I_{\infty } = 10\,\%$ and (c)
 $I_{\infty } = 25\,\%$ with
 $L_{\infty }=1.0D$ and
 $C_T=0.7$.

4.1.3. Quadrant analysis
The quadrant analysis (Wallace, Eckelmann & Brodkey Reference Wallace, Eckelmann and Brodkey1972; Wallace Reference Wallace2016) is carried out to probe into the influences of inflow on the interaction of wake with the ambient flow. The events in the four quadrants are outward interactions in quadrant 1 ( $Q1$), ejections in quadrant 2 (
 $Q2$), inward interactions in quadrant 3 (
 $Q3$) and sweeps in quadrant 4 (
 $Q4$). The ejection and sweep events in
 $Q2$ and
 $Q4$ (where velocity fluctuations in the streamwise and the radial directions are of opposite signs), represent the gradient-type motions, being the main contribution to the Reynolds shear stress,
 $\overline {u_a^{\prime }u_r^{\prime }}$ (where the subscripts
 ${{\cdot }}_a$ and
 ${{\cdot }}_r$ denote the axial and radial directions, respectively). They are often counteracted by the interaction quadrants in
 $Q1$ and
 $Q3$ (where velocity fluctuations in the two directions are of the same sign) for shear flows. The analyses are focused on their contributions to the Reynolds shear stress and are conducted for cases with and without the permeable disk, such that the wake effects can be examined. The contributions from the four quadrants to the Reynolds shear stress are denoted as
 $S_1$,
 $S_2$,
 $S_3$ and
 $S_4$ and are calculated according to (4.9). They correspond to events
 $Q1$,
 $Q2$,
 $Q3$ and
 $Q4$, respectively, with
 ${\Delta }S_1, {\Delta }S_2, {\Delta }S_3, {\Delta }S_4$ being the wake-added contributions. The
 ${\Delta }S_1, {\Delta }S_2, {\Delta }S_3, {\Delta }S_4$ are examined in two ways: (i) normalized using the incoming velocity for comparisons between various cases; (ii) normalized using
 $\sum _{i=1}^{4}{S_{i}}$ to show their relative contributions to the Reynolds shear stress as (4.9). The definitions for
 $S_i$ and
 $\Delta S_i$ are given as follows:
 \begin{equation} {S_{i} = \left(\overline{u_a^{\prime}u_r^{\prime}}\right)_i}, \end{equation}
where  $i=1,2,3,4$ for quadrants
 $Q_{1,2,3,4}$, respectively, and
 \begin{equation} {\Delta S_{i} = \left( S_{i} \right)_{D} - \left( S_{i} \right)_{noD},} \end{equation}
where the subscripts  ${D}$ and
 ${noD}$ are for the results with and without a disk, as defined.
The quadrant analysis results for cases with different inflow TIs are shown in figures 19 and 20. As seen in figure 19(i), all the four quadrants contribute positively to the Reynolds shear stress, being different from those observed in the wall-bounded turbulent flows for which the  $S_1$ and
 $S_3$ are negative. This is understandable because of the isotropic turbulent inflow, for which the four quadrants contribute equally. In figure 19(ii), it is seen that the
 $\Delta S_1$ and
 $\Delta S_3$ are negative, indicating that the wake reduces the
 $Q1$ and
 $Q3$ contributions to the Reynolds shear stress. Such reductions are greater in the near wake and increases with the increase in inflow TI. As expected, the wake enhances the ejections and sweeps in
 $Q2$ and
 $Q4$, making them the dominant events for the generation of Reynolds shear stress and the flow recovery in the wake. With the increase in inflow TI, the maximum of
 $\Delta S_2$ and
 $\Delta S_4$ increases, with the corresponding position moving upstream to the permeable disk. As for the relative contributions, it is seen that the relative contributions in
 $Q2$ and
 $Q4$ are comparable with each other, and their sum decreases with the increase in inflow TI.
Quadrant analysis for cases with different inflow TIs for (a i,b i,c i,d i) contributions in each quadrant ( $S_{i} / U_{\infty }^2$), (a ii,b ii,c ii,d ii) wake-added difference in each quadrant (
 $\Delta {S}_{i} / U_{\infty }^2$). The inflow integral length scale is
 $L_{\infty } / D = 1.0$. The thrust coefficient is
 $C_T = 0.7$.

(a–c) Wake-added relative contributions in each quadrant ( $\Delta {S}_{i} / \sum {\Delta {S}_{i}}$); (d) wake-added relative contributions in
 $Q1$ and
 $Q3$ events; (e) wake-added relative contributions in
 $Q2$ and
 $Q4$ events with different inflow TIs. The inflow integral length scale is
 $L_{\infty } / D = 1.0$. The thrust coefficient is
 $C_T = 0.7$.

4.2. Influences of inflow turbulence length scale
In this section, we investigate how inflow turbulence length scales affect the extraction of TKE by the disk and the addition of TKE by the wake. Simulation results from three integral length scales, i.e.  $L_\infty / D = 0.5$,
 $1.0$,
 $1.5$ are compared for two inflow TIs, i.e.
 $I_\infty = 10\,\%$ and
 $25\,\%$ and two thrust coefficients
 $C_T=0.2$ and
 $0.7$.
4.2.1. Time-averaged flow statistics
The time- and disk-averaged  $\langle \Delta {K_m}\rangle _D$,
 $\langle \Delta {k}\rangle _D$ and
 $\Delta P_D$ are first examined in figure 21. It is seen that the inflow turbulence length scale affects both the peaks and the corresponding positions of
 $\langle \Delta {K_m}\rangle _D$ and
 $\langle \Delta {k}\rangle _D$. Compared with inflow TI, the impacts of inflow
 $L_\infty$ are mainly found on the magnitudes of peaks. When increasing the inflow
 $L_\infty$, the maximum MKE reduction decreases, with the differences between cases with different
 $L_\infty$ more pronounced for higher inflow TI. The inflow turbulence length scale
 $L_\infty$ influences the TKE peaks in the other way, that the maximum TKE reduction and the maximum TKE addition increase with
 $L_\infty$. This is reasonable as the disk is more capable of extracting TKE at larger scales. Being the same as the observation for different inflow TIs, changing inflow
 $L_\infty$ does not affect the streamwise variation of pressure.
Time- and disk-averaged  $\langle \Delta {K_m}\rangle _D / U_{\infty }^{2}$ (a i–iv),
 $\langle \Delta {k}\rangle _D / U_{\infty }^{2}$ (b i–iv) and
 $\Delta {P_D}$ (c i–iv), with (a i,ii,b i,ii,c i,ii) for
 $I_\infty =10\,\%$ and (a iii,iv,b iii,iv,c iii,iv) for
 $I_\infty = 25\,\%$, respectively. The dashed black line represents the disk position. Here solid lines,
 $C_T= 0.2$; dashed lines,
 $C_T= 0.7$.

The downstream evolution of mean wake is examined in this part.
Figure 22 displays the contours of time-averaged streamwise velocity deficit ( $\Delta {\bar {u}}$) contours on the
 $x\unicode{x2013}y$ plane passing through the wake centreline. It is seen that the streamwise velocity in flow in the wake recovers faster when the inflow
 $L_\infty$ is larger.
Contours of time-averaged streamwise velocity deficits ( $\Delta {\bar {u}}$) for different inflow integral length scales for (a)
 $L_\infty / D = 0.5$, (b)
 $L_\infty / D = 1.0$ and (c)
 $L_\infty / D = 1.5$, respectively, with
 $I_\infty =10\,\%$ and
 $C_T=0.7$. The solid black lines represent the permeable disk.

Figure 23 shows the streamwise velocity deficit along wake centreline for different inflow turbulence length scales. It is seen that the inflow  $L_\infty$ affects both the location where the velocity starts to recover and the recovery rate, especially the recovery rate. The inflow turbulence TI, on other hand, mainly affects the starting position of velocity recovery as demonstrated in § 4.1. A monotonic trend of the velocity recovery rate with the inflow TI is not observed for the wake half-width (figure 11). With the increase of
 $L_\infty$, on the other hand, a monotonic increase in the velocity recovery rate is observed.
Variations of streamwise velocity deficits ( $\Delta {\bar {u}}$) along wake centreline for different inflow turbulence length scales for (a i,ii)
 $I_\infty = 10\,\%$ and (b i,ii)
 $I_\infty = 25\,\%$, respectively. Here solid lines,
 $C_T= 0.2$; dashed lines,
 $C_T= 0.7$. The solid (
 $\sim x^{-2/3}$) and dashed (
 $\sim x^{-2}$) black lines represent the two limit cases: the ambient flow is non-turbulent, and the wake shear layer is the cause for flow recovery, and the wake is considered as a passive scalar with the ambient turbulence as the cause for flow recovery, respectively.

The wake half-width ( $R_{1/2} / D$) is examined in figure 24. It is seen that the wake starts expansion at a location closer to the disk and expands at a higher rate when the inflow
 $L_\infty$ is larger. When increasing
 $C_T$, the wake half-width becomes larger for low inflow
 $L_\infty$. Comparing the impacts of the two inflow statistics shows that the inflow TI mainly affects the starting position for wake expansion, while the inflow
 $L_\infty$ mainly affects the expansion rate. The wake recovery rate and the expansion rate vary with integral scale and TI, but both fall within the scaling ranges of the two models (George Reference George1989; Stein & Kaltenbach Reference Stein and Kaltenbach2019).
Streamwise variations of the time-averaged wake half-width  $R_{1/2}$ for different inflow turbulence length scales for (a)
 $I_\infty = 10\,\%$, (b)
 $I_\infty = 25\,\%$, respectively. Here solid lines,
 $C_T= 0.2$; dashed lines,
 $C_T= 0.7$. The solid (
 $\sim x^{1/3}$) and dashed (
 ${\sim }x$) black lines represent the two limit cases: (i) the ambient flow is non-turbulent, and the wake shear layer is the cause for flow recovery, and (ii) the wake is considered as a passive scalar with the ambient turbulence as the cause for flow recovery, respectively.

The dominant terms in the MKE budget equation are analysed in figure 25 to probe into the influence of inflow turbulence length scale  $L_\infty$ on MKE transport. It is seen that changing
 $L_\infty$ mainly influences
 $P_{t}$,
 $C_{t}$ and
 $C_{m}$ terms, with negligible impacts on the
 $T_{p}$ term, being consistent with changing inflow TI. Increasing inflow turbulence length scale increases the production of turbulence and enhances the MKE transport due to turbulence. Although changing
 $L_\infty$ affects the locations of the peaks of the
 $P_{t}$,
 $C_{t}$ and
 $C_{m}$ terms, it mainly impacts their magnitude when compared with results with different inflow TIs. The
 $W_D + Res$ term has virtually no impact downstream of the permeable disk.
(a i,ii, f i,ii) Turbulence production ( $T_{p}$), (b i,ii,g i,ii) pressure transport (
 $P_{t}$), (c i,ii,h i,ii) turbulence convection (
 $C_{t}$), (d i,ii,i i,ii) mean convection (
 $C_{m}$) and (e i,ii, j i,ii). The
 $W_D + {\rm Res}$ terms of the MKE budget equation for different incoming integral length scales for subpanels (i)
 $I_\infty = 10\,\%$ and subpanels (ii)
 $I_\infty = 25\,\%$. Panels (a–e) with solid lines,
 $C_T = 0.2$; ( f–j) with dashed lines,
 $C_T = 0.7$. The MKE budget terms are normalized using
 $U_\infty$ and
 $D$.

In the following, we investigate the effects of inflow turbulence length scales on the wake-added TKE ( $\Delta {k}$). Figure 26 shows the contours of
 $\Delta {k}$ on the
 $x\unicode{x2013}y$ plane passing through the wake centreline. Figure 27 shows the transverse profiles of
 $\Delta {k}$ at various downstream locations from the disk. It is seen that increasing the inflow turbulence length scale
 $L_\infty$ increases the TKE extracted by the disk and the TKE added by the wake, with the corresponding maximum locations closer to the disk.
Contours of wake-added TKE ( $\Delta {k}$) on the
 $x\unicode{x2013}y$ plane passing through the wake centreline for different inflow turbulence length scales for (a i,ii)
 $I_\infty =10\,\%$ and (b i,ii)
 $I_\infty =25\,\%$, respectively. The solid black lines represent the permeable disk. The black dots indicate the positions with the maximum wake-added TKE at the edge region of the permeable disk. Here solid lines,
 $C_T= 0.2$; dashed lines,
 $C_T= 0.7$.

Transverse profiles of wake-added TKE ( $\Delta {k}$) at different disk downstream locations for different inflow turbulence length scales for (a i,ii)
 $I_\infty = 10\,\%$ and (b i,ii)
 $I_\infty = 25\,\%$, respectively. The horizontal black dotted lines at
 $y/D = \pm 0.5$ denote the tip locations. Here solid lines,
 $C_T= 0.2$; dashed lines,
 $C_T= 0.7$.

4.2.2. Spectral analysis
In this section, we investigate how inflow turbulence length scale ( $L_\infty$) affects the TKE extraction by the disk and the TKE addition by wake by carrying out spectral analysis.
We first examine the premultiplied PSD of TKE ( $\,f \varPhi _{k}$) along the disk edge in figures 28 and 29 for inflow
 $I_\infty =10\,\%, 25\,\%$, respectively, to examine how inflow
 $L_\infty$ affects wake-added TKE. It is seen in figure 28 for
 $I_\infty =10\,\%$ that the wake cannot only add TKE to frequencies less than a critical one, which is approximately
 $St=1.5$ for
 $L_\infty / D = 0.5$ and becomes
 $St=2.5$ for
 $L_\infty / D = 1.5$. Further increasing inflow TI not only affects the intensity of wake-added TKE, but also the range of frequencies being affected, which becomes much narrower (around
 $0.1< St<1.0$), especially for high inflow
 $L_\infty$ (e.g.
 $L_\infty / D = 1.0, 1.5$). When the inflow TI is high (i.e.
 $I_\infty =25\,\%$), the ambient turbulence dominates. For relatively low inflow TI (i.e.
 $I_\infty =10\,\%$), the ambient turbulence and the wake-added turbulence competes. When the peak of
 $f \varPhi _{k}$ is in the range of
 $St\in (0.1,1)$ (i.e.
 $L_\infty / D = 1.0$), the wake amplifies the peak. When the peak of
 $f \varPhi _{k}$ is not within the range (on the right-hand side for
 $L_\infty / D = 0.5$, while on the left-hand side for
 $L_\infty / D = 1.5$), the wake relocates the peak (to the left-hand side for
 $L_\infty / D = 0.5$, while to the right-hand side for
 $L_\infty / D = 1.5$), with a larger relocation observed when the inflow
 $L_\infty$ is smaller (i.e.
 $L_\infty / D = 0.5$) (for which the wake is more capable of changing because of the overall energy cascade direction).
Premultiplied PSD of TKE at streamwise locations along the disk edge for different inflow length scales with inflow  $I_{\infty } = 10\,\%$: (a)
 $L_\infty /D = 0.5$; (b)
 $L_\infty / D = 1.0$; (c)
 $L_\infty / D = 1.5$. Here solid lines,
 $C_T= 0.2$; dashed lines:
 $C_T= 0.7$. The grey lines represent the data for background flow.

Premultiplied PSD of TKE at streamwise locations along the disk edge for different inflow length scales with inflow  $I_\infty = 25\,\%$: (a)
 $L_\infty /D = 0.5$; (b)
 $L_\infty / D = 1.0$; (c)
 $L_\infty / D = 1.5$. Here solid lines,
 $C_T= 0.2$; dashed lines,
 $C_T= 0.7$. The grey lines represent the data for background flow.

We then examine how inflow turbulence length scale affects the disk in extracting inflow TKE in figure 30, which shows  $f \varPhi _{k}$ at
 $0.5D$ disk downstream and the wake centreline. It is seen that the disk is capable of extracting TKE at higher frequencies (i.e. around
 $St>1.5$) for all three inflow turbulence length scales. It is capable of extracting TKE at lower frequencies (i.e.
 $St<0.15$), however, it depends on the inflow turbulence length scale. For small inflow
 $L_\infty$ (i.e.
 $L_\infty / D = 0.5$), the energy at lower frequencies barely changes. For large inflow
 $L_\infty$ (i.e.
 $L_\infty / D = 1.5$), on the other hand, a significant amount of energy at lower frequencies is extracted by the disk. The TKE extraction at medium frequencies (i.e.
 $0.1< St<1.0$) is negligible for all the inflow turbulence length scales.
Premultiplied PSD of TKE at  $0.5D$ disk downstream and wake centreline for different inflow length scales with inflow
 $I_\infty = 10, 25\,\%$: (a,d)
 $L_\infty / D = 0.5$; (b,e)
 $L_\infty / D = 1.0$; (c, f)
 $L_\infty / D = 1.5$. Here solid lines,
 $C_T= 0.2$; dashed lines,
 $C_T= 0.7$. The grey lines represent the data for background flow.

The TKE extraction at the disk and the TKE generation in the wake are influenced in scale space by inflow turbulence length scales ( $L_\infty$) which are examined in figure 31, which shows the energy density difference
 $\Delta E$ on the
 $x\unicode{x2013}s$ plane for different inflow
 $L_\infty$. As seen, changing the inflow
 $L_\infty$ does not change the overall energy distribution, but influences the extents of energy extraction and addition, which are greater with the maximum
 $\Delta E$ located closer to the disk when the inflow
 $L_\infty$ is larger. Figure 32 shows the curves of premultiplied energy density difference
 $\Delta (sE)$ at several streamwise locations. The impact of inflow turbulence length scale (
 $L_\infty$) is demonstrated more clearly. It is seen that changing the inflow
 $L_\infty$ does not influence the shape of the
 $\Delta (sE)$ distribution with the peak for TKE extraction and TKE addition located at approximately
 $s=2.0D$ and
 $s=1.0D$, respectively, and the starting scale with energy extraction around
 $s=0.5D$. The major effect of increasing inflow
 $L_\infty$ is on the enhancement of TKE extraction and addition.
Contours of energy density difference  ${\Delta }E(x,s)$ on the
 $x\unicode{x2013}s$ plane for (a)
 $L_\infty / D = 0.5$, (b)
 $L_\infty / D = 1.0$ and (c)
 $L_\infty / D = 1.5$ with
 $I_\infty =10\,\%$ and
 $C_T=0.7$. The white dashed line corresponds to 0.25 times the maximum TKE loss value. The black dashed line is the peak of energy density in the streamwise location for each scale. The vertical black dotted line indicates the location of permeable disk.

Premultiplied energy density difference ( ${\Delta }sE$) in scale space (
 $s$) at different streamwise locations for (a)
 $L_\infty / D = 0.5$, (b)
 $L_\infty / D = 1.0$ and (c)
 $L_\infty / D = 1.5$ with
 $I_\infty = 10\,\%$ and
 $C_T=0.7$.

4.2.3. Quadrant analysis
The quadrant analysis results from the cases with different inflow length scales are shown in figures 33 and 34. Impacts of the wake on the quadrant contributions similar to the cases with varying inflow TI are observed, that the intensities of the events are enhanced in quadrants  $Q2$ and
 $Q4$, while are weakened in
 $Q1$ and
 $Q3$, making
 $S_2$ and
 $S_4$ dominant over
 $S_1$ and
 $S_3$. Moreover, it is seen that the reductions in
 $Q1$ and
 $Q3$ events (i.e.
 $\Delta S_1$ and
 $\Delta S_3$) and the enhancements in
 $Q2$ and
 $Q4$ events (i.e.
 $\Delta S_2$ and
 $\Delta S_3$) are larger at
 $x/D\sim 1.0$ and
 $x/D \sim 3.0$, respectively, and increase with the inflow integral length scale
 $L_{\infty }$. Two differences can be identified for the effects of inflow
 $L_{\infty }$ and
 $I_{\infty }$: (i) varying
 $I_{\infty }$ affects the locations of wake-induced
 $\Delta S_j(j=1 - 4)$, while varying
 $L_{\infty }$ mainly affects the magnitude; (ii) varying
 $I_{\infty }$ affects the relative contributions from
 $Q2$ and
 $Q4$ events, while varying
 $L_{\infty }$ barely does.
Quadrant analysis for cases with different inflow length scales for (a i,b i,c i,d i) contributions in each quadrant ( $S_{i} / U_{\infty }^2$), (a ii,b ii,c ii,d ii) wake-added difference in each quadrant (
 $\Delta {S}_{i} / U_{\infty }^2$). The inflow integral TI is
 $I_{\infty } = 10\,\%$. The thrust coefficient is
 $C_T = 0.7$.

(a–c) Wake-added relative contributions in each quadrant ( $\Delta {S}_{i} / \sum {\Delta {S}_{i}}$), (d) wake-added relative contributions in
 $Q1$ and
 $Q3$ events and (e) wake-added relative contributions in
 $Q2$ and
 $Q4$ events with different inflow length scales. The inflow integral TI is
 $I_{\infty } = 10\,\%$. The thrust coefficient is
 $C_T = 0.7$.

5. Conclusions
In this work, we systematically investigated how the inflow TI,  $I_\infty$, and integral length scale,
 $L_\infty$, affect the flow recovery in the wake, the capability of a permeable disk in extracting inflow TKE and the statistics of wake-added TKE using LES. Various turbulent inflows were considered, including turbulence intensities from
 $I_\infty =2.5\,\%$ to
 $25\,\%$ with integral length scales from
 $L_\infty / D = 0.5$ to
 $2.0$. The thrust coefficient is
 $C_T=0.7$ for most inflows, and
 $C_T=0.2$ for some inflows.
The simulation results show that the inflow turbulence affects flow recovery in the wake in two aspects, i.e. the location where the wake flow starts to recover and the rate at which it recovers. Both inflow TI and length scale affect the two aspects, with the former playing a more important role in affecting the starting location and the latter mainly affecting the recovery rate. Specifically, it was found that increasing inflow TI promotes the wake to recover at locations close to the disk, and increasing the inflow length scale increases the wake recovery rate. Quadrant analyses were carried out. It was shown that the ejections and sweeps in the quadrant  $Q2$ and
 $Q4$ are enhanced because of the disk wake, making the two the dominant factors for wake recovery and turbulence generation. Increasing inflow TI and integral length scale increase the magnitudes of enhancements of the
 $Q2$ and
 $Q4$ events, with the former relocating the maximum enhancement location towards the disk.
A permeable disk can extract a part of TKE of the incoming flow. The simulation results show that the extent of TKE extraction and the frequencies and scales at which the TKE is extracted depends on both the inflow TI and turbulence length scale. It was found that increasing the inflow TI and length scale increases the maximum TKE extraction. The range of frequencies for TKE extraction mainly depends on the inflow length scale: at higher frequencies with  $St>1.5$ for small inflow length scale (
 $L_\infty / D= 0.5$); at both higher frequencies with
 $St>1.5$ and lower frequencies with
 $St<0.15$ for medium inflow length scale (
 $L_\infty / D = 1.0$); and at lower frequencies with
 $St<0.15$ for larger inflow length scale (
 $L_\infty / D = 1.5)$. The spectral analysis in scale space showed that the TKE extraction happens at larger scales with
 $s>0.5D$ with peak located around
 $s=2.0D$, with an exception that it occurs at almost all scales for the high inflow TI case with
 $I_\infty =25\,\%$.
The shear layer in the wake adds TKE to the wake flow. The simulation results show that both inflow TI and turbulence length scale affect the intensity of wake-added TKE and the location for the maximum wake-added TKE. Specifically, it was found that increasing inflow TI and turbulence length scale promotes the maximum wake-added TKE to occur at locations close to the disk. As for the intensity of wake-added TKE, a higher inflow TI (e.g.  $I_\infty =25\,\%$) results in a lower TKE increase, while a larger inflow turbulence length scale (e.g.
 $L_\infty / D =1.5$) is correlated with a higher TKE increase. The range of frequencies at which the wake can add TKE is mainly affected by the inflow TI, which is wide for low inflow TI (e.g.
 $St<2.0$ for
 $I_\infty =2.5\,\%$) and narrow for high inflow TI (e.g.
 $0.1< St<1.0$ for
 $I_\infty =25\,\%$). The inflow turbulence length scale, on the other hand, can affect the dominant frequency. When the dominant frequency of the inflow turbulence is not in the range of
 $0.1< St<1.0$ (i.e.
 $L_\infty / D = 0.5, 1.5$), the wake-added turbulence will attempt to allocate the peak to the mentioned range. Spectral analysis in scale space showed similar distributions of wake-added premultiplied energy density with the maximum around
 $s=1.0D$ independent of inflow TI and turbulence length scale.
Neglecting the effect of wind shear simplifies the analysis, in the meantime, it is also a limitation of this study. Further in-depth spatiotemporal turbulence analyses (He, Jin & Yang Reference He, Jin and Yang2017) carefully accounting for the effects from wind shear are necessary. The complex impacts of inflow turbulence on wake statistics pose challenges to Reynolds-averaged Navier–Stokes models (Zehtabiyan-Rezaie & Abkar Reference Zehtabiyan-Rezaie and Abkar2024), that further development to account for such effects is necessary.
Supplementary movies
Supplementary movies are available at https://doi.org/10.1017/jfm.2024.876.
Funding
This work was supported by NSFC Basic Science Center Program for ‘Multiscale Problems in Nonlinear Mechanics’ (no. 11988102), the Strategic Priority Research Program, Chinese Academy of Sciences (CAS) (no. XDB0620102), National Natural Science Foundation of China (nos. 12172360 and 12202453) and the CAS Project for Young Scientists in Basic Research (YSBR-087).
Declaration of interests
The authors report no conflict of interest.
Appendix A
The optimize.curve_fit() function in Python was employed for curve fitting. The range of disk downstream positions employed for curve fitting is shown in tables 2 and 3. The R-square (i.e.  $R^2$) is employed to measure the goodness of fit, which is in the following form:
 \begin{equation} R^2 = 1 - \frac{\sum_{i=0}^n (y_{i} - \hat{y})^{2}}{\sum_{i=0}^n (y_{i} - \bar{y})^{2}}, \end{equation}
where  $y$ represents the data to be fitted with the mean value denoted
 $\bar {y}$, the fitted data
 $\hat {y}$, and
 $n$ the size of the data. As seen in the tables, the value of
 $R^2$ is greater than 0.97 for all the considered cases.
The  $R^2$ for velocity deficit fitting: the data from
 $3D$ to
 $10D$ permeable disk downwind positions are employed for fitting.

The  $R^2$ for wake half-width fitting: the data from
 $3D$ to
 $10D$ permeable disk downwind positions are employed for fitting except for the
 $I_{\infty }=2.5\,\%$ case, for which the starting position is
 $6D$.



