




No CrossRef data available.
Economic Growth and Institutions: Some Sensitivity Analyses, 1961–2000
Published online by Cambridge University Press: 01 July 2004
Abstract
Do institutions help explain macroeconomic performance? This article addresses two issues. First, especially given the practical implications of the literature, measurement of institutions should avoid tautologies, and therefore this study uses econometrics to estimate the effect of objectively measurable institutions such as labor market organization, financial development, fiscal federalism, and political regime-type. Second, the growing literature on these promising factors, in turn, is unfortunately incommensurable because previous studies fail to control for other institutional and, in some cases, standard economic variables. Given data on up to ninety-four countries from 1961 through 2000, extreme-bound analysis (EBA), an econometric technique that addresses the sensitivity of previous findings to alternative assumptions about model specification, suggests that some institutions associated with the organization of labor and capital are robust correlates of investment. Few data support the view that variables related to the organization of the state, including fiscal federalism and political regime-type, affect macroeconomic performance.Without implication, the author thanks Richard Nelson, Doug Chalmers, Robert Shapiro, Alessandra Casella, Brendan O'Flaherty, Geoffrey Garrett, Alexander Hicks, Brett Hammond, Mark Kesselman, the editor (Lisa Martin), and two anonymous referees for helpful comments. Also, Ross Levine, Peter Rousseau, Geoffrey Garrett, and Torben Iversen were very helpful in locating data. The views expressed in this article do not necessarily reflect those of the Board of Governors of the Federal Reserve System or any member of its staff.
Information
- Type
- Research Article
- Information
- Copyright
- © 2004 The IO Foundation and Cambridge University Press
Do certain economic and political “institutions” promote growth and investment? North and Thomas perhaps were the first to argue that efficient economic organization is a necessary prerequisite for growth, and therefore the study of comparative economic performance reduces to explaining the emergence of favorable institutions.1
Despite subsequent criticisms of their interpretation of economic history circa 1500,2See Field 1981.
This study addresses two issues in this burgeoning literature: the general measurement of institutions as an independent variable and the estimation of the effect of institutions in econometric models. With respect to measurement, few political scientists and economists doubt that “institutions” potentially affect macroeconomic performance. But, the challenge is to avoid tautologies and to render testable propositions that maintain policy relevance and address whether constitutional framers can successfully craft nascent or amend existing states disposed to desirable macroeconomic performance. Of course, measurement of any independent variable should be as objective, reliable, and valid as possible, but perhaps the profound practical implications of this literature make this issue even more pressing. This article draws on a broad literature from economic history, development economics, as well as comparative and international political economy and considers quantitative measures of labor market organization, financial development, fiscal federalism, and political regime-type.
With respect to estimation, this broad literature, in turn, is largely incommensurable because several studies that consider institutions omit other relevant organizational variables and, in some notable cases, mainstream economic controls. For example, the comparative and international political economy literature on labor union organization and partisan alignment largely ignores macroeconomic variables as well as previous studies on the organization of capital. These studies, in turn, do not control for the political science literature on labor market institutions. Also, no social scientist statistically tests persuasive ideas about measures of fiscal federalism, and studies of the effect of political regime-type generally ignore other possible institutional determinants. Such incommensurability profoundly weakens contributions from political scientists and economists alike. Previous results might simply be spurious, and one therefore cannot identify which particular institutions, if any, affect macroeconomic performance.
This specification bias seems curious given the contributions of Hall, widely cited among students of comparative and international political economy.3
He suggests a framework for the study of macroeconomic policymaking and performance that comprehensively refers to the organizations of labor, capital, and the state. Therefore, in some sense this study comprises an econometric application of Hall's framework and more generally addresses Brunetti's call for more commensurable research vis-à-vis neoclassical as well as organizational factors.4Brunetti 1997a and 1997b.
Given the sensitivity analyses, few robust results emerge from the data. In fact, the empirical results largely suggest that measures associated with the organization of the state, including fiscal federalism and political regime-type, are not significant. But, some measures of the organization of capital and labor are robust to EBA decision rules, especially with respect to investment. Also, previous literature suggests that most economic variables in general are not robust to any EBA inference criterion, and an institutional approach to the study of growth remains quite promising.
Measurement of “Institutions”
“Institutions” broadly refer to formal rules that maintain (or vitiate) established property rights, “the rules of the game.”5
This comparatively narrow definition does not include “path dependency” (history) or “informal rules” (political culture). See North (1990) for a discussion of these expansive meanings.
As the following section outlines in more detail, this study endeavors to assess objectively measurable institutions that shape monetary and fiscal policymaking. Hall identifies some of these institutions in a comprehensive framework in his qualitative study of economic policymaking and performance in France, the United Kingdom, and West Germany.7
Briefly, he advances an institutional approach to explain economic policymaking and (more tacitly) performance, and his list of factors that influence policymaking identify some objectively testable institutions that might account for divergent patterns of macroeconomic performance. For instance, key institutional factors include the “organization of labor,” which describes how the working class is organized vis-à-vis unions and confederations, and the organization of capital, which refers to the structural relationship between businesses and key sources of finance, from stock markets to banks. Another factor, the “organization of the state,” refers to the bodies that perform legislative, executive, and judicial functions. While the precise jargon differs across disciplines, economists also refer to these general concepts. For example, Krugman refers to the key components of the “American model” of capitalism, which notably include flexible labor markets and a financial system that forces companies to adjust rapidly to private capital markets.8These institutions are germane to the practical implications of the debate. Despite some resistance to econometrics among economic historians, political scientists, and Hall himself,9
For a response to Hall's general critique (Hall 1986, 260) of econometric methods, see Durham 1998, 190–93.
These measures notably contrast sharply with survey data on entrepreneurial perceptions to capture the relative efficiency of institutions. Survey-based measures of “country risk” include the International Country Risk Guide (ICRG), the Borner et al. survey,10
Business Environment Risk Intelligence (BERI), or Institutional Investor's country credit ratings. In general, these measures evaluate whether business leaders perceive fewer unexpected legal changes (expropriation risk) and have confidence in new laws that purport to bolster private property rights. Stable property rights, by extension, promote economic expansion. Using these measures, Knack and Keefer and Borner et al. find that the perception of stable property rights explains more variance than standard neoclassical growth regressions.11See Knack and Keefer 1995; and Borner et al. 1995.
Brunetti 1997a and 1997b.
But both the reliability and validity of these subjective proxies for property rights stability are questionable. Regarding reliability, what criteria respondents use in their assessments are inherently unclear and vary considerably over time.13
See Erb et al. 1996, 30; and Ferson and Harvey 1997, 1640.
Institutional Determinants
This section outlines each institutional variable used in this study and discusses whether the literature produces testable propositions, whether the underlying measures satisfactorily capture the hypothesis, and whether previous studies adequately control for competing explanations.
The Organization of Labor: The Social Democratic Corporatist Model
The comparative and international political economy literature produces evidence that labor market institutions and government partisanship affect growth and investment directly. With respect to application, policy entrepreneurs can advance or discourage labor market centralization with respect to individual trade unions and aggregate confederations.
The social democratic corporatist (SDC) model broadly follows Bruno and Sachs's for more research on the structure of labor markets in industrial economies,14
and Garrett and Lange argue that centralized and dense unions enable a beneficial dynamic between unions themselves, employers' associations, and government.15Garrett and Lange 1985. See also Garrett and Lange 1986; Alvarez et al. 1991; Headey 1970; and Hicks 1994.
Some strands of this literature also suggest that the interaction between unions and government partisanship also matters. In contrast to, for example, a scenario with strong labor organization and Left control of government, some argue that countries with relatively weak labor movements combined with governments of the Right can still pursue their preferred macroeconomic objectives and achieve beneficial outcomes.17
See Alvarez et al. 1991.
See Crafts 1992. Suboptimal combinations include a government of the Right and a strong labor movement or a government of the Left and a weak labor movement. In these situations, trade unions less willingly show wage restraint and are more apt to behave militantly given a confrontational partisan government.
This study replicates the basic SDC model, which follows

where Y is some indicator for macroeconomic performance for country i over period j, C is an ordinal measure of labor union centralization; P is an ordinal index of partisanship, and C × P is an interaction term. This study uses three alternative measures of C, including Iversen's labor centralization index, Alvarez et al.'s labor organization index, and the wage bargaining index, an equally weighted additive index of Golden et al.'s measures of confederation and government involvement and the overall bargaining level of wage setting.19
See Iversen 1998; Alvarez et al. 1991; and Golden et al. 2002.
See Henisz 2002. The second partisan measure notably only proxies for the partisan coherence between branches of government and not the nature of political partisanship, and therefore regressions that use this measure do not include an interaction term.
Several studies report empirical regularities between SDC variables and macroeconomic outcomes.21
For example, see Garrett and Lange 1985 and 1986; Alvarez et al. 1991; Hicks and Swank 1992; and Hicks 1994.
Alvarez et al. 1991, 546.
A few notable examples include Kormendi and Meguire 1985; Grier and Tullock 1989; and Barro 1996.
The Organization of Capital: Stock Market and Banking System Development
Some economists and political scientists argue that the organization of the financial system, with a particular focus on whether businesses finance enterprises through local capital markets or banks, directly affects macroeconomic performance.24
For example, see Levine and Zervos 1998; Levine 1997; and Hall 1986.
The relative development of the equity market or banking system can considerably affect the monetary transmission mechanism. For example, Tobin's q is more relevant in economies with more developed stock markets, and the “credit channel” is more germane given large banking sectors.
There is considerable debate about the effects of the stock market on the economy. Proponents argue that because potentially profitable investments require extensive long-run capital commitments, liquid equity markets lessen this obstacle because investors can quickly and inexpensively sell equities, and simultaneously, firms have additional access to capital from equity issues, which lowers the transaction costs of supply and demand for savings mobilization. Also, stock markets promote timely acquisition of information about individual firms via share prices,26
and stock prices discipline corporate bosses and ameliorate the principal-agent problem between managers and owners.27Detractors suggest that greater liquidity reduces saving rates through income and substitution effects. Some also believe that while greater stock market liquidity makes investment more attractive to risk-adverse investors, less uncertainty also lowers the demand for precautionary savings. Further, instead of inducing managerial discipline, liquid equity markets encourage investor myopia, as investors sell poorly performing equities in the short-run without regard for long-term firm or industry interests. For example, Crafts argues that a relatively high level of hostile takeover activity in the United Kingdom encourages “short-termism.”28
Most econometric evidence supports the former view. For example, Levine and Zervos find a significant and robust correlation between an aggregate index for stock market development and growth, controlling for the general development of the financial system.29
Using the index components separately, they find that stock market liquidity and bank development, but not market size, correlate positively with long-run growth, and they suggest that stock markets and banks provide distinct financial functions. However, Durham finds that the link between stock markets and growth is robust only if the sample includes higher-income countries.30This study proposes no innovations with respect to measures of stock market or banking system development but broadly follows previous studies with separate inclusion of relative market size, turnover, and domestic credit to gross domestic product (gdp). stock market size to gdp refers to the ratio of the total value of all shares (market capitalization) divided by GDP. stock market turnover captures liquidity and is the proportion of the total value of all trades relative to market capitalization. domestic credit to gdp is total value of all domestic credit provided by private sector divided by GDP.
While this literature satisfactorily controls for other determinants of growth, these studies notably do not consider the organizations of labor or the state. Also, some political scientists and economists argue that financial system development and macroeconomic performance are perhaps simultaneously determined. Economic growth and stock prices likely correlate positively over a given (panel) averaging period, although the correlation between growth and the ratio of market capitalization to GDP depends on the relative change in the denominator vis-à-vis the numerator.31
Moreover, financial asset prices in general partially reflect expectations for future economic growth.
The Organization of the State: Fiscal Federalism
Fiscal federalism addresses the “credible commitment problem”—the fundamental dilemma that a government strong enough to protect property rights is also strong enough to confiscate the private wealth.33
The decentralization of political power alleviates this conundrum because political competition among jurisdictions limits the ability of any one state to impose inefficient regulation. Weingast argues that federalism enhanced the economic development of Britain and the United States,34Ibid.
But although theoretically intriguing, “market preserving” federalism transcends formal constitutional issues. The critical element to the success of federalism is a mix of formal and informal constraints. The informal component refers to societal beliefs that federal binding limits are fundamental to the polity.36
Formal constitutional constraints are not sufficient; informal constraints, attitudes, and beliefs must supplement them. Bernholz questions how such attitudes originate and persist; but more important for these purposes,37 Weingast's inclusion of both formal and informal constraints entangles federalism, the independent variable, and a “market preserving” outcome, the dependent variable. Therefore, he states no testable proposition.This study uses three measures of federalism to evaluate falsifiable versions of Weingast's hypothesis. First, as some studies suggest, one useful approximation of fiscal federalism includes the fraction of total revenues collected and total expenditures allocated by the national government,38
See Lijphart 1984; Oates 1972; Casella and Frey 1992; and Kee 1977.

where Rl is local government revenue, and Rc is central government revenue.39
See Appendix 3 for all data sources.
Of course, this measurement has shortcomings, and measuring the slippery concept of sovereignty between national and subnational governments is inherently difficult. One anticipated issue is the existence of multiple subnational governments, which may be large regional governments, smaller local ones, or combinations of both. The simple fraction of national to total government revenues and expenditures misses this distinction. But Weingast and others emphasize constraints on national sovereigns, not the relative power of additional subnational governments. Similarly, the debate on growth focuses on central government officials. Local governments are therefore a residual category, and the national policymaker is constrained insofar as decisions are delegated to some subnational authority.40
Another issue is that these ratios do not capture resource transfers between national and subnational governments. Such transfers are not distinguishable between provisional grants, which might suggest little de facto discretion vis-à-vis national government, and unconditional grants, which might indeed suggest considerable discretion. But there is large cross-sectional evidence that suggests that fractions of national to total government revenue and expenditure vary with gross sums of transfers. Oates 1972, 199, writes that each of the three alternative measures of centralization, including intergovernment grants, correlates significantly and robustly with the percentage share of the national government in total revenues. Thus, the extent of government activity in taxation and expenditure is “surely a component of fundamental importance in determining its influence on the allocation of resources.” Oates 1972, 197.
The second measure related to fiscal federalism regards the mismatch between spending and taxation levels, the “federal spending gap.” In some cases, spending is decentralized while taxation remains the domain of central governments. According to Garrett, such gaps between spending and revenue encourage fiscal irresponsibility and therefore poor macroeconomic performance. The proxy is local spending less local revenues divided by total government revenues, as in

where El is local expenditure, Rl is local revenue, and Rc is central revenue. Rather than the relative size constraints on central government fiscal authority, which Equation (2) proxies, Equation (3) attempts to capture the efficiency of local government vis-à-vis the overall magnitude of government involvement in the economy.
The third measure, the sub-federal entities, is the least precise proxy and is not only dichotomous but also somewhat subjective, as Henisz codes cases as federal when local institutions “impose substantive constraints on national fiscal policy.”41
But the variable is perhaps nonetheless quite useful, and data are available for a considerably greater number of panel observations.The Organization of the State: Political Regime-Type
An extensive literature addresses whether dictatorships or democracies grow faster. Authoritarian regimes are by definition not susceptible to the political business cycle, as democratic governments that wish to continue governing must assuage popular demands for spending and consumption. On the other hand, democracies, which limit sovereign discretion, more effectively promote economic growth and ameliorate the “credible commitment problem.” Democracies check arbitrary rule and thereby preserve established property rights.42
For example, see Scully 1988. Note the clear contention that institutions shape perceptions—investors do not commit scarce resources to “unstable” economies in which sovereigns can arbitrarily change the rules of the game.
This debate focuses on the utility of executive discretion or freedom of action. That is, sovereigns should either have discretion to pursue myopically unpopular yet eventually benevolent policies, or political procedures and institutions should restrain them from kleptocratic policies. As argued elsewhere,43
See Durham 1998 and 1999; and Henisz 2002.
Therefore, this study uses three continuous measures of political regime-type, which usefully distinguish among dictatorships and democracies. The first two proxies are based on the number of effective political parties and draw on Alesina et al.'s discussion of the potential importance of majority versus coalition governments in the context of the political business cycle, as coalition potentially constrain partisan and opportunistic aims.44
The first measure is the number of parties in the legislature, NL, defined as
where pl is the share of parliamentary seats held by the ith political party, and n is the total number of legislative parties. The second measure, the “effective party/constitutional framework” (ep/cf) measure, adjusts NL for “mutually dependent” and “exclusively dependent” presidential democracies consistent with Stepan and Skach and follows

where NE is the number of effective political parties in the executive branch and is equal to one.45
See Stepan and Skach 1993 for the classification of subtypes of democracies. Durham finds that ep/cf correlates positively with economic growth in a sample of high-income countries. See Durham 1999.
The third continuous measure of political regime-type is Henisz's political constraint index.46
Henisz 2000 and 2002.
The econometric evidence in previous studies is largely inconclusive, but the debate notably focuses on a measurable institution that shapes policymaking and thereby conceivably affects performance. Similar to studies on stock market development, this literature largely satisfactorily controls for standard economic variables but notably omits other potentially important institutional variables.47
For example, see Barro 1996; and Durham 1999.
Specification Bias and EBA
Again, in addition to measuring institutions independently from outcomes, a critical problem in the literature is the failure to satisfactorily control for competing explanations with respect to either economic or other institutional variables. In theory, the simplest remedy is to include all relevant variables in a single model, as the partial regression coefficient for a given variable of interest represents its estimated effect, ceteris paribus. However, this simple solution is not necessarily feasible with respect to economic growth. The literature simply produces too many potential correlates,48
For example, Sala-i-Martin 1997a and 1997b counts up to fifty-eight possible variables.
The Mechanics of EBA
Therefore, this article simultaneously considers several regression models to address specification bias. Specifically, this article uses EBA, which illustrates the sensitivity of a given statistical relation to different assumptions about the composition of the remainder of the econometric model. That is, EBA evaluates the robustness of a statistical inference to changes in specification, and the underlying regressions generally follow

where Y is the dependent variable, z is the “doubtful” independent variable of interest, f is the set of “free” variables that always appears in the regressions, and x ∈ χ is a set of three variables taken from the pool χ of N remaining doubtful independent variables.49
The size of x is of course arbitrary, but previous applications of EBA to growth include three variables from χ in x.
This study uses three decision rules given the estimation of all possible regressions. The “traditional decision rule” is the most stringent.50
Essentially, z must be statistically significant in every M specification for the doubtful variable to pass as “robust.” More formally, the lower bound of the estimates is the lowest value of
and the upper bound is the greatest value of

among all M regressions to evaluate z. If the lower extreme bound for z is negative and the upper extreme bound is positive, then z is fragile. (Columns 2 and 3 in Tables 1, 2, 3, and 4 list the lower and upper bounds for each doubtful variable, and Column 4 shows the proportion of the M regressions that produce significant estimates of z.)
EBA: Random-effects growth regressions—unbalanced panels

EBA: Random-effects investment regressions—unbalanced panels

EBA: Random-effects growth regressions—balanced panels, thirteen countries, 1976–2000

EBA: random-effects investment regressions—balanced panels, thirteen countries, 1976–2000

The remaining criteria are more lenient but not necessarily less valid. The second criterion, the “R2 decision rule,” follows Granger and Uhlig, who note that the R2s will likely vary among the underlying regressions and that the particular models that produce the upper and lower bounds might have comparatively low R2s.51
Again, if the sign of βz changes or becomes insignificant in only one of the M regressions, then z is fragile under the traditional criterion, and Granger and Uhlig argue that only “superior” specifications should inform the extreme bounds estimates—researchers should choose the upper and lower extreme bounds from a subset of the M models within a certain range of the equation(s) that most closely fits the data. Of course, the particular choice of ranges and the “bad R2” distinction are somewhat arbitrary, but this study follows convention and considers estimates from models among the M equations that produce R2s within 90 percent of the highest R2 among the M regressions. Given the resulting subset of models with comparatively superior fit, the upper and lower bounds must have the same sign or z is fragile. (Column 5 in Tables 1, 2, 3, and 4 show the fraction of regressions with comparatively high R2s that produce significant estimates of z.)The third EBA criterion, the “CDF decision rule,” similarly considers the overall fit of the underlying regressions explicitly but still allows all M regressions to inform the extreme bounds. For example, Sala-i-Martin analyzes the entire distribution of M estimates and uses the weighted means of βz and σz derived from the underlying regressions to compute the cumulative distribution function (CDF).52
Sala-i-Martin 1997a and 1997b.

where wzj is the weight, as in

Sala-i-Martin calculates the CDF, a confidence level, for each z, and again following convention, the decision rule for a robust result is that the CDF is ≥0.95. Tables 1, 2, 3, and 4 include two calculations of the CDF. Column 6 lists the CDF that follows the standard normal distribution. Column 7 lists the nonnormal CDF, which follows

which is the weighted sum of the individual (normal) CDFs for each βzj from the M regressions. Sala-i-Martin notes that the significance levels under the alternative assumptions are virtually identical.53
Sala-i-Martin 1997a and 1997b, 181. The CDF decision rule is somewhat less instructive with respect to these panel data. Given the greater number of doubtful regressors (fifty-eight versus up to fifteen in this study), Sala-i-Martin must estimate a far greater number of estimations (58! ÷ [55! × 3!]), 30,856. Compared to the 455 (M) regressions per doubtful variable using the most comprehensive χ set in this study, the likelihood of a single arrant coefficient, which would violate the traditional EBA decision rule, is considerably greater in his design.
Previous Applications of EBA
Researchers have applied EBA to development, monetary, and financial economics. Notably, the literature on each of these empirical questions produces too many possible correlates to include in a single regression equation. With respect to growth, the literature reports dozens of statistically significant correlates, and such incommensurability has precipitated extensive sensitivity analysis. For example, Levine and Renelt find that the investment ratio was robust to the traditional decision rule, and Sala-i-Martin finds that more variables are robust following the CDF criterion.54
See Levine and Renelt 1992; and Sala-i-Martin 1997a and 1997b, respectively.
Durham 2000 and 2001.
In general, EBA provides some useful insight into the sensitivity of previous findings to alternative model assumptions. The study of the effect of institutions on economic growth should not be any less rigorous. Given that the study of economic growth is clearly an interdisciplinary question, tests of the effects of institutions on growth should exhaustively control for other economic determinants to ensure that the results are commensurable with previous studies across the social sciences.
Data and Research Design
Following several studies,57
For example, see Grier and Tullock 1989.
Each panel regression is spatially dominant, with more cases than time periods.
As Levine and Renelt (1992) note, scholars commonly conflate the growth process and advance certain growth determinants that relate more intuitively to investment. Indeed, the SDC literature seems to address resource accumulation more directly than growth. To repeat, wage restraint purportedly limits consumption in favor of investment.
Education data are from Barro and Lee 2000.
Therefore, there are up to eight dummy variables in each regression for the 1961–65, 1966–70, 1971–75, 1976–80, 1981–85, 1986–90, 1991–95, and 1996–2000 averaging periods.
The eleven economic variables in χ include average government spending to GDP, average trade to GDP, a dummy variable for landlocked countries, absolute latitude, initial population, average inflation, the standard deviation of inflation, average consumption to GDP, the initial proportion of the population under eighteen and over sixty-five years of age, the standard deviation of real per capita GDP growth, and a dummy variable for British legal heritage.62
This application includes as many doubtful variables as possible. Levine and Renelt 1992 and Sala-i-Martin 1997a and 1997b examine at least fifty variables in χ, which is clearly greater than the number in this study. But, closer examination of their variables indicates considerable redundancy. For example, Sala-i-Martin includes approximately five different proxies for political instability, six measures of school enrollment, and regional dummy variables separately. This application considers one proxy for each concept.
Of course, a robust correlate should be insensitive to both economic and institutional controls. But given data limitations, the EBA summarized in Tables 1 and 2 that includes only these eleven economic controls in χ is perhaps also noteworthy. With eleven variables in χ and three variables in x for each model, 165 possible regressions inform the EBA estimates for Tables 1 and 2.63
The number of necessary regressions follows

Tables 3 and 4 summarize a more comprehensive EBA with both economic and institutional variables in χ for two different samples. The 1976–2000 sample includes the eleven economic variables in χ as well as the sub-federal entities dummy variable, stock market size to gdp, the wage bargaining index, and the ep/cf measure. Unfortunately, comparatively few country-averaging periods have data on all variables in f and χ, and this more comprehensive EBA is confined to thirteen high-income countries—including Australia, Austria, Belgium, Canada, Denmark, France, Germany, Italy, Japan, Sweden, Switzerland, the United Kingdom, and the United States. The panel is balanced, and the thirteen cases and five averaging periods produce sixty-five observations per regression. With three variables in x and fifteen variables in χ, there are 455 underlying regressions for the 1976–2000 sample.64
The number of necessary regressions follows

The 1966–90 sample includes the eleven economic variables in χ as well as the sub-federal entities dummy variable, domestic credit to gdp, the three SDC variables from Alvarez et al. (simultaneously), and the ep/cf measure. This EBA covers thirteen high-income countries—including Austria, Belgium, Canada, Denmark, France, Finland, Italy, Japan, the Netherlands, Norway, Sweden, the United Kingdom, and the United States. The panel is also balanced with sixty-five observations per regression, and with three variables in x and fourteen variables in χ, there are 364 underlying regressions for the 1966–90 sample.65
The number of necessary regressions follows:

However limited to thirteen cases over a twenty-five-year sample, these more comprehensive tests are preferable. Indeed, Hall discusses the importance of the organizations of labor, capital, and the state simultaneously,66
and any econometric test that omits one of these institutional variables would be inherently unsatisfactory.Random- Versus Fixed-Effects Panel Regressions
There is some debate about whether fixed or random-effects panel regressions are appropriate, although most studies seem to use random-effects estimation. For example, Knack and Keefer argue that because survey-based institutional variables generally do not vary much over time, their findings would be insignificant using fixed-effects estimation.67
Knack and Keefer 1995, 215.
Application of the specification test in Hausman 1978 suggests that the difference in coefficient estimates from fixed- and random-effects growth regressions (that include the variables in f) are not statistically significant from zero for any institutional variable. Results are available on request from the author.
A Note on Multicollinearity and EBA
EBA understandably elicits some concern with multicollinearity,69
Leamer argues that the complaint that EBA “does not deal with serial correlation, nonnormality, etcetera, is quite irrelevant …. [I]t is hardly reasonable to complain that brain surgery can't cure a hangnail.” See Leamer 1983, 312. That said, EBA certainly does not preclude and is easily amenable to simple regression diagnostics, such as the use of VIFs.
Following Goldberger, multicollinearity ultimately reflects the fact that there are insufficient data to produce statistically significant relations among a set of imperfectly collinear variables. See Goldberger 1991. The problem is secondary to satisfactory specification—multicollinearity is not a sufficient excuse for ignoring competing factors. The correlation matrices in Appendix 1 are also informative in the context of multicollinearity.
To address this issue, this article refers to the summary statistics of the variance inflation factor (VIF) of the underlying models.71
The VIF is equal to

where R2 is based on

For example, see Belsley et al. 1980.
Econometric Results
The Organization of Labor: The SDC Model
The EBA evaluates four alternative expressions of the SDC model. The first is Iversen's labor centralization index, for which there are sixty-four observations—sixteen countries for various averaging periods from 1976–95—in each of the 165 underlying regressions in Tables 1 and 2. In general, the data do not seem to suggest a robust correlation with either growth or investment. For example, Table 1, Column 1, indicates that the weighted coefficient is negative, and its magnitude implies about a 0.19 percentage point difference in growth between the highest index value, Denmark in 1976, compared to the lowest values, Canada and the United States for each year in the sample.73
Figures 1 and 2 graphically illustrate these predicted values based on the EBA-weighted coefficients and minimum and maximum sample values for each variable. (Solid bars in the histogram additionally indicate whether the variable passes an EBA criterion.)
The second expression of SDC model follows Alvarez et al. and simultaneously includes the labor organization index, the partisan scale, and the interaction between the two. The underlying regressions include sixty-nine observations, given data on fourteen countries for various averaging periods from 1966–90. As Table 1 indicates, consistent with the hypothesis, the weighted coefficient for the labor organization index implies about a 0.19 percentage point increase in growth from the lowest value, France in 1986, to the highest value, Austria in 1966. Also, the weighted coefficient for the interaction term suggests about a 0.92 percentage point increase from the lowest value, France in 1981, to the highest value, France in 1966. But, the partisan scale suggests that more leftist participation in government slows growth. The weighted estimate implies a predicted 0.45 percentage point decrease in growth from the most leftist participation, Austria in 1976, to the least, Canada in 1986. However, the extreme bounds for all three SDC variables have the opposite sign, and none of the 165 regressions produce a statistically significant result. Therefore, the SDC model of growth fails each EBA criterion.
As Table 2 indicates, the weighted coefficients for the investment regressions are partially consistent with the hypothesis. The estimate of the partisan scale is positive and implies a predicted 2.22 percent increase in investment from the least to the most leftist participation. Also, the interaction term is positive and suggests a 4.37 percentage point increase in investment given the extreme values of the interaction term. But, contrary to the hypothesis, the labor organization index produces a negative weighted coefficient that implies about a 0.72 percentage point decrease in investment across the lowest and highest values for the index. But, neither estimate for the labor organization index or the partisan scale are robust to any EBA decision rule, as only 0.6 and 26.1 percent of the regressions, respectively, produce significant estimates.74
The corresponding fixed-effects EBA indicates that the partisan scale passes the CDF decision rule.
The more comprehensive EBA in Tables 3 and 4 that includes other institutional variables also produces some robust results for investment but not growth using the 1966–90 sample. For example, the weighted coefficients for the growth regressions, listed in Table 3, suggest that more centralized labor union organization and greater leftist participation in government deter economic growth. The coefficients imply about a 0.44 and a 0.62 percentage point discrepancy in growth, respectively, between the extreme values in the sample. But, the weighted coefficient for the interaction term is positive and suggests an approximate 0.25 percentage point difference in growth between the minimum and maximum values. However, none of the 364 underlying growth regressions produces significant estimates, and all of the variables are fragile to EBA.
Similar to the results in Table 2, the expanded EBA produces more robust results with respect to investment. As Table 4 indicates, the weighted coefficient for the labor organization index and the partisan scale are negative and positive, respectively, but neither variable is robust to any EBA decision rule. The estimate for the partisan scale implies about a 2.72 percentage point increase in investment for the least to the most leftist participation in government in the sample. But the variable is robust in only about 48.4 percent of the underlying regressions, is insignificant in every regression with comparatively high R2 values and also fails the CDF criterion.75
The corresponding fixed-effects EBA of expanded variables indicates that the partisan scale is robust to the CDF decision rule.
The third proxy for the SDC model is the wage bargaining index, for which there are 122 observations—sixteen countries for variables periods during 1961–2000—per underlying regression in Tables 1 and 2. Table 1 indicates that the weighted coefficient implies that growth decreases by about 0.80 percentage points from the highest value, Belgium in 1981, to the lowest value for the index, the United Kingdom in 1996. But, the lower and upper bounds of the estimate have the opposite sign.76
As column 4 in Table 1 indicates, the wage bargaining index is the only institutional variable that produces a significant estimate in any underlying growth regression, although no regression that includes total population produces a significant estimate.
Notably, multicollinearity does not seem to affect the results—although mean t statistics (2.045 versus 1.189) seem greater for regressions with comparatively lower VIFs, the mean VIF for the 165 regressions is only 1.432.
The expanded EBA covering 1976–2000 that includes other institutional variables produces more robust results, and the findings notably contradict one component of the SDC hypothesis. For example, Table 3 indicates that the weighted coefficient is negative, and the minimum and maximum values imply about a 0.88 percentage point discrepancy in growth. The estimate is significant in 41.1 percent of the 455 underlying regressions, but of the models with comparatively high R2 values, only 8.7 percent produce significant results. Also, while the estimate is robust to the CDF decision rule assuming a normally distributed CDF, none of the corresponding underlying fixed-effects regressions produce a statistically significant estimate.78
The corresponding fixed-effects EBA is available on request from the author.
The investment regressions suggest that more flexible labor markets promote capital accumulation, as the weighted coefficient for the wage bargaining index in Table 4 suggests that the range of values in the sample implies about a 2.26 percentage point discrepancy in investment. The extreme bounds of the estimate have the opposite sign, and none of the regressions with comparatively high R2 value produces robust results, but the measure does pass the CDF criterion under the assumption of normality. (The corresponding fixed-effects EBA produces a similar result.) Interestingly, this result somewhat contradicts the findings with the SDC specification in Alvarez et al., which generally suggests that greater labor centralization (that is, less flexibility) promotes investment.
The final variable under the general SDC rubric is the partisan alignment dummy variable for partisan alignment between the executive branch and all legislative houses. The underlying regressions include 682 observations for ninety-three countries for various averaging periods from 1961–2000. As Table 1 indicates, the weighted coefficient suggests that countries grow about 0.20 percent faster on average if the same political party occupies both the executive and legislative branches. But, none of the regressions produce statistically significant estimates, and the variable is fragile according to EBA. Also, the weighted coefficient for the investment regressions, listed in Table 2, curiously suggests that partisan alignment deters capital accumulation, as the estimates suggest that countries with partisan alignment have investment ratios that are about 0.44 percentage points lower on average. But again, no regression produces a statistically significant estimate, and the variable is clearly fragile to EBA.
The expanded EBA for 1976–2000 similarly produces no robust results. For example, the weighted coefficient in Table 3 for the growth regressions suggest that countries grow about 0.28 percentage points faster with partisan alignment, but none of the underlying 455 regressions are statistically significant, and the estimate is therefore fragile to EBA. Also, according to Table 4, the investment regressions produce a weighted coefficient that implies about a 1.35 percentage point boost from partisan alignment, but the upper and lower bounds have opposite signs, and only 0.77 percent of the regressions with comparatively high R2 values produce significant results.79
Also, none of the regressions that include absolute latitude produce significant results.
The Organization of Capital
The EBA considers three measures of financial development. First, data are available for eighty-three countries for various averaging periods during 1976–2000 for stock market size to gdp, and the 165 underlying regressions have 340 panel observations. Table 1 suggests that stock market development reduces growth. The weighted coefficient implies that the difference between the largest stock market in the sample, Malaysia in 1996 at 306.58 percent of GDP, and a nonexistent stock market, germane to twenty-seven countries over various averaging periods, corresponds to about a 1.08 percentage point decrease in growth. But, as Column 4 indicates, none of the regressions produce statistically significant estimates, and all EBA criteria suggest that the result is fragile. But, the results suggest a more sturdy relation between relative stock market size and investment. In fact, Table 2 indicates that the weighted coefficient is positive, and the magnitude of the estimate implies a predicted 4.63 percentage point discrepancy between the largest and the smallest stock market in the sample. The result is not robust to either the traditional or R2 criteria, as the upper and lower bounds have opposite signs, and only about 48.9 percent of the models with comparatively high R2 values produce significant estimates. Also, the inclusion of the trade ratio seems particularly problematic for relative stock market size, as none of the underlying regressions that include this variable produce a significant result.80
At 1.275, the mean VIF indicates that multicollinearity is not a serious problem with the estimates, although the mean t statistic (2.054) from regressions with VIFs below the mean is considerably higher than the mean (1.254) for those with VIFs above the mean.
Given the corresponding fixed-effects EBA, relative stock market size is robust to both the R2 and CDF decision rules.
Considering the more comprehensive EBA, the weighted coefficient for stock market size to gdp in Table 3 is positive and suggests a predicted 1.20 percentage point difference in growth between the largest stock market, the United Kingdom in 1996 with a market capitalization of 147.53 percent of GDP, and the smallest stock market, Austria in 1981 with a market capitalization of 2.4 percent of GDP. However, the extreme bounds have opposite signs, and this result is only statistically significant in about 36.3 percent of the 455 underlying regressions. The variables in χ that are particularly problematic for relative stock market size include population size, the dummy variable for British legal heritage, and the wage bargaining index, as only 1.10, 2.20, and 8.79 percent, respectively, of the models that include these regressors produce significant estimates. In addition, among the models with comparatively high R2 values, only 8.7 percent produce significant estimates. Multicollinearity does not seem to be an issue with the results for either the traditional or R2 decision rules. The mean t statistic (1.945) from regressions with VIFs below the mean is somewhat higher than that (1.624) from models with VIFs above the mean, but the mean VIF for the 455 regressions is only 2.264. However, the variable does pass the CDF decision rule, at least according to the weighted normal measure (Column 7).82
The result that the coefficient for growth is negative in Table 1 and positive (and robust to the CDF decision rule) in Table 3 is largely consistent with the results in Durham 2002 that significant positive results for stock market size to GDP are sensitive to the including of lower income countries in the sample.
With respect to investment, the weighted coefficient in Table 4 suggests that relative stock market size has a benevolent effect. The magnitude of the estimate suggests that the predicted investment ratio is about 3.94 percentage points greater for the largest compared to the smallest stock market in the sample. But, given that the lower and upper bounds have opposite signs, the estimate is not robust to the traditional EBA decision rule. Approximately 79.6 percent of the 455 regressions produce significant estimates, and the variables in χ that seem most problematic including the age dependency and consumption ratios—about 34 and 54 percent, respectively, of the regressions that include these factors produce significant results. Also, among the regressions with comparative high R2 values, none produces a significant estimate, but, at least according to the weighted normal CDF, the estimates pass the CDF criterion.83
The corresponding fixed-effects EBA produces more robust results, as relative stock market size pass both the R2 and CDF decision rules with respect to investment.
With respect to the second measure, stock market turnover, data are available for eighty-one countries for various averaging periods during 1976–2000, and the 165 underlying regressions have 327 observations. The weighted coefficient in Table 1 suggests that stock market turnover correlates positively with growth. The difference between the greatest turnover, China in 1996 with 329.03 percent, and the twenty-seven countries with zero turnover implies about a 1.51 percentage point increase in growth. However, none of the 165 growth regressions produce a statistically significant estimate, and the variable does not pass any EBA decision rule. But, the investment regressions suggest that stock market turnover has a comparatively robust effect. As Table 2 indicates, the weighted coefficient implies a predicted 7.93 percentage point increase in investment between the highest and lowest levels of turnover. Moreover, the variable is largely insensitive to specification bias. The estimate narrowly misses the extreme decision rule, as only one of the 165 regressions, the model that includes the government, consumption, and age dependency ratios in x, produces extreme bounds with opposite signs. But, this particular model is not among those that fit the data comparatively well, and all the estimates among the subset of regressions with comparatively high R2 values are statistically significant, and thus the estimate passes the R2 decision rule. Also, each CDF is above 0.95, which suggests that the result is robust.84
Data limitations prohibit a more comprehensive EBA for stock market turnover.
Considerably more data are available for the third measure of financial development, domestic credit to gdp, and the underlying regressions include 661 observations from ninety-four countries across various averaging periods during 1961–2000. Table 1 indicates that the weighted coefficient is marginally positive, and the estimate suggests a gap in growth of about 0.03 percentage points between the highest ratio, Japan in 1996 with 202.88 percent, and the lowest ratio, Zaire in 1991 with 0.72 percent. However, none of the growth regressions produce significant estimates, and the result is not robust to any EBA decision rule. But, the credit ratio is comparatively sturdy in the investment regressions. The weighted coefficient in Table 2 suggests a predicted 8.21 percentage point difference in investment between the extreme sample values, and notably, as Columns 2 and 3 indicate, both the upper and lower bounds are positive. Therefore, the variable passes the traditional EBA criterion as well as the R2 and CDF tests. The result, however, is somewhat sensitive to random versus fixed-effects estimation. Given a fixed-effects EBA, domestic credit to gdp only pass the CDF decision rule and is only significant in half of the regression with comparatively high R2s. But in short, similar to relative stock market size and stock market turnover, the credit ratio seems to have a robust effect on investment but not growth.
Tables 3 and 4 report the results for domestic credit to gdp in the more comprehensive EBA using the 1966–90 sample. Table 3 indicates that the weighted coefficient is negative in the growth regressions. According to the estimate, the difference between the highest ratio, Japan in 1986 at 156.12 percent, and the lowest ratio, Belgium in 1976 at 5.22 percent, implies about a 1.05 percentage point discrepancy in growth. However, the extreme bounds have opposite signs, and the estimate narrowly fails the R2 decision rule. Moreover, each CDF is below 0.95.85
The corresponding fixed-effects EBA suggests that the domestic credit to gdp passes the CDF decision rule.
The investment regressions in Table 4 are somewhat consistent with Table 2. That is, the weighted coefficient suggests that the credit ratio has a positive effect, as the estimate implies a predicted 5.18 percentage point difference in investment between the extreme sample values. The lower and upper bounds do not have the same sign, and only 51.6 percent of the 364 regressions and only 16.67 percent of the regressions that include the sub-federal entities dummy variable produce statistically significant estimates. Also, none of the regressions with R2s within 90 percent of the highest R2 produce a significant estimate, but the variable is robust to the CDF decision rule, at least assuming a normal CDF.
In general, with the exception of the robust finding for relative stock market size in Table 3 using the 1976–2000 sample, the results suggest that measures for the organization of capital generally have a more statistically significant effect on investment as opposed to growth. That is, well-developed stock markets and domestic banking systems facilitate the accumulation as opposed to the efficient allocation of capital. However, similar to other institutional variables such as the SDC factors, a robust link between the organization of capital and investment implies an indirect effect on growth, given the strong correlation between investment ratios and growth rates.86
Of course, one might argue that growth rates and investment ratios are simultaneously determined. But, this would only suggest that the given variable of interest has a more direct impact on expansion.
Fiscal Federalism
The EBA evaluates three proxies for fiscal federalism. First, data are available for the central revenue share for fifty-one countries for various averaging periods from 1961–95, which produces 193 observations per regression. Turning to Table 1, the weighted coefficient suggests that centralization has a positive effect on growth, which contradicts Weingast's hypothesis. The magnitude of the coefficient implies about a 0.59 percentage point difference in growth between the least federal case in the sample, Zambia in 1966 with a share of 99.96 percent, and the most federal case, Switzerland in 1976 with a share of 28.40 percent. But, the estimate does not pass any decision rule. Turning to investment, the weighted coefficient in Table 2 is negative, consistent with the hypothesis, and suggests that investment in the most centralized country is about 0.78 percentage points lower on average than that for the most federal. But, the result is not robust to any EBA criterion.87
Given considerable limitations with the UN data on central government revenue shares and the federal spending gap, this paper only examines the sub-federal entities dummy variable in the more comprehensive EBA designs that include other institutional variables.
Data are available for the federal spending gap, the second proxy for fiscal federalism, for sixteen cases for various averaging periods during 1961–2000, which produces ninety-three observations for each regression. According to Table 1, the weighted coefficient is consistent with the hypothesis and indicates a predicted discrepancy of about 0.33 percentage points considering the lowest gap, Japan in 1971 at about −23.40 percent, and the highest gap, Italy in 1976 at 11.67 percent. But, the estimate is not robust to any EBA decision rule. The weighted coefficient for the investment regressions in Table 2 is also consistent with the hypothesis and suggests that the extreme sample values imply about a 1.20 percentage point difference in investment. But again, the estimate is not robust to any EBA decision rule, as the estimate is only significant in about 3.0 percent of the 165 regressions.
Substantially more data are available for the third proxy, the sub-federal entities dummy variable (Henisz), and the underlying panel regressions include 683 observations covering ninety-three countries for various averaging periods during 1961–2000. The weighted coefficient in Table 1 suggests that the presence of sub-federal entities on average reduces growth by about 0.02 percentage points. But, none of the regressions produce a statistically significant estimate, and therefore the variable fails every EBA decision rule. Turning to investment, Table 2 shows that the weighted coefficient is positive, consistent with the hypotheses, and indicates that sub-federal entities boost investment by about 2.45 percent on average. But as indicated in Column 4, only about 13.9 percent of the regressions produce significant estimates. The lower and upper bounds have opposite signs, and the variable does not pass any EBA decision rule.88
The failure to pass any EBA criterion does not seem because of multicollinearity. The average VIF is only 1.275 for the underlying regressions, and the regressions with VIFs above the mean produce higher t statistics on average. Notably, the sub-federal entities dummy variable is not significant in any regression that includes either the consumption or the age dependency ratios.
Turning to the more comprehensive EBA, as the top panel in Table 3 indicates, the weighted coefficient for the 1976–2000 sample is positive and suggests that the presence of sub-federal entities boosts growth by about 0.16 percentage points. However, none of the 455 underlying regressions produce significant estimates, and the estimate does not pass any EBA decision rule. The weighted coefficient for the 1966–90 sample suggests that sub-federal entities increase growth by about 0.99 percent on average. This result does not pass the traditional EBA criterion because the upper and lower bounds have opposite signs, and it narrowly fails the R2 decision rule, as only 96.5 percent of the regressions with comparatively high R2s produce significant estimates. The variable that seems most problematic for the dummy variable in this sample is the labor organization index, as only about 31 percent of the regressions that include this measure produce significant estimates. Notably, the estimate does not fail the traditional and R2 tests because of multicollinearity—the mean VIF of 2.311 is comparatively low, and the mean t statistic from regressions with VIFs above the mean is greater than the mean for those below the mean.89
Note that given that the dummy variable does not change over time for any country in either the 1976–2000 or 1966–90 samples, fixed-effects models are not possible. The dummy variable is coded 1 for Australia, Belgium, Canada, Germany, Switzerland, and the United States in the 1976–2000 sample, but Australia, Germany, and Switzerland are not included in the 1966–90 sample. In addition to specification, differences across space and time across both samples could contribute to the differences between the findings in the upper and lower panels of Table 3.
As Table 4 indicates, both weighted coefficients for the 1976–2000 and 1966–90 samples are negative and suggest that the presence of sub-federal entities lowers investment on average about 1.27 and 3.96 percentage points, respectively. However, neither estimate is robust to EBA. None of the underlying regressions are significant for 1976–2000, and only 26.4 percent of the models for 1966–90 are statistically significant. Moreover, among the underlying regressions with comparatively high R2 values in both samples, none produces a statistically significant estimate, and each CDF estimate is below 0.95.
Political Regime-Type
Data on political regime-type measures produce few robust results for either growth or investment. For example, there are 578 observations for the underlying regressions that evaluate the nL, with ninety-three countries for various averaging periods from 1961–95. As Table 1 indicates, the weighted coefficient for the growth regressions is positive and suggests that growth is about 0.31 percentage points greater from the minimum (0 for thirty countries in the sample) to the maximum value of effective legislative parties in the sample (10.02 for Poland in 1991). But, none of the 165 underlying growth regressions produces a statistically significant estimate, and the variable is not robust. Also, Table 2 shows that the weighted coefficient is positive and implies about a 1.21 percentage point discrepancy in investment given the full range of values in the sample, but no investment regression produces a statistically significant estimate, and the variable fails each EBA decision rule.
The ep/cf measure produces somewhat more robust results, but only for investment. There are 126 observations for each regression, as data on sixteen countries covers various averaging periods during 1961–2000. Table 1 shows that the weighted coefficient is negative and suggests that growth increases by about 0.19 percentage points from the lowest, the United States in 1976 with 1.43, to the highest value of ep/cf, Belgium in 1991 with 8.21. However, none of the 165 regressions produce statistically significant estimates, and the variable is not robust according to any EBA decision rule. The investment regressions summarized in Table 2 suggest a negative impact on capital accumulation. The weighted coefficient implies a predicted difference of about 3.81 percentage points for investment between the cases with the highest and lowest values of the ep/cf measure. But, only 36.4 percent of the regressions produce robust results, and none of the regressions that include government spending or have comparatively high R2 values produce significant estimates. However, the result is robust to the CDF decision rule, and is therefore broadly consistent with previous findings.90
Tables 3 and 4 show the robustness of ep/cf to the broader EBA specifications in both the 1976–2000 and 1966–90 samples. Table 3 indicates that the weighted coefficients are positive in both samples and suggest about a 0.47 and 0.31 percentage point difference in growth, respectively, between the minimum and maximum sample values. But, neither estimate is robust to any EBA decision rule, as few underlying regressions produce significant estimates. Also, the weighted coefficients in Table 4 suggest that the ep/cf measure has a negative effect on capital accumulation, as the magnitude of the estimates implies about a 2.89 to 2.95 percentage point decrease in investment, respectively, given the full ranges of values in the sample. But again, neither of the estimates passes any EBA decision rule.
Finally, the political constraint index does not seem to correlate robustly with either growth or investment. For example, there are 659 observations per regression, with data on ninety-one countries for various averaging periods from 1961–2000, and Table 1 indicates that the weighted coefficient is positive. Given the observations with the lowest, 0 for fifty-five countries for various averaging periods, and the highest score on the index, Belgium in 1996 with 0.89, the estimate implies about a 0.10 percentage point discrepancy in growth rates. But, none of the 165 underlying regressions produces significant results, and the variable is clearly fragile. Also, Table 2 shows that the weighted coefficient in the investment regressions is also positive, as the minimum and maximum values imply about a 0.78 percentage point average difference in investment, but again, none of the underlying regressions produce a significant result, and the political constraint index is clearly fragile to economic control variables.
Conclusions
A growing literature addresses the effect of institutions on macroeconomic performance. Given the ubiquitous preference for economic expansion, these studies have considerable practical application. This article addresses two issues. First, some previous studies simply fail to render testable propositions, and therefore, in contrast to econometric studies that use survey-based measures of entrepreneurial perceptions, this study examines objectively measurable institutions that are broadly associated with the organization of labor, capital, and the state.91
Second, the empirical literature on institutions, in turn, is largely incommensurable with respect to other institutional variables or economic controls, and the econometrics in this study use EBA to assess the relative sensitivity of previous findings to specification bias. Simply, the assessment of political or institutional variables should be no less rigorous than the evaluation of macroeconomic or other related correlates.Given the sensitivity analysis, which institutions associated with the organizations of labor, capital, and the state are particularly important? Some data suggest that SDC variables matter, but the results are somewhat contradictory. For example, the interaction between labor organization and partisanship is comparatively robust to specification bias in investment but not growth regressions, which perhaps suggests that these variables have an indirect rather than a direct effect on growth. Indeed, much of the SDC literature seems to focus not necessarily on the efficient allocation of capital but rather on the investment channel, as labor confederations and unions temper wage demands notably in return for sustained investment. However, in direct substantive contrast to these findings, some data suggest that countries with more flexible labor markets enjoy more favorable macroeconomic performance, as the wage bargaining index is comparatively robust in both growth and investment random-effects regressions. With respect to the organization of capital, some proxies produce comparatively robust results with respect to capital accumulation in Tables 2 and 4, but, with the exception of the results for relative stock market size using the 1976–2000 sample, these measures do not seem to have a robust effect on growth. Again, similar to the SDC variables, these results suggest that the organization of capital affects growth positively but indirectly through capital accumulation. Finally, institutions under the general rubric of the organization of the state seem to matter least, as proxies for fiscal federalism and political regime-type are generally fragile.
Just how robust are institutions in general? To consider the results as a whole, Table 5 shows that among the fifty-two EBA tests, twelve produce robust results according to at least one decision rule. In addition, only one test passes the extreme rule and only two pass the R2 decision criterion. Therefore, few sturdy institutional correlates emerge from the data. But notably, previous studies suggest that most variables in general, including more mainstream macroeconomic factors, are similarly sensitive to specification bias. Again, Levine and Renelt find that only the investment ratio is a robust correlate of growth among fifty possible determinants,92
and Sala-i-Martin, who applies a considerably more lenient criterion, still finds that forty-one of fifty-eight variables are fragile.93Sala-i-Martin 1997a and 1997b.
Summary of EBA results

Moreover, the magnitude of the weighted betas, whatever the robustness of the estimates to specification, is considerable. In general, perhaps EBA places too much emphasis on statistical as opposed to economic significance. Therefore, in addition to robustness to EBA, Figures 1 and 2 summarize for each institutional variable the implied predicted impact on growth given the EBA weighted coefficients (Column 1 in Tables 1 and 4) and the minimum and maximum (country-averaging period) values of the underlying variable of interest in the regression sample. Figures 1 and 2 show that these predicted values based on the minimum and maximum values in the sample range from about 1.51 to −1.08 percentage points in annual per capita real growth rates and from about 8.21 to −3.96 percentage points in the investment ratio, respectively. The magnitude of these coefficients on institutional variables are sizeable, and indeed, additional research would be instructive.

Predicted values of growth based on weighted EBA coefficients (Table 1) and minimum and maximum sample values

Predicted values of investment based on weighted EBA coefficients (Table 2) and minimum and maximum sample values
For example, further examination of possible indirect effects of institutions would be useful. Apart from the indirect channel from investment to growth discussed above, assessment of direct effects does not address how, more exactly, institutions affect macroeconomic outcomes. In general, the preceding EBA neither precludes nor confirms some connection between institutions and economic policy that, in turn, helps explain divergent patterns of performance. Tavares and Wacziarg, for example, examine how democracy affects human capital, income distribution, physical capital accumulation, and government spending, which in turn affect growth, and a similar approach could be applied to other institutions besides political regime-type.94
Also, Durham examines the indirect effect of institutions such as stock market and banking system development on growth through foreign direct and equity portfolio investment, and again, this work on indirect channels and “absorptive capacity” has potential applications using labor organization or political regime-type as critical intervening variables.95In a similar vein, future work on the extent to which institutions and economic performance are endogenously determined would be useful in identifying possible instruments for simultaneous equations estimation. Indeed, simultaneity bias besets several growth regressors,96
See Temple 1999.
Durham finds that these variables only marginally help identify institutions associated with the organization of capital. Durham 2004.
Appendixes
Correlation matrices

Date values, selected variables (averaging period means)

(Continued)

(Continued)

(Continued)

Data sources

References
REFERENCES
Acemoglu, Daron,
Simon Johnson, and
James A. Robinson.
2000.
The Colonial Origins of Comparative Development: An Empirical
Investigation.
Working Paper 7771.
Cambridge, Mass.:
National Bureau of Economic Research.
Alesina, Alberto,
Nouriel Roubini, and
Gerald Cohen.
1997.
Political Cycles and the Macroeconomy.
Cambridge, Mass.:
MIT Press.
Alvarez, R. Michael,
Geoffrey Garrett, and
Peter Lange.
1991.
Government Partisanship, Labor Organization, and Macroeconomic
Performance.
American Political Science Review
85 (2):539–56.Google Scholar
Barro, Robert, and
Jong-Wha Lee.
2000.
International Data on Educational Attainment: Updates and
Implications.
Working Paper 42.
Cambridge, Mass:
Center for International Development at Harvard University.
Belsley, David,
Edwin Kuh, and
Roy Welsch.
1980.
Regression Diagnostics: Identifying Influential Data and Source of
Collinearity.
New York:
John Wiley & Sons.
Bernholz, Peter.
1993.
Comment.
Journal of Institutional and Theoretical Economics
149 (1):312–20.Google Scholar
Borner, Silvio,
Aymo Brunetti, and
Beatrice Weder.
1995.
Political Credibility and Economic Development.
New York:
St. Martin's Press.
Brunetti, Aymo.
1997a.
Political Variables in Cross-Country Growth Analysis.
Journal of Economic Surveys
11 (2):163–90.Google Scholar
Brunetti, Aymo.
1997b.
Politics and Economic Growth: A Cross-Country Data Perspective.
Paris:
OECD Development Centre.
Bruno, Michael, and
Jeffrey Sachs.
1985.
Economics of Worldwide Stagflation.
Cambridge, Mass.:
Harvard University Press.
Casella, Alessandra, and
Bruno Frey.
1992.
Federalism and Clubs: Towards an Economic Theory of Overlapping
Political Jurisdictions.
European Economic Review
36 (2–3):639–46.Google Scholar
Cooley, Thomas F., and
Stephen F. LeRoy.
1981.
Identification and Estimation of Money Demand.
American Economic Review
71:825–44.Google Scholar
Crafts, Nicholas F. R.
1992.
Institutions and Economic Growth: Recent British Experience in an
International Context.
West European Politics
15 (4):16–38.Google Scholar
Durham, J. Benson.
1998.
Economic and Political Institutions and Growth: Some Econometrics.
Ph.D. diss.,
Columbia University,
New York City.
Durham, J. Benson.
1999.
Economic Growth and Political Regimes.
Journal of Economic Growth
4 (1):81–111.Google Scholar
Durham, J. Benson.
2000.
Extreme Bound Analysis of Emerging Stock Market Anomalies: Nothing
is Robust.
Journal of Portfolio Management
26 (2):95–103.Google Scholar
Durham, J. Benson.
2001.
Sensitivity Analyses of Anomalies in Developed Stock Markets.
Journal of Banking and Finance
25 (8):1503–41.Google Scholar
Durham, J. Benson.
2002.
The Effects of Stock Market Development on Growth and Private
Investment in Lower-Income Countries.
Emerging Markets Review
3 (3):211–32.Google Scholar
Durham, J. Benson.
2004.
Absorptive Capacity and the Effects of Foreign Direct Investment
and Equity Foreign Portfolio Investment on Economic Growth.
European Economic Review
48 (2):285–306.Google Scholar
Erb, Claude B.,
Campbell R. Harvey, and
Tadas E. Viskanta.
1996.
Political Risk, Economic Risk, and Financial Risk.
Financial Analysts Journal
52:29–46.Google Scholar
Ferson, Wayne, and
Campbell R. Harvey.
1997.
Fundamental Determinants of National Equity Market Returns: A
Perspective on Conditional Asset Pricing.
Journal of Banking and Finance
21 (11–12):1625–65.Google Scholar
Field, Alexander J.
1981.
The Problem with Neoclassical Institutional Economics: A Critique
with Special Reference to the North/Thomas Model of Pre-1500
Europe.
Explorations in Economic History
18 (2):174–98.Google Scholar
Garrett, Geoffrey, and
Peter Lange.
1985.
The Politics of Growth: Strategic Interaction and Economic
Performance in the Advanced Industrial Democracies, 1974–80.
Journal of Politics
47 (3):792–827.Google Scholar
Garrett, Geoffrey, and
Peter Lange.
1986.
Performance in a Hostile World: Economic Growth in Capitalist
Democracies, 1974–1982.
World Politics
38 (4):517–45.Google Scholar
Goldberger, Arthur S.
1991.
A Course in Econometrics.
Cambridge, Mass.:
Harvard University Press.
Golden, Miriam,
Peter Lange, and
Michael Wallerstein.
2002.
Union Centralization among Advanced Industrial Societies: An Empirical
Study.
Data set available at
http://www.shelley.polisci.ucla.edu/data. Version dated September
19, 2002.
Granger, Clive W. J., and
Harald F. Uhlig.
1990.
Reasonable Extreme-Bound Analysis.
Journal of Econometrics
44 (1–2):159–70.Google Scholar
Grier, Kevin B., and
Gordon Tullock.
1989.
An Empirical Analysis of Cross-national Economic Growth,
1951–80.
Journal of Monetary Economics
24 (2):259–76.Google Scholar
Hall, Peter A.
1986.
Governing the Economy: The Politics of State Intervention in
Britain and France.
New York:
Oxford University Press.
Headey, Bruce W.
1970.
Trade Unions and National Wage Policies.
Journal of Politics
32 (2):407–39.Google Scholar
Henisz, Witold J.
2000.
The Institutional Environment for Economic Growth.
Economics and Politics
12 (1):1–31.Google Scholar
Henisz, Witold J.
2002.
The Institutional Environment for Infrastructure Investment.
Industrial and Corporate Change
11 (2):355–89.Google Scholar
Heston, Alan,
Robert Summers, and
Bettina Aten.
2002.
Penn World Table Version 6.1.
Center for International Comparisons at the University of
Pennsylvania,
Philadelphia.
Hicks, Alexander.
1994.
The Social Democratic Corporatist Model of Economic Performance in
the Short- and Medium-Run Perspective. In
The Comparative Political Economy of the Welfare State, edited by
Thomas Janoski and
Alexander Hicks,
189–217.
Cambridge:
Cambridge University Press.
Hicks, Alexander M., and
Duane H. Swank.
1992.
Politics, Institutions, and Welfare Spending in Industrialized
Democracies, 1960–82.
American Political Science Review
86 (3):658–74.Google Scholar
International Finance Corporation (IFC).
Emerging Stock Markets Factbook.
Washington, D.C.:
IFC, various issues.
International Monetary Fund (IMF).
International Financial Statistics.
Washington, D.C.:
IMF, various issues.
Iversen, Torben.
1998.
Wage Bargaining, Central Bank Independence, and the Real Effects of
Money.
International Organization
52 (3):469–504.Google Scholar
Jensen, Michael C., and
Kevin J. Murphy.
1990.
Performance Pay and Top-Management Incentives.
Journal of Political Economy
98 (2):225–64.Google Scholar
Kee, Woo Sik.
1977.
Fiscal Decentralization and Economic Development.
Public Finance Quarterly
5 (1):79–97.Google Scholar
Knack, Stephen, and
Philip Keefer.
1995.
Institutions and Economic Performance: Cross-Country Tests Using
Alternative Institutional Measures.
Economics and Politics
7 (3):207–27.Google Scholar
Kormendi, Roger C., and
Philip G. Meguire.
1985.
Macroeconomic Determinants of Growth: Cross-Country Evidence.
Journal of Monetary Economics
16 (2):141–63.Google Scholar
Krugman, Paul.
2000.
Can America Stay on Top?
Journal of Economic Perspectives
14 (1):169–75.Google Scholar
Leamer, Edward E.
1983.
Let's Take the Con out of Econometrics.
American Economic Review
73 (1):31–43.Google Scholar
Levine, Ross.
1997.
Financial Development and Economic Growth: Views and Agenda.
Journal of Economic Literature
35 (2):688–726.Google Scholar
Levine, Ross, and
David Renelt.
1992.
A Sensitivity Analysis of Cross-Country Growth Regressions.
American Economic Review
82 (4):942–63.Google Scholar
Levine, Ross, and
Sara Zervos.
1998.
Stock Markets, Banks, and Economic Growth.
American Economic Review
88 (3):537–58.Google Scholar
Lijphart, Arend.
1984.
Democracies: Patterns of Majoritarian and Consensus Government in
Twenty-one Countries.
New Haven, Conn.:
Yale University Press.
North, Douglass C.
1990.
Institutions, Institutional Change, and Economic Performance.
Cambridge:
Cambridge University Press.
North, Douglass C., and
Robert P. Thomas.
1973.
The Rise of the Western World: A New Economic History.
Cambridge:
Cambridge University Press.
Oates, Wallace.
1972.
Fiscal Federalism.
New York:
Harcourt Brace Jovanovich.
Qian, Yingyi, and
Barry Weingast.
1997.
Federalism as a Commitment to Preserving Market Incentives.
Journal of Economic Perspectives
11 (4):83–92.Google Scholar
Rajan, Raghuram, and
Luigi Zingales.
2001.
The Great Reversals: The Politics of Financial Development in the 20th
Century.
Working Paper 8178.
Cambridge, Mass.:
National Bureau of Economic Research.
Sala-i-Martin, Xavier.
1997a.
I Just Ran Two Million Regressions.
American Economic Review
87 (2):178–83.Google Scholar
Sala-i-Martin, Xavier.
1997b.
I Just Ran Four Million Regressions.
Working Paper 6252.
Cambridge, Mass.:
National Bureau of Economic Research.
Scully, Gerald W.
1988.
The Institutional Framework and Economic Development.
Journal of Political Economy
96 (3):652–62.Google Scholar
Stepan, Alfred, and
Cindy Skach.
1993.
Constitutional Frameworks and Democratic Consolidation:
Parliamentarism Versus Presidentialism.
World Politics
46 (1):1–22.Google Scholar
Tavares, José, and
Romain Wacziarg.
2001.
How Democracy Affects Growth.
European Economic Review
45 (8):1341–78.Google Scholar
Temple, Jonathan.
1999.
The New Growth Evidence.
Journal of Economic Literature
37 (1):112–56.Google Scholar
United Nations (UN).
Yearbook of National Accounts Statistics.
New York:
UN, various issues.
Weingast, Barry.
1993.
Constitutions as Governance Structures: The Political Foundations
of Secure Markets.
Journal of Institutional and Theoretical Economics
149 (1):286–311.Google Scholar
World Bank.
2002.
World Development Indicators.
Washington, D.C.:
World Bank.
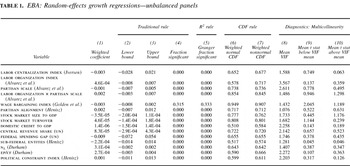
EBA: Random-effects growth regressions—unbalanced panels
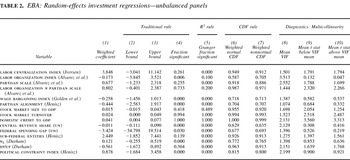
EBA: Random-effects investment regressions—unbalanced panels
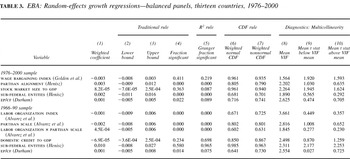
EBA: Random-effects growth regressions—balanced panels, thirteen countries, 1976–2000
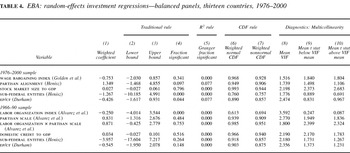
EBA: random-effects investment regressions—balanced panels, thirteen countries, 1976–2000
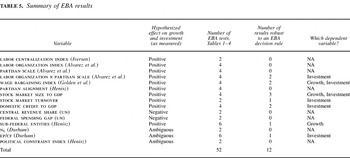
Summary of EBA results
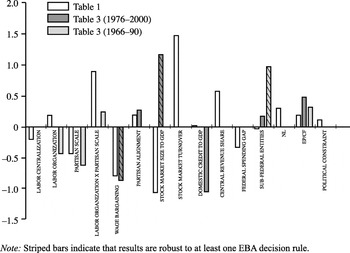
Predicted values of growth based on weighted EBA coefficients (Table 1) and minimum and maximum sample values
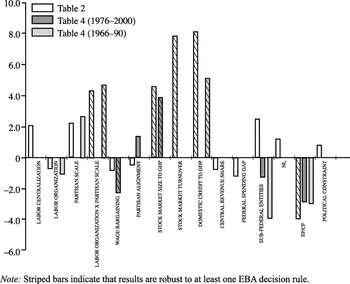
Predicted values of investment based on weighted EBA coefficients (Table 2) and minimum and maximum sample values
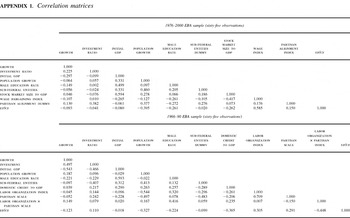
Correlation matrices
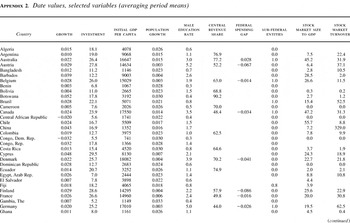
Date values, selected variables (averaging period means)
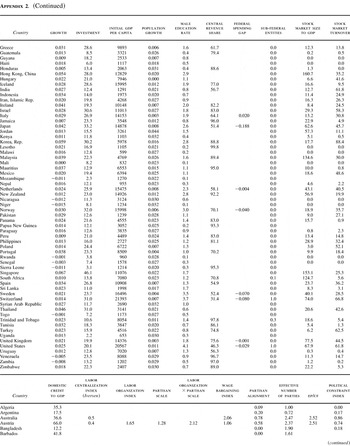
(Continued)
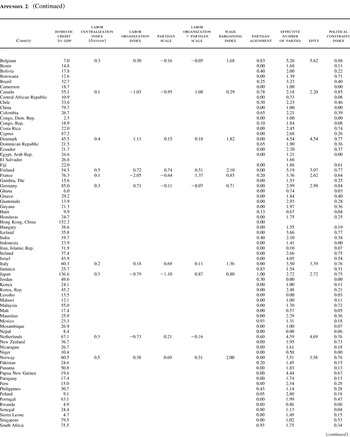
(Continued)
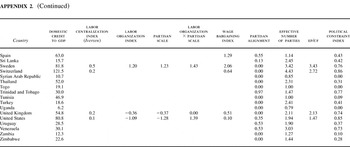
(Continued)
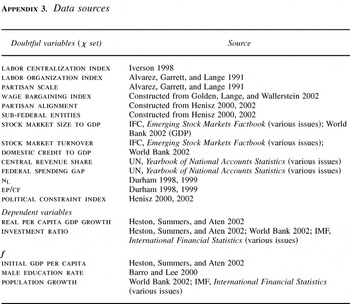
Data sources
 You have
Access
- 14
- Cited by