Postdispersal weed seed predation is an important ecosystem service that can help reduce the number of weed seeds entering the seedbank after being dispersed from the mother plant (Westerman et al. Reference Westerman, Liebman, Heggenstaller and Forcella2006, Reference Westerman, Atanackovic, Royo-Esnal and Torra2012). To maximize seed loss due to predation, some studies have suggested increasing exposure time of weed seeds to predators by allowing them to remain on the soil surface after being shed (Westerman et al. Reference Westerman, Liebman, Heggenstaller and Forcella2006, Reference Westerman, Dixon and Liebman2009). In annual arable crops such as winter cereals, this can be achieved by delaying some management practices like harvest or soil disturbance, mainly tillage after harvest. Opportunities for delaying tillage can be difficult to find within a cropping system, since there may be other reasons for soil tillage that may offset seed predation termination. However, in other circumstances, tillage could be delayed without many drawbacks. In semi-arid regions such as the rainfed areas of northeastern Spain, low rainfall allows just one crop per year, mainly winter cereals, which grow from late October–early November to late June–early July. After crop harvest, fields are left fallow until the next sowing season in autumn. Despite widespread adoption of no-till practices in certain semi-arid areas, some farmers still chisel plow the fields after cereal harvest. Reasons for tillage include burying the crop stubble, preventing soil compaction in autumn, managing summer weeds, and burying winter weed seeds.
Stubble tillage may have contrasting effects on weed populations. Usually, tillage places seeds in a “safer” environment, the soil matrix, compared with the soil surface (Mohler Reference Mohler1993, and references therein). In this sense, tillage can contribute to the buildup of the weed seedbank (Buhler et al. Reference Buhler, Hartzler and Forcella1997). However, tillage can also be used as a weed management strategy if seeds are buried to a depth from which they cannot successfully emerge (fatal germination) (Chauhan et al. Reference Chauhan, Gill and Preston2006; Cousens and Moss Reference Cousens and Moss1990; du Croix Sissons et al. Reference Du Croix Sissons, Van Acker, Derksen and Thomas2000) or if they are attacked by soil microorganisms (seed decay) (Davis et al. Reference Davis, Anderson, Hallett and Renner2006; Gomez et al. 2013; Pekrun and Claupein 2006). In semi-arid systems, conservation tillage and no-till seem to enhance soil microbial biomass carbon and soil enzymes, which are indicators of microbial activity, compared with conventional fully tilled systems (Alvaro-Fuentes et al. Reference Alvaro-Fuentes, Morell, Madejon, Lampurlanes, Arrue and Cantero-Martinez2013). However, there is still very little information about the effects of those organisms on weed seeds, especially during the summer.
In rainfed cereal fields in NE Spain, harvester ant (Messor barbarus L. ) populations are large, especially in no-till and minimally tilled fields (Baraibar et al. Reference Baraibar, Westerman, Carrión and Recasens2009, 2011a). Ants are active from spring to late autumn, and their activity coincides with the period of seed shed and seed availability on the soil surface for most of the important weeds in these systems. Seed removal by harvester ants was estimated to be around 72% of the weed seeds produced annually before crop harvest (Westerman et al. Reference Westerman, Atanackovic, Royo-Esnal and Torra2012). So, seed predation in these systems seems to be an effective strategy to decrease weed seed incorporation into the seedbank. Because it buries seeds, tillage stops weed seed predation, since ants and most seed predators do not dig for buried seeds.
Though preharvest seed predation has been studied, postharvest predation has seldom been addressed (but see Baraibar et al. Reference Baraibar, Westerman, Carrión and Recasens2009; Spafford Jacob et al. Reference Spafford Jacob, Minkey, Gallagher and Borger2006), and many questions still remain regarding weed seed fate during this period. For example, seeds could be buried under the straw after cereal harvest and become less visible for ants, thus decreasing seed encounter rates by predators and, consequently, removal rates (Baraibar et al. 2011b; Westerman et al. Reference Westerman, Liebman, Heggenstaller and Forcella2006, Reference Westerman, Dixon and Liebman2009). Similarly, the density of different seed species on the soil surface after harvest (referred as seed environment or background seed density) may influence predation rates of different weed species, since it can change ants’ seed preference (Detrain et al. Reference Detrain, Tasse, Versaen and Pasteels2000; Lopez et al. Reference Lopez, Acosta and Serrano1993; Reyes-Lopez and Fernández-Haeger Reference Reyes Lopez and Fernández-Haeger2002; Risch and Carroll Reference Risch and Carroll1986). Seed environment on the soil surface can also change ants’ spatial exploration range (Detrain et al. Reference Detrain, Tasse, Versaen and Pasteels2000; Lopez et al. Reference Lopez, Acosta and Serrano1993). If resources are scarce, ants may explore a wider area of the field, whereas if seeds are available in high densities close to the nest, the area explored may be smaller and some seeds placed away from the nest may remain undiscovered and eventually enter the seedbank. Understanding seed predation magnitude after crop harvest and factors influencing it can help design management practices to try to maximize it.
In this study, we followed weed seed fate in a tilled vs. a no-till area in three cereal fields during the summer fallow period. In the no-till areas, we measured seed predation rates of two weed species (presented in petri dishes) and assessed the effects of straw on seed encounter and seed predation rates. We also measured seed background density to understand whether the seed environment experienced by predators during the summer influenced predation rates of our experimentally added seeds or ants’ exploration behavior. In the tilled areas, we followed the postburial fate of a known number of seeds. Our objective was to compare mortality rates of exposed vs. buried weed seeds during the summer fallow to inform our recommendations to farmers about weed seed management strategies during this period.
Materials and Methods
Site
Experiments took place in the rainfed cereal region of northeastern Spain. Mean annual temperature is 15 C, and average rainfall is 342 mm (Agencia Estatal de Meteorología 1983–2010), concentrated mainly in spring and autumn. Summers are hot and dry (average maximum: 31 C), and winters are mild (average minimum: 2 C). Accumulated rainfall at the end of the summer of the experiment (2014) was between 31% and 118% higher than the average (120 to 214 mm more than average depending on the location). Three winter cereal fields were chosen, one in Algerri (41.82°N, 0.59°E), one in Balaguer (41.80°N, 0.76°E), and one in Vilanova de Bellpuig (41.59°N, 0.98°E). The field in Algerri was organically certified and followed a 3-yr rotation of wheat (Triticum aestivum L.), spelt (Triticum spelta L.), and a mixture of oats (Avena sativa L.) and vetch (Vicia sativa L.) for forage. The other two fields were farmed conventionally (not organically) and grew barley (Hordeum vulgare L.) as a monoculture. Algerri was the northernmost field, 100 m in altitude higher than the other two locations, and received considerably more rainfall than the other two. Based on climatology and the farmer’s schedule, cropping operations such as planting or tillage in Algerri occurred 2 wk later than in the other two fields. The three fields were chisel plowed at a depth of 15 to 20 cm two times a year, once after crop harvest in June/July and again before crop sowing in October.
Experimental Design
Per field, two 50 by 50 m areas were flagged. The two areas were separated by a 10- to 20-m strip. Two or three days after harvest, while the straw was still on the fields, seed predation was measured for 48 h in one of the areas (called the “no-till area,” see Weed Seed Predation section for experiment details). After this first seed predation assessment took place, the straw was removed and the entire field was chisel plowed, except for the “no-till area” and the contiguous strip, which were left untilled throughout the summer.
Weed Seed Fate in the No-Till Area: Weed Seed Predation
The no-till area was used to measure seed predation during summer. Two weed species were used, rigid ryegrass (1.8 g per 1000 seeds) and catchweed bedstraw (6.8 g per 1000 seeds). These species were chosen because they differ in weight, size, shape, and preference by predators. Rigid ryegrass is highly preferred by harvester ants over catchweed bedstraw if the two are offered together (Westerman et al. Reference Westerman, Atanackovic, Royo-Esnal and Torra2012). Rigid ryegrass seeds collected from areas close to the experiments were used for the first seed predation measurement date, and seeds from Herbiseed (Reading, UK) were used for later dates. All catchweed bedstraw seeds were collected from local populations close to the fields.
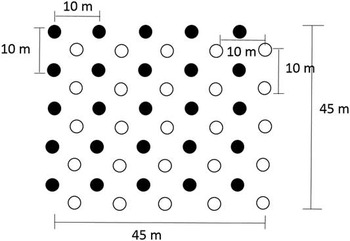
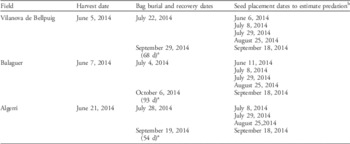
To measure weed seed predation, 25 petri dishes (9-cm diameter) per species were installed in the “non-till area” of each field (50 petri dishes total). Each dish had two 15-mm-wide openings in the sides to facilitate predator access. Seeds of the two species were not mixed; each species had its own petri dish. Petri dishes from the same species were arranged 10 m apart on two regular grids of 5 rows and 5 columns. Petri dish grids from the two species were 5 m apart from each other (Figure 1). Seed removal was measured throughout the summer every 3 wk from harvest in June until September (Table 1). Seed removal in Algerri was measured four times during summer, while seed removal was measured five times in the other two fields.
Schematic drawing of the location of the petri dishes in the no-till area. Black dots represent petri dishes filled with rigid ryegrass seeds and white dots represent dishes with catchweed bedstraw seeds.

Harvest date, bag burial and recovery dates and date when weed seeds were placed on each field to estimate predation rates.

a Recovery date. Number in parentheses indicates the number of days seeds were buried.
b Seeds were retrieved after 48 h.
On the first measurement date, 2 g of each species were left on each of the dishes to resemble high weed seed densities immediately after harvest. Seeds were left in the field for 48 h and then retrieved and weighed in the lab. Seeds returning from the field were dried before being weighed to ensure similar moisture contents before and after field exposure. The difference between the initial and the recovered weight was considered to represent seeds removed by predators. On this first date, right after cereal harvest, fields still had straw arranged in lines approximately every 10 to 15 m, covering around 20% of the field area. Accordingly, 20% of the petri dishes (10 random dishes per species) were placed under the straw lines, with the distance between dishes kept constant as much as possible. The straw layer was approximately 15-cm thick. Straw was removed by farmers 2 d after the first measurement date. On the subsequent measurement dates, 1 g of each species was used. Field days were chosen to avoid extreme weather conditions such as strong wind and heavy rain so seed weight removed could be attributed to seed predators and not to climatic conditions.
Seed Background Measurements
The same day that dishes were placed for the predation assessment, background seed density was measured in five random 1-m2 quadrats using an insect suction sampler (Vortis insect suction sampler, Burkard Manufacturing, Rickmansworth, UK). Sampled areas were noted to avoid resampling of the same area on later dates. Samples were taken to the lab, and seeds were separated from dirt and straw using a set of sieves. Seeds were identified to species and counted. Seed background measurements were correlated to predation and dish encounter rates (see Ant Searching Activity section).
Harvester Ant Nest Density
In August, all harvester ant nests in the no-till area were counted to get an estimate of predator density in each field. Once a nest had been counted, the area next to the entrance was sprayed with colored paint to prevent double counting. Nest density per hectare was calculated.
Ant Searching Activity
Ant searching activity was approximated by calculating the proportion of petri dishes found by ants in each sampling date. Dishes were considered found if the proportion of seeds removed was higher than 20% of the initial seed weight (following Baraibar et al. 2011a).
Weed Seed Fate in the Tilled Area
In the tilled area, 20 nylon bags per species (10 by 12 cm and 0.08-cm mesh size) were buried 6-cm deep. This depth was chosen because it is the depth at which most seeds are buried after chisel cultivation (Mohler et al. Reference Mohler, Frisch and McCulloch2006). Each bag contained 30 seeds of one of the species together with 200 cm3 of soil. The goal of soil incorporation was to decrease the possibility of a fungal contamination from seed to seed (Van Mourik et al. Reference Van Mourik, Stomph and Murdoch2005) and mimic real burial conditions, in which seeds are usually mixed up with soil particles. Burial location was random within the 50 by 50 m area. Bags were left buried throughout summer and were retrieved at the end of September or beginning of October (Table 1) based on the farmers’ intentions to till the fields. Bags were taken to the lab and frozen until they could be processed. Bag contents were washed using an elutriator (Wiles et al. Reference Wiles, Barlin, Schweitzer, Duke and Whitt1996), and seeds were recovered using sieves and visual inspection. Recovered seeds were classified as either dead or alive. Dead seeds included those that had germinated (if we could still see the hypocotyl or the radicle), were decomposed, or were nonviable (no visible signs of germination, dead embryo). Decomposed seeds could have decomposed after germination, but we could not assess the causes of mortality for this group (10% of the seeds). Nonviable and live seeds were separated by incubating them in a 1% triphenyl-tetrazolium chloride for 48 h. Initial seed viability used to correct the results of viable seeds was 100% for rigid ryegrass and 96% for catchweed bedstraw.
Statistical Analyses
Weed Seed Fate in the No-Till area: Weed Seed Predation
A Bayesian analysis framework with Markov Chain Monte Carlo (MCMC) techniques was adopted to estimate the proportion of seeds lost to predators. Bayesian inference is a method of statistical inference in which Bayes’s theorem is used to update the initial probability for a hypothesis (prior) as more evidence or information becomes available. Because the dependent variable was a ratio, Bayesian methods seemed an appropriate approach to analyze the data. First, data exploration was applied following the protocol described in Zuur et al. (Reference Zuur, Ieno and Elphick2010) to investigate outliers, homogeneity, normality, zero trouble, collinearity, relationships, interactions, and independence. Then, a beta distribution was used to model the ratio of predated weight and initial weight. This distribution is appropriate if the response variable is a continuous variable ranging from x 1 to x 2, with a logistic link function (Zuur and Ieno 2016). To account for the repeated measurements on the same petri dish, a random intercept “station” term was added. Hence, the following PROC GLMM was used:
 $${\rm Ratio}_{{ij}} \,\sim\,{\rbeta}\,\left( {{\rtheta}\,{\asterisk}\,{\Pi}_{{ij}} ,\,{\rtheta}\,{\asterisk}\,\left( {{\rm 1}{\minus}{\Pi}_{{ij}} } \right)} \right)$$
 $${\rm Expected}\,( {{\rm Ratio}_{{ij}} } \right){\equals}{\Pi}_{{ij}} $$
 $$\eqalignno{{\rm Logit}\,\left( {{\Pi}_{ij}} \right){\equals} {\rm Date}_{{ij}} \,{\asterisk}\,{\rm Weed}_{{ij}} {\plus}{\rm Background}_{{ij}} \cr {\plus}{\rm Field}_{{ij}} {\plus}{\rm Station}_{i} $$
where Ratio ij is the j th observation at station i, and Station i is a random intercept that is normally distributed with mean 0 and variance σ2. Date, weed species, and field were fit as categorical variables. Field was treated as a fixed effect because of too few levels of the factor (Bayesian statistics require at least five levels to be able to consider an effect to be random, AF Zuur, personal communication). MCMC techniques were then applied to estimate the parameters in the model. Analyses were done with a program for Bayesian hierarchical models called JAGS (Plummer et al. Reference Plummer, Stukalov and Denwood2016) via the package ‘R2jags’ in R (R Core Team 2014). Diffuse normal priors were used. A prior is the probability distribution of the initial hypothesis. Because previous knowledge about the prior distribution was lacking, a normal distribution with large variance (diffuse) was used. A half-Cauchy (5) distribution was used for σ, and a half-Cauchy (25) was used for theta. Sigma and theta are shape parameters of the beta distribution. Three chains were used, each with a burn-in of 25,000 iterations (burn-in refers to the practice of discarding an initial portion of a Markov chain sample so that the effect of initial values on the posterior inference is minimized). The thinning rate was 10 (i.e., every 10th draw from the algorithm is actually used to compute credible sets and medians of the posterior distribution), and 15,000 iterations were used for the posterior distribution of each parameter. Once the model was fit, a model validation was applied to ensure normality and homoscedasticity of residuals. Estimated proportions of seed loss were later used to estimate long-term loss due to predation.
Long-Term Loss Due to Predation
Long-term loss due to predation was calculated in two separate ways. Both methods followed the models by Westerman et al. (2003) and Davis et al. (Reference Davis, Daedlow, Schutte and Westerman2011), but they differed on the seed availability used as the basis for the calculations. Models used by Westerman et al. (2003) and Davis et al. (2011) were developed to estimate the annual proportion of newly produced weed seeds consumed by granivores
 $$\overline{{Mp}} $$
before crop harvest. In these models,
 $$\overline{{Mp}} {\equals}1{\minus}\overline{{Sp}} $$
where
 $$\overline{{Sp}} $$
is the annual proportion of newly produced seeds that survive predation and can be calculated as:
 $$\overline{{Sp}} {\equals}{{\mathop{\sum}\nolimits_{i{\equals}1}^n {\left( {Yi\prod\nolimits_{i{\equals}j}^k {Sj} } \right)} } \over {\mathop{\sum}\nolimits_{i{\equals}1}^n {Yi} }}$$
These equations are used to estimate weed seed loss during weed seed rain. Consequently, annual seed production, Y, is divided into multiple pulses (Y i ) occurring within n periods of a specified length. Seeds from each pulse survive at the episodic rate S j , where the k is the duration of the seed exposure. In our experiment, there was no seed rain. Weed seed rain stopped with cereal harvest, so the only seeds available to predators were the ones present on the soil surface on the first sampling date (first measurement of background seed density). However, densities of seeds on the soil surface were so unexpectedly low that the model estimated loss to predation to be 100% at 4 d after the start of the experiment. This was not supported by our background measurements, which showed rigid ryegrass seeds even on the last sampling date. So, we calculated long-term loss following Equations 2 and 3, assuming that seeds offered in petri dishes (g) plus the background seed weight of rigid ryegrass and catchweed bedstraw on each sampling date constituted the seeds available in each date.
Straw Effect on Number of Dishes Encountered and Seeds Removed
The effects of the straw on the number of dishes found and the weight of seeds removed were analyzed using a GLMM with a binomial error distribution and a linear mixed model, respectively. Fields and petri dishes were treated as random effects, with weed species and the presence/absence of straw as fixed effects. Seed weight was log(x + 1) transformed before running the analysis. All analyses were performed using the ‘lme’ package in R (R Core Team 2014).
Weed Seed Fate in the Tilled Area
The number of alive vs. dead seeds was analyzed using a GLMM with a binomial distribution of the error in R (R Core Team 2014). Weed species and field were entered as fixed effects, while bag number was entered as a random effect. Here, field was considered a fixed effect to enable comparison of mortality rates due to burial with mortality caused by predation for each field.
Results and Discussion
Weed Seed Fate in the No-Till Area
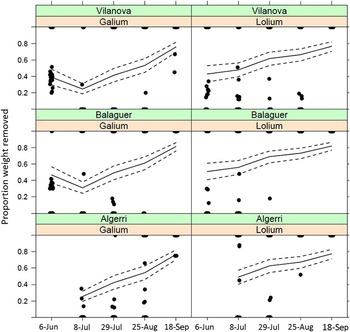
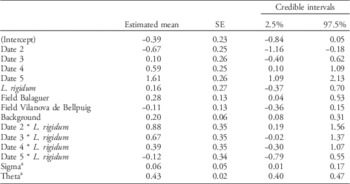
Data exploration did not indicate outliers or the presence of collinearity. Mixing of the chains (a diagnostic tool to measure convergence of the model in Bayesian statistics) was good for all parameters, except for sigma (values were small indicating that the station effect was rather weak). Model validation did not indicate any model violations. The MCM output for Equation 1 is shown in Table 2 following Zuur and Ieno (2016). The posterior mean of the fitted values and 95% credible intervals per field and weed combination for all dates are presented. Posterior means are the predicted values for seed predation rates, which are conditional on the observed data. There are no P-values in Bayesian statistics, and significance of the factors cannot be determined from the table. However, since we were not comparing different treatments, the significance of each factor is not as important as the overall trend of removal rates. Table 2 provides the numerical output to estimate weed seed predation rates for each combination of weed, field, and date. Interpreting this numerical output can be challenging (Zuur and Ieno 2016), so the fitted values are sketched in Figure 2 (minor random jittering was applied along the x-axis to ensure that points are not superimposed). The proportion of seed loss due to predation ranged from 20% to 80% per 2 d (Figure 2). Main seed predators were probably harvester ants, which were present in high densities in those fields (340, 335, and 360 nests ha−1 in Vilanova de Bellpuig, Balaguer, and Algerri, respectively). Granivorous mice are very scarce in the area and leave clear signs when they visit petri dishes that were not seen in this experiment (i.e., droppings, seed chaff; Baraibar et al. Reference Baraibar, Westerman, Carrión and Recasens2009). Thus, rodents likely did not contribute to seed removal. We cannot exclude the possibility that birds removed some seeds. However, the few studies that have investigated seed loss due to bird predation show that such loss tends to be low during the summer (Holmes and Froud-Williams Reference Holmes and Froud-Williams2005).
Estimated proportion of seeds removed for each species (rigid ryegrass and catchweed bedstraw) during 48-h intervals in each field (Vilanova de Bellpuig, Balaguer, and Algerri). Dashed lines represent the 95% credible intervals for the posterior mean values.

Posterior mean values, SEs, and 95% confidence intervals for the posterior mean values per field, date, and weed species and the interaction (*) between date and weed species.

a Sigma and theta are shape parameters of the beta distribution.
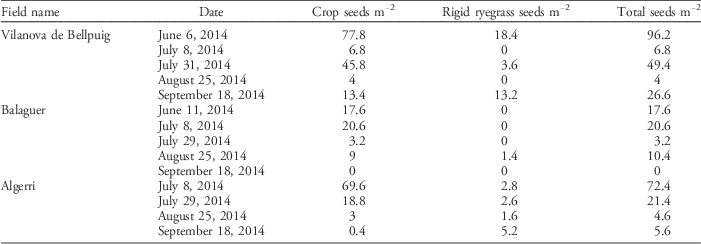
Predation rates were low in June and tended to increase after the beginning of July. Weed seed predation rates observed were in accordance with other studies in the region for the same time period (Baraibar et al. Reference Baraibar, Westerman, Carrión and Recasens2009), thus suggesting that seed removal patterns by harvester ants in this region are consistent over time. Low removal rates immediately following crop harvest had already been documented by Baraibar et al. (Reference Baraibar, Westerman, Carrión and Recasens2009). One of the possible causes for these low rates is background seed densities. Table 3 shows the density of crop and weed seeds recorded on each sampling date. Weed seed density was extremely low, and most of the seeds present on the soil surface were crop seeds (barley or spelt grains). A significant negative relationship between background density and seed predation of our experimentally added seeds was observed in Algerri and Balaguer (R2=0.54 and 0.6, P=0.02 and 0.015, respectively). This relationship suggests that when crop seeds were abundant (i.e., right after harvest), harvester ants consumed them preferentially over weed seeds and especially avoided less preferred seeds like catchweed bedstraw (Crist and MacMahon 1992). Then, as crop seed density decreased, ants consumed more of the experimentally added weed seeds. Similarly, we observed in these two fields a negative correlation between background seed density and the proportion of dishes found, although it was only significant in Balaguer (R2=0.27 and 0.70, P=0.18 and 0.002, respectively), suggesting that ants foraged closer to the nest when resources were high (i.e., right after harvest) and shifted to search a wider area as resources became scarcer. This fact is in agreement with other studies that showed that harvester ant foraging trails are shorter and more branched when seed availability is high (Lopez et al. Reference Lopez, Acosta and Serrano1993). In the third field (Vilanova de Bellpuig), which had the highest background seed density (Table 3), weed seed removal was not significantly correlated to background seed density or to the proportion of dishes found. The lack of correlation was mainly driven by what happened at the first sampling date, when seed availability on the soil surface was highest. In contrast to the other fields, the small chaff portion of the straw (together with weed and crop seeds) was dumped from the combine and left in several piles across this field during harvest. An average of up to 217 crop seeds and 25 rigid ryegrass seeds were counted in a 10-cm3 volume taken from these mounds (unpublished data). Those high-density areas did not occur in the two other localities and may have caused a change in ants’ foraging behavior (Detrain et al. Reference Detrain, Tasse, Versaen and Pasteels2000; Lopez et al. Reference Lopez, Acosta and Serrano1993). Ant trails consistently ended in the high-density piles, probably because this foraging strategy maximized resource acquisition (Detrain et al. Reference Detrain, Tasse, Versaen and Pasteels2000). The proportion of dishes encountered on this date and in this field was close to 100%, thus confirming that a larger area was explored but removal of weed seeds from the dishes was low, especially for the less preferred catchweed bedstraw seeds. These results suggest that crop seeds were “distracting” ants from eating weed seeds; thus, weed seed predation rates might have been higher if the density of crop seeds on the soil surface had been lower. Avoiding cleaning out harvesting machinery in the field or careful adjustment of combines to prevent crop seed loss at the time of harvest may be two strategies to reduce the density of crop seeds on the soil surface and increase weed seed removal. Similarly, the use of machinery designed to grind weed seeds as they come out of the combine (e.g., Harrington Seed Destructor; Jacobs and Kingwell Reference Jacobs and Kingwell2016) could also decrease the amount of weed and crop seed returning to the soil surface after harvest and prompt ants to search a wide area of the field and be less selective concerning the weed seeds they harvest.
Background seed density: crop, rigid ryegrass, and total seed density (seeds m−2) in each field and sampling date.

Contrary to our expectations, straw did not seem to be an obstacle for ants in locating or exploiting weed seeds located underneath the straw on the first sampling date. Straw did not seem to be a barrier to ant movement and did not prevent foraging or dish encountering. This result is encouraging, because it means that seed loss to predation right after crop harvest is not being limited by straw, and straw management by farmers therefore does not require any changes (Spafford Jacob et al. Reference Spafford Jacob, Minkey, Gallagher and Borger2006).
Long-Term Seed-Removal Rates
Long-term seed loss to predators calculated following Equations 2 and 3 was 60%, 65%, and 62% for rigid ryegrass and 47%, 55%, and 44% for catchweed bedstraw in Vilanova de Bellpuig, Balaguer, and Algerri, respectively. Westerman et al. (Reference Westerman, Atanackovic, Royo-Esnal and Torra2012) reported that 25% to 40% of rigid ryegrass seeds are shed at the time of harvest; thus, predation rates during the fallow period such as those reported here are likely to have a large impact on populations of this species. Loss may be even higher if combined with predation rate before harvest (0.67 for rigid ryegrass; Westerman et al. Reference Westerman, Atanackovic, Royo-Esnal and Torra2012). There is less information about seed-shed timing of catchweed bedstraw in semi-arid systems. A close relative, false cleavers (Galium spurium L.), sheds most of its seeds before harvest and has high levels of predation before the summer fallow (Westerman et al. Reference Westerman, Atanackovic, Royo-Esnal and Torra2012). Removal rates during the summer months could help further decrease the number of seeds of this species entering the seedbank.
Seed Fate in the Tilled Area
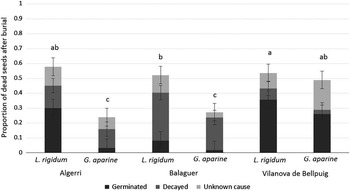
The interaction of the effects of weed species and field on seed mortality in the soil was significant. Proportions of dead seeds are shown per field and weed species separately in Figure 3. Seed mortality due to burial was highly variable across the fields and ranged from 52% to 58% for rigid ryegrass and from 24% to 50% for catchweed bedstraw. Rigid ryegrass seed mortality was significantly greater than for catchweed bedstraw seeds, except in Vilanova de Bellpuig. Rigid ryegrass seed loss caused by burial was significantly higher in Vilanova de Bellpuig and Algerri compared with Balaguer, whereas catchweed bedstraw mortality was significantly higher in Vilanova de Bellpuig compared with the other two fields. Main causes of mortality also differed across fields. Whereas germination was the most important cause of weed seed loss in Vilanova de Bellpuig, in the other fields, and especially in Balaguer, seed decay was the main cause of mortality. Differences in causes of mortality were unexpected and remain unexplained, as we lack information about soil properties and microbial activity in those fields. Future research should explore seed mortality due to decay during summer and the main factors driving it, since decay can be a major factor in weed seed mortality.
Seed loss due to germination, decay, and unknown causes for every field and weed species. Bars represent SEs. Bars with different letters are significantly different (P<0.05).

Seed mortality due to burial (germination plus decay) was unexpectedly high considering the relatively short period of time the seeds were buried (Boyd and Van Acker Reference Boyd and Van Acker2003; Chauhan et al. Reference Chauhan, Gill and Preston2006). However, both of the species we used are considered to have transient weed seedbanks and a relatively low persistence in the field, which may partially explain the high losses observed (Barralis et al. Reference Barralis, Chadoeuf and Lonchamp1988; Goggin et al. Reference Goggin, Powles and Steadman2012; Jensen 2009). High precipitation rates during this particular summer in all locations may also have prompted exceptionally high germination rates; this probably would not have occurred in a normal dry year. High moisture levels are also known to favor microbial activity and prompt seed decay (Wagner and Mitschunas Reference Wagner and Mitschunas2008), which could also have contributed to the high seed losses reported here. Survival rates in the soil of other important weed species in cereal systems with more persistent weed seedbanks, such as corn poppy (Papaver rhoeas L.) or common lambsquarters (Chenopodium album L.), should be expected to be higher than those reported for rigid ryegrass and catchweed bedstraw, and extending seed exposure to predators may be even more important to decrease those species’ seedbanks.
Overall, the results of this experiment showed that long-term seed loss due to predation was higher than loss caused by seed burial. This suggests that tilling the field immediately after crop harvest would have resulted in higher weed seed survival rates compared with leaving seeds on the soil surface exposed to predators. Both for transient and for more persistent weed seeds, leaving the fields untilled throughout the summer and maximizing seed exposure to predators seems to be the optimum weed management strategy during the fallow period in these systems. Decreasing the density of crop seeds on the soil surface by carefully adjusting the harvesting equipment has the potential to increase weed seed mortality to predation even further.
Acknowledgments
We would like to thank the farmers, A. Pollino, M. Teres, and J. Balaguero, who allowed us to use their fields for this experiment. We also want to thank Eva Edo and Laia Mateu for their valuable help on the preparation of this experiment. Funding was provided by Generalitat de Catalunya, Ajuts per incentivar la recerca aplicada en matèria de producción agroalimentària ecològica (Ref: 2012 AGEC 00040).