Implications
Results from this study provide a better understanding of the factors associated with selling price, hence helping producers to make more informed management decisions. Examples include deciding when the optimal selling time to maximise returns, as well as, choice of sire breed. Estimated regression coefficients from this study could be included in bio-economic models to evaluate alternative production systems and provide more accurate estimation of economic values for inclusion in breeding objectives.
Introduction
In Ireland, livestock marts are an important marketing outlet for cattle. Approximately 1.5 million cattle, or 66.7% of total cattle movements, are sold through livestock marts annually (Department of Agriculture, Fisheries and Food (DAFF), 2008). A large amount of crossover occurs between the dairy and beef herds, with 29% of dairy cows mated to the traditional British beef breeds (Aberdeen Angus and Hereford) and 15% mated to the continental breeds: Charolais, Limousin and Belgian Blue (DAFF, 2008). Several factors affect the price of animals sold through livestock marts (Faminow and Gum, Reference Faminow and Gum1986; Schroeder et al., Reference Schroeder, Mintert, Brazle and Grunewald1988; Troxel and Barham, Reference Troxel and Barham2007). For example in Kansas it was concluded that purchasers were willing to pay a premium for healthy, well muscled, polled, castrated Hereford × Charolais cross steers, with large frames, that were yellow or yellow and white faced, and sold in lots of up to 60 head (Schroeder et al., Reference Schroeder, Mintert, Brazle and Grunewald1988).
Nevertheless, little is known on the association between animal price and other factors such as dam age, heterosis, recombination, calving difficulty, and whether the animal was a singleton or twin, or how these factors may interact with selling price. Also, few studies (Dal Zotto et al., Reference Dal Zotto, Penasa, De Marchi, Cassandro, Lopez-Villalobos and Bittante2009) have attempted to quantify the factors associated with animal price in Europe. Furthermore no study has evaluated the correlation between the prices paid for the same animal over its lifetime.
The objective of this study was to determine the factors associated with selling price received for cattle in Irish livestock marts. Results from this study will provide a better understanding of the phenotypic characteristics associated with selling price, thereby aiding for future management decisions. Examples include helping producers decide if the use of sex semen is economically viable, when is the optimum time to sell animals, and which breeds should be used to maximise the profit. Estimated regression coefficients from this study could be included in bio-economic models to evaluate alternative production systems and provide more accurate estimation of economic values for inclusion in breeding objectives.
Material and methods
Animal Care and Use Committee approval was not obtained for this study because all data were from the pre-existing database infrastructure operated by the Irish Cattle Breeding Federation (ICBF) database (Bandon, Co. Cork, Ireland). Data included live-weight and price information collected from livestock marts. Data on sire and dam identification number, as well as calving date, degree of calving assistance, age of dam, parity of dam and breed proportion were also available from pre-existing databases.
Data editing
A total of 2 967 791 records with information on live-weight and/or selling price on 2 506 110 animals sold at 71 livestock marts between 2000 and 2008, were extracted from the ICBF database. Livestock marts, here on referred to as ‘marts’, are permanent livestock auction venues located around Ireland. The 71 marts included in this study represent the vast majority of livestock marts within the Republic of Ireland.
Data were divided into four distinct maturity categories, described later: calves, weanlings, post-weanlings, and cows. To accurately quantify associations, only animals sold individually at the livestock marts were retained; 28% of animals in the dataset were sold in groups. Animals were discarded if their herd of origin, mart of sale, sale price or live-weight were unknown; live-weight information was not available on calves but the price was known. Progeny of dams calving greater than 22 months from the median age within parity were discarded. Animals retained had to have at least 66% of their breed fraction known. Animals were subsequently classified into seven main breed categories according to the dominant breed composition of the animal (proportion of each breed composition required in parenthesis, along with breeds considered for inclusion within each category): purebred dairy animals (>90%, Holstein, Friesian, Montbeliarde, Normande, Norwegian Red, excluding Jerseys), purebred beef animals (>90%, Aberdeen Angus, Belgian Blue, Charolais, Hereford, Limousin and Simmental), dual-purpose dairy animals (33% to 66%, Montbeliarde, Normande and Norwegian Red), crossbred British beef animals (33% to 66%, Aberdeen Angus and Hereford), crossbred Continental beef animals (33% to 66%, Belgian Blue, Charolais, Limousin and Simmental), Jersey (33% to 66%), or ‘other’. Within each maturity category, price and live-weight records more than ±4 s.d. from the mean, within breed group, were discarded. As many animals go through marts more than once in their lifetime only the first recorded date in time for calves, weanlings and post-weanlings were retained; for cows the last recorded date in time was retained.
Calves
In Ireland, calves from dairy herds are generally sold in livestock marts from a couple days of age. Not all calves are sold in livestock marts and some are sold privately among individuals; no data on these sales were available. In this study calves were defined as animals from dairy cows sold between two days and 12 weeks of age. Only animals sold between €2 and €450 were retained. After all edits 53 838 calves remained.
Weanlings
Animals from beef cows are weaned at approximately 8 months of age at which time a large proportion are sold in livestock marts. In this study weanlings were defined as animals from beef cows (breed proportion >66% beef) sold between 6 and 12 months of age. Only weanlings weighing between 150 and 600 kg and sold for a price between €200 and €1200 were retained. After all edits 19 972 weanlings with price and live-weight data remained.
Post-weanlings
Post-weanlings were defined as animals from dairy and beef cows sold between 12 and 36 months of age. Animals were limited to weights between 200 and 1000 kg and sold for a price between €200 and €1500. After all edits 93 081 post-weanlings with price and live-weight data remained.
Cows
Cows were defined as animals that had calved at least once or were greater than 30 months and less than 12 years of age when sold. Only cows weighing between 300 and 1000 kg and sold between €75 and €1500 were retained. After all edits 94 839 animals with price and live-weight data remained.
Cows sold through livestock marts, in Ireland, include cull cows destined for slaughter, cows sold in calf, and cows not in calf when sold but that calved sometime in future (replacements). Accordingly, cows were classified both on their fate post-sale and, as a separate variable, on the number of days since last calving. Fate post-sale was categorised based on four possibilities. Where data on next calving were known, cows were grouped in days to next calving: less than 50 days; 51 to 100 days; 101 to 200 days; 201 to 300 days and greater than 300 days. Cows that were destined for slaughter were grouped into five groups: cows slaughtered within 3 days post-sale; 4 to 50 days; 51 to 100 days; 101 to 200 days; 201 to 300 days and greater than 300 days. Cows that had not been allocated to any of these categories above, but were sold within 280 days of the date of data extraction, were allocated a separate code, as their fate post-sale could not be determined. Additionally, cows with no known fate post-sale (i.e. did not calve again; were not slaughtered post-sale and were not sold within 280 days of the date of data extraction) were coded separately. Where cows calved again in their lifetime but were eventually slaughtered, fate post-sale based on subsequent calving took precedence over fate post-sale based on slaughter.
Cows were also grouped on their days since last calving at the time of selling; less than 50 days post-calving; 51 to 100 days; 101 to 200 days; 201 to 300 days and greater than 300 days. Females greater than 30 months of age but with no recorded calving date were allocated a separate code.
Data analysis
Factors associated with animal price were determined within each maturity category separately, using mixed models (ASReml; Gilmour et al., Reference Gilmour, Gogel, Cullis, Welham and Thompson2007). All price and live-weight data were normally distributed. In all models mart, date of sale nested within mart, and herd nested within year of sale were included as random effects. Fixed effects considered in all models, irrespective of maturity category were: year of sale (2000 to 2008), month of sale, gender (male or female), age of animal at selling (continuous variable), the proportion of the 12 most common breeds: Aberdeen Angus, Belgian Blue, Charolais, Friesian, Hereford, Holstein, Jersey, Limousin, Montbeliarde, Normande, Norwegian Red, Simmental, calving ease (1 = no assistance/unobserved; 2 = slight assistance; 3 = severe assistance and 4 = veterinary assistance), whether the animal was born as a singleton or twin, heterosis (continuous variable), and recombination loss (continuous variable). Parity of dam (1, 2, 3, 4, ⩾5, missing), and dam age in months relative to the median age within parity, were also tested as fixed effects. Heterosis and recombination loss were calculated for each animal as  and
 , respectively, where sirei and dami are the proportion of breed i in sire and dam, respectively. Breed proportion was treated as a continuous variable with a separate effect fitted in the models for each breed. When calf price was the dependent variable the Normande and Norwegian Red breeds was excluded from the analysis, and for the post-weanlings the Normande, Norwegian Red and Montbeliarde breed proportion were excluded from the analysis because of very few numbers. For weanlings only beef breeds were considered in the analysis. When cow price was the dependent variable, cow parity number and cow age relative to the median age within parity were tested for inclusion in the models.
Up until 2002 direct subsidies in the form of the ‘Special Beef Premium’ were available to farmers under the European Union's CAP. These premiums could be claimed on castrated males twice during their lifetime, at 9 months and 21 months of age. Farmers were able to claim a subsidy per animal up to a maximum of 180 animals, as long as they conformed to, ‘good farming practice code’ and the animals were to be retained on farm for 2 months after claiming. Hence when the dependent variable was weanling and post-weanling price, the number of subsidies left to claim on the animal was also added as a fixed effect. Two variables describing (i) the eventual fate of the sold cow and (ii) date since last calving were also included in the model, when cow price was the dependent variable.
Non-linear associations between price and breed proportion, age at sale, heterosis and recombination were tested. Importance of the non-linear or interaction term was determined based on the F-test as well as graphically evaluating the solutions. Biological plausible interactions between the fixed effects were also tested and where the results were found to be significant the interaction was included in the model. Interactions tested were breed proportion by gender, parity of dam by age of dam relative to median parity age, age of animal by gender and month of sale by year of sale.
A separate series of analysis was carried out with live-weight added as a fixed effect in the model to disentangle the association between the fixed effects and animal price because of the differences in live-weight.
Results
Calves
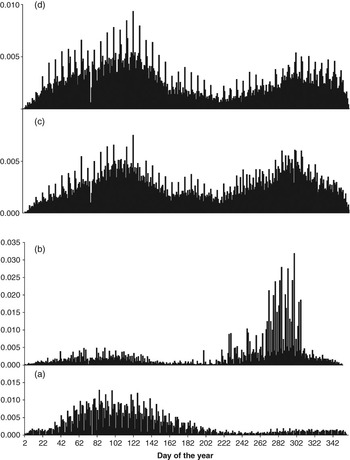
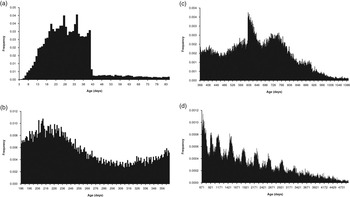
The mean selling price for all calves in the dataset was €157 (s.d. = €79). Majority of calves (57%) were sold between January and April (Figure 1) and 91% of all calves were sold before 42 days of age, with an abrupt drop in sales at day 41 (Figure 2). Approximately 18% of calves sold through the mart received assistance at birth.
Frequency distribution of proportion of animals sold on each day of the year (day 1 = 1 January, from 2000 to 2008) for each of the four maturity categories (a) calves; (b) weanlings; (c) post-weanlings and (d) cows.

Frequency distribution of age at sale for (a) calves; (b) weanlings; (c) post-weanlings and (d) cows.

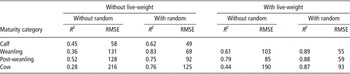
The fixed effects included in the model explained 45% of the overall variation in calf price (Table 1). When the random effects of mart, herd of origin and day of sale were included, the proportion of variation explained increased to 62%.
Proportion of variation explained (R 2) and RMSE in euros of the developed multiple regression models for price for each maturity category with or without the inclusion of random effects and with or without live-weight included in the model

RMSE=root mean square error.
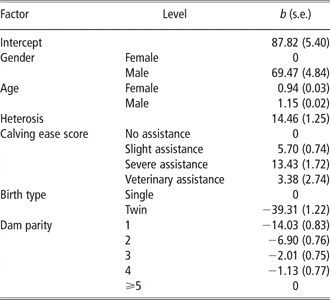
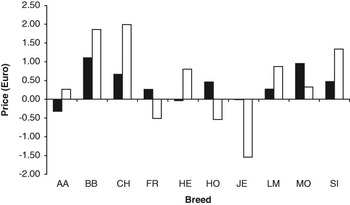
Crossbred, male, singleton calves from older cows received a price premium, and the price paid increased linearly with age (Table 2). The association between age and price differed by gender, with a greater increase in males (€1.15 per day of age) compared with females (€0.94 per day of age). The difference in calf price from different parity dams was small, with the exception of calves from first parity cows (€14.03 less than calves from mature cows). Other factors that had a significant association (P < 0.001) with calf price were year of sale (results not shown), dam age relative to the median age within parity (results not shown), and breed of the calf that differed by gender of the calf (Figure 3). Purchasers paid a premium for calves from dams that calved younger than their counterparts. Each 1% increase in Belgian Blue proportion was worth an extra €1.86 in males compared with €1.11 in females (Figure 3). A similar magnitude was found for Charolais, with an extra €1.99 for males and €0.66 in females, while a 1% increase in the Aberdeen Angus proportion resulted in −€0.32 in female calves. Least square means for calf price for a purebred, Holstein, male, singleton calf from a fifth parity cow with no calving difficulty sold at 28 days of age varied from €120.20 in July to €160.62 in January.
Regression coefficients (b in Euros; s.e. in parenthesis) on factors associated (P < 0.001) with calf priceFootnote a

s.e.=standard error.
a Solutions for association with breeds are shown in Figure 3.
Change in calf price per 1% increase in breed proportion for female (▪) and male (□) calves across breeds. AA = Aberdeen Angus; BB = Belgian Blue; CH = Charolais; FR = Friesian; HE = Hereford; HO = Holstein; JE = Jersey; LM = Limousin; MO = Montbeliarde and SI = Simmental.

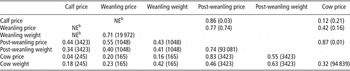
The correlation between calf price and post-weanling price was moderate (0.44, Table 3). The correlation between calf price and weanling price could not be estimated as only dairy calves and beef weanlings were used in the analysis, respectively, and therefore there was no animal in both maturity categories. Each €1 increase in calf price was associated with a €0.86 increase in post-weanling price (Table 3).
Regression (above diagonal; s.e. in parenthesis) for price as well as the correlations (below diagonal) between prices and live-weight across and within the maturity categories and number of records used in parenthesisFootnote a

s.e.=standard error.
a Where regressions were calculated between two ages the older age category was regressed on younger age.
b NE=non estimatable, not estimatable because no common animals between the two age categories as all calves were from dairy cows and weanlings were from beef cows.
Weanlings
The mean selling price for weanlings was €580 (s.d. = €165). Peak weanling sales occurred between mid-August and mid-October when 54% of weanlings were sold (Figure 1) and the average weanling was sold at 244 days of age (Figure 2). The model that included live-weight and three random effects explained 89% of the variation in weanling price (Table 1). The root mean square error (RMSE) was €55 indicating that 68% of all predicted prices were within ± €55 of the actual price.
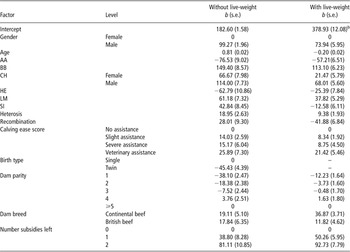
Factors associated with the selling price of weanlings are summarised in Table 4. Purchasers paid premium prices for crossbred, male, singleton weanlings. Price paid for weanlings increased by €0.81 per day of age and did not differ by gender. Only the association between the Charolais breed and price differed by gender, with a 1% unit increase in proportion Charolais associated with an increase in price paid of €1.14 and €0.67 for the males and females, respectively. Although only a small proportion of weanlings had subsidies left to claim (<2%), number of subsidies, as expected, had a large association with the price received for animals. Relative to where no subsidies remained, weanlings with one and two subsidies remaining were €38.80 and €81.11 more expensive, respectively. When live-weight was included in the model all regression coefficients regressed toward zero. The price difference between males and females reduced with males receiving €73.94 more than females. The association between price and live-weight differed by gender (P < 0.001). Each kilogram increase in live-weight was associated with an increased value of males and females of €1.58 and €1.48, respectively.
Regression coefficients (b in euros; s.e. in parenthesis) on factors associated (P < 0.001) with weanling price without live-weight included in the multiple regression model (without live-weight) and with live-weight included in the multiple regression model (with live-weight)Footnote a

s.e.=standard error.
a AA = Aberdeen Angus; BB = Belgian Blue; CH = Charolais; HE = Hereford; LM = Limousin; SI = Simmental.
b Intercept presented is based on the average live-weight (kg) of all weanlings.
Progeny from dams that calved at a younger age relative to the parity media earned a premium over their older calving counterparts. Highest prices for weanlings were paid in the spring months (February, €544) but declined thereafter until mid-summer and rose steadily again in the autumn (August, €604).
The correlation between weanling price and live-weight was strong (0.71). The correlation between weanling price and post-weanling price was moderate (0.55). Each Euro difference in price paid for weanlings was associated with a €0.77 difference in post-weanling price.
Post-weanlings
The mean price for all post-weanling was €655 (s.d. = €185). Peak post-weanling sales occurred in two main periods across the year; spring (February to April; 29% of animals) and autumn months (August to October; 29% of animals, Figure 1). About 42% of post-weanlings sold were between 600 and 780 days of age (Figure 2). The developed model (i.e. including live-weight and the random effects) for post-weanling price explained 88% of the variation, with the inclusion of live-weight accounting for 13% to 27% marginal increase in the proportion of variation explained (Table 1).
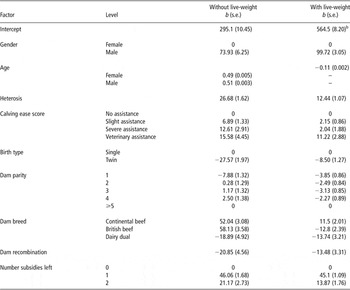
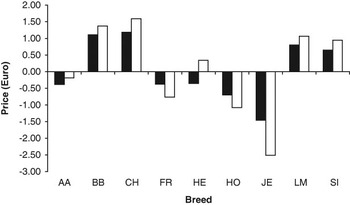
Factors associated with post-weanling price are summarised in Table 5 and Figure 4 (the interaction between breed of post-weanling and gender). Premium prices where paid for male, singleton, post-weanlings that were born from beef dams, with little differences in price paid for progeny of British or Continental beef dams. The association between age and price differed by gender (P < 0.001), although biologically the interaction was small, with a greater increase in price for males (€0.51 per day of age) than females (€0.49 per day of age). When post-weanling price was adjusted for live-weight a greater difference between the breed of origin of dam was noted, with progeny from Continental dams receiving a premium of €24.30 over progeny from British beef dams. The association between price and live-weight differed (P < 0.001) by gender. For each 1 kg in live-weight, males earned an additional €1.40 and females €1.34. Similar to both the calves and weanlings, dams that calved younger than their counterparts had more expensive progeny. The association between price and breed by gender is shown in Figure 4. Beef post-weanlings received a premium price over their dairy counterparts. The greatest price differential between genders was noted for the male and female Jerseys. With each 1% increase in proportion Jersey, males received −€2.51 compared with −€1.46 for females.
Regression coefficients (b in Euros; s.e. in parenthesis) on factors associated (P < 0.001) with post-weanling price without live-weight included in the multiple regression model (without live-weight) and with live-weight included in the multiple regression model (with live-weight)Footnote a

s.e.=standard error.
a Solutions for the association between breed and gender are shown in Figure 4.
b Intercept presented is based on average live-weight (kg) of all post-weanlings.
Change in post-weanling price per 1% increase in breed proportion in female (▪) and male (□) calves across breeds. AA = Aberdeen Angus; BB = Belgian Blue; CH = Charolais; FR = Friesian; HE = Hereford; HO = Holstein; JE = Jersey; LM = Limousin and SI = Simmental.

Live-weight explained 55% of the variation in post-weanling price, as indicated by the correlation between post-weanling price and live-weight (Table 3).
Cows
The average selling price of all cows was €592 (s.d. = €254). Cows were sold during two main phases throughout the year, spring (January to March; 25%) and autumn months (September to November; 20%, Figure 1). Heifers and first parity cows accounted for 40% of total cow numbers sold through the marts, with mature cows (⩾5 parity) accounting for a further 25% (Figure 2). The regression model including live-weight and the random effects had the best fit with a coefficient of determination of 87% (Table 1).
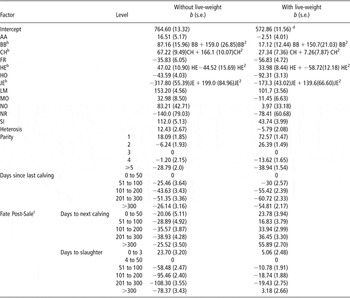
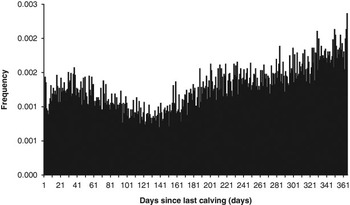
Factors associated with cow price are detailed in Table 6 and Figure 5 (days since last calving). Freshly calved cows (calved within 50 days of sale) received greater prices than other cows, with heifers selling for greater prices than mature cows. The fate of cows post-sale had a large bearing on the price, with cows that were slaughtered within 3 days post-sale receiving the greatest prices. Each kilogram increase in live-weight was associated with an increased value of cows by €1.28. Cows that calved close to median parity age received greater prices than cows that calved earlier or later than their counterparts. The distribution of days post-calving (0 to 365) when cows were sold is illustrated in Figure 5; 76% of cows were calved at least 300 days when sold. Majority of cows were retained on farm post-sale for a fattening period before slaughter; however, a small proportion (10%) was slaughtered within 3 days of being sold. Monthly fluctuations in price were evident. The price received for a mature Holstein-Friesian cow varied from a low in December (€539) to a peak in April (€646).
Regression coefficients (b in Euros; s.e. in parenthesis) on factors associated (P < 0.001) with cow price without live-weight included in the multiple regression model (without live-weight) and with live-weight included in the multiple regression model (with live-weight)Footnote a,Footnote b

s.e.=standard error.
a AA = Aberdeen Angus; BB = Belgian Blue; CH = Charolais; FR = Friesian; HE = Hereford; HO = Holstein; JE = Jersey; LM = Limousin; MO = Montbeliarde; NO = Normande; NR = Norwegian Red; SI = Simmental.
b Quadratic regression coefficient for breed proportion of Belgian Blue, Charolais, Herefords and Jerseys were different from zero.
c All groups compared to the price received for cows slaughtered within 50 to 99 days post-sale.
d Intercept presented is based on the average live-weight (kg) of all cows.
Frequency distribution of days since last calving for cows sold between 0 and 365 days.

There was a weak correlation between cow price and prices from the other maturity categories, with the exception of post-weanling price category. There was a weak correlation (0.32) between cow live-weight and price (Table 3).
Discussion
Livestock marts remain an important focal point for cattle trading within Ireland. Through information available on individual animal live-weight and price from livestock marts, and animal information available from the national database, it was possible to estimate the relative importance of factors associated with livestock price. Phenotypic and breed factors were shown to explain a large proportion of the variation in selling price of differently aged animals.
The population statistics in this study agreed with statistics in other related studies. The proportion of cows that received assistance at calving, 18.0%, across dairy and beef cows, is within the ranges reported by Mee (Reference Mee2008) from studies reviewed across nine countries on dairy cows and heifers. The average twinning rate varied across maturity categories from 2% to 4%, which is similar to (inter)national estimates (Dematawewa and Berger, Reference Dematawewa and Berger1997; Silva del Rio et al., Reference Silva del Rio, Stewart, Rapnicki, Chang and Fricke2007; Mee et al., Reference Mee, Berry and Cromie2008). The overall sex ratio in this study across all maturity categories, with the exception of cows was 50.4% males, 49.6% females. This is similar to the secondary sex ratio reported elsewhere (Berry and Cromie, Reference Berry and Cromie2007).
The statistical model
The fixed effects (excluding live-weight) used in this study explained up to 52% of the variation in selling price across the different maturity categories, although the proportion of variation increased by 16% to 27% when live-weight was included and a further 9% to 43% when the random effects were included. The variance attributed to mart and mart date includes differences between prices on different days, for example the presence of victuallers that, on average, prefer heifers or the presence of exporters that select certain breeds. Nonetheless, the RMSE was relatively high indicating that, although the proportion of variation explained was high there was still a considerable biological variation in the residuals. No information was available in this study on factors such as animal colour, muscle thickness, horn status, health and body condition that have already been shown to be associated with calf, steer, heifer and bull price (Schroeder et al., Reference Schroeder, Mintert, Brazle and Grunewald1988; Barham and Troxel, Reference Barham and Troxel2007; Troxel and Barham, Reference Troxel and Barham2007). Although some of these factors would be intrinsically assumed in the random effect of herd of origin nested within year of sale, some would also be animal specific and therefore their addition in a model may have improved the proportion of variation explained.
Seasonal effects
The large proportion of dairy calves in this study sold in the spring months with a smaller proportion sold in the autumn months reflects the calving pattern in Irish dairy herds. Irish dairy herds predominately operate a seasonal production system; 69% calve between January and March and a further 8% between October and December (DAFF, 2008). A similar pattern is observed in beef cows, with 42% calving in the spring and 9% in the winter months. Trends in the distribution of day of sale for weanlings across the year also reflect this calving pattern with weaning occurring at approximately 8 months of age in Ireland.
The post-weanling production system, in Ireland, is based on maximising grass utilisation. After weaning, animals are usually housed over the winter months and turn out onto pasture coincides with the start of grass re-growth in mid-spring (Drennan and McGee, Reference Drennan and McGee2009). Animals usually remain on pasture until the following winter when they are re-housed when grass growth ceases. The two peaks in sales of post-weanlings in the spring and autumn months (Figure 1) coincide with the period after winter housing or before final finishing. These peaks also correspond with the time of year when demand for grass is at its greatest so farmers may sell or purchase surplus animals to help with grassland management.
The increase in cow sales in the spring months may be due to a multitude of factors including management of milk-quota or the culling of cows that experienced difficulties in the peri-partum period. The peak in cow sales in the autumn corresponds with end of lactation for dairy cows (Figure 5) and weaning for the beef cows when most calves are sold.
The spikes in sales within the overall distribution of day of sales (Figure 1) correspond to Mondays, the day of the week when a large proportion of mart animals are sold; 69% of calves were sold on a Monday. Apart from the Christmas period the only other day where all marts are closed is the holiday that falls around St Patrick’s Day (17 March), a uniquely Irish occurrence.
Association with age and gender
Mandatory health testing for tuberculosis is undertaken on each herd annually on all animals. Before the sale of animals greater than 6 weeks of age, testing for tuberculosis antibodies is required in Ireland. The abrupt drop in sales of calves at day 41 of age (Figure 2a) indicates that most farmers sell calves before incurring the cost of tuberculosis testing. A large increase in weanling numbers sold at approximately 8 months of age coincides with weaning in the autumn months, when farmers in cow and calf systems of production sell. Under the EU beef subsidy scheme the second subsidy for cattle could be claimed on animals over 20 months of age. This is the reason for the sudden increase in the number of post-weanlings sold at approximately 600 days of age. Although the subsidy scheme was abolished in 2002 the effect persisted in subsequent years, most likely due to farm management adapted to the beef subsidy scheme, although it has diminished somewhat in the more recent years. In seasonal calving systems farmers try to maintain a compact calving with a 365-day calving interval so that cows calve in increments of 12 months from 24 months of age onwards. The peaks in cow age at sale (Figure 2d) coincide with peak sales at calving and drying off agreeing with trends observed in this study (Figure 5) and also in seasonal calving herds in New Zealand (Berry et al., Reference Berry, Harris, Winkelman and Montgomerie2005).
The greater prices paid for male calves, weanlings and post-weanlings are consistent with other studies (Troxel et al., Reference Troxel, Gadberry, Cline, Foley, Ford, Urell and Wiedower2002; Barham and Troxel, Reference Barham and Troxel2007). This difference in price reflects the greater live-weights and growth rates of males. Holland and Odde (Reference Holland and Odde1992) reported that males were 2.5 kg heavier at birth than females and this difference is expected to increase to approximately 19 kg at weaning (Pell and Thayne, Reference Pell and Thayne1978; Leighton et al., Reference Leighton, Wilham and Berger1982). When live-weight was included in the model in this study, the difference between genders diminished, substantiating the influence of live-weight on the difference in price between genders. However, gender remained significant even after adjusting for live-weight indicating that factors other than live-weight are responsible for differences in prices among gender; for example greater future potential growth rates achievable by males.
As expected, all other things being equal, greater prices were paid for older calves, weanlings and post-weanlings agreeing with earlier studies (Dal Zotto et al., Reference Dal Zotto, Penasa, De Marchi, Cassandro, Lopez-Villalobos and Bittante2009), although the association differed with gender for calves and post-weanlings. This is likely attributable to older animals weighing more. However, when live-weight was added to the models for weanlings and post-weanlings the association with age became negative indicating farmer preference for heavier animals at a younger age (i.e. faster growing animals).
Although greater prices were paid for older animals, the unit change in price per day of age was not constant across years. The change in price per unit change in age of calves across sexes varied from €0.54 in year 2008 to €1.93 in year 2004, with the exception of year 2001 when the price was −€0.21. In 2001, a foot and mouth disease outbreak occurred in Ireland, which resulted in a temporary export ban on livestock to the EU. With a large proportion of dairy animals exported before 6 months of age this had a large effect on calf sales. The change in price per unit change in age has been increasing steadily across the years, €0.35 (2001) to €0.87 (2008) and €0.38 (2001) to €0.64 (2008), for weanlings and post-weanlings, respectively. Although average associations between age and price across years are presented in this study and this can provide information for farmers on the revenue attainable for each day the animal is retained on farm, farmers should consult prevailing price trends and monitor the associated costs when evaluating the consequences of delaying selling. This is also true when including such values in bio-economic models and in deriving economic values.
Breed and non-additive effects
As the breed proportion of an animal is unknown to the purchaser at the time of sale, the reported associations between price and breed proportion in this study is based solely on the purchaser’s judgement of breed rather than actual breed composition. Barham and Troxel (Reference Barham and Troxel2007) concluded that when purchasing light cattle, breed and colour were the two most important factors that purchasers used to predict for future performance of the animals. In this study irrespective of maturity category premium prices were paid for beef continental crossbred animals. Similar to the findings of Dal Zotto et al. (Reference Dal Zotto, Penasa, De Marchi, Cassandro, Lopez-Villalobos and Bittante2009) price paid increased as the proportion of beef blood in the animal increased. Clarke et al. (Reference Clarke, Drennan, McGee, Kenny, Evans and Berry2009) reported that beef weanlings and post-weanlings were heavier than dairy breeds and this was also reflected in greater muscularity scores in the animals. Better kill-out percentage, greater muscularity, better carcass conformation and greater live-weight were also associated with beef breeds (Keane, Reference Keane2003; Campion et al., Reference Campion, Keane, Kenny and Berry2009; Clarke et al., Reference Clarke, Drennan, McGee, Kenny, Evans and Berry2009) relative to their dairy contemporaries. The higher prices across all maturity categories in this study for the Charolais and Belgian Blue animals is consistent with the superior carcass traits and live-weights that have been reported for these two breeds (Alberti et al., Reference Alberti, Panea, Sanudo, Olleta, Ripoll, Ertbjerg, Christensen, Gigli, Failla, Concetti, Hocquette, Jailler, Rudel, Renand, Nute, Richardson and Williams2008; Campion et al., Reference Campion, Keane, Kenny and Berry2009; Clarke et al., Reference Clarke, Drennan, McGee, Kenny, Evans and Berry2009). As many of the female dairy animals that are purchased through the marts are likely to be retained as replacements, this was reflected in the premium prices paid for dairy females compared with their male counterparts, similar to the findings of Dal Zotto et al. (Reference Dal Zotto, Penasa, De Marchi, Cassandro, Lopez-Villalobos and Bittante2009).
The association between heterosis and price was positive and the size of the association increased with maturity category, reflecting purchaser’s preference for crossbred animals. Heterosis has been shown to increase birth live-weight, reduce calving difficulty and increase milk yield (Laster and Gregory, Reference Laster and Gregory1973; Holland and Odde, Reference Holland and Odde1992; McGee et al., Reference McGee, Drennan and Caffrey2005). When live-weight was added to the model the association between heterosis and price remained significant indicating that factors other than live-weight were responsible for the increase in price with increased heterosis.
Dam parity and age within parity
Greater prices were paid for calves, weanlings, and post-weanlings from older parity cows, having corrected for live-weight. Although, greater milk yields associated with older cows may explain the greater prices received for beef weanling and post-weanling, it does not explain the greater prices for the dairy calves, which are generally removed from their dam immediately at birth. However, mature cows may have a better uterine environment that can support the nutritional requirements of the foetus (Elzo et al., Reference Elzo, Quaas and Pollak1987; Holland and Odde, Reference Holland and Odde1992; Berry et al., Reference Berry, Lonergan, Butler, Cromie, Fair, Mossa and Evans2008). Previous estimates have shown that calves from 2-year-old cows are, on average, 3.5 kg lighter than calves from 5 to 8 year old cows (Elzo et al., Reference Elzo, Quaas and Pollak1987; Holland and Odde, Reference Holland and Odde1992).
Calving performance
Singleton calves have been shown to be 10% heavier at birth than their twin counterparts (Gregory et al., Reference Gregory, Echternkamp, Dickerson, Cundiff, Koch and Van Vleck1990; Holland and Odde, Reference Holland and Odde1992) and have greater growth rates pre-weaning (Hallford et al., Reference Hallford, Turman, Selk, Walters and Stephens1976; Gregory et al., Reference Gregory, Echternkamp and Cundiff1996; Echternkamp and Gregory, Reference Echternkamp and Gregory2002). This was reflected in the greater price paid for singletons and the difference between price paid for singletons and twins was greatest when sold as calves and weanlings. The association between birth number and price was smaller for the post-weanlings, as birth number does not affect growth rate during the post-weanling period (Gregory et al., Reference Gregory, Echternkamp, Dickerson, Cundiff, Koch and Van Vleck1990). When live-weight was added to the model the association between birth number and price was regressed toward 0, indicating that some of the difference in price paid for singletons v. twins was due to differences in live-weight. Earlier studies (Faminow and Gum, Reference Faminow and Gum1986; Schroeder et al., Reference Schroeder, Mintert, Brazle and Grunewald1988; Troxel and Barham, Reference Troxel and Barham2007) have shown that purchasers are willing to pay a premium for bigger, larger framed animals, which was possibly reflected in the greater prices, in this study, paid for animals that experienced calving difficulty. However, owing to the impeded future growth experienced by those calves after veterinary invention (Meijering, Reference Meijering1984), calves that required veterinary assistance did not receive the premium prices that their weanling and post-weanling counterparts received.
Cow fate
There is evidence to suggest that farmers purchasing cows wish to make a quick turnover in profit, as they were willing to pay premium prices for cows that were ready for slaughter within 50 days. A large proportion of cows were slaughtered within 3 days indicated that purchasers, most likely agents for abattoirs, were sourcing cattle at marts.
Correlations across time
The correlations between price and live-weight within maturity category were strong for weanlings and post-weanlings, indicating that live-weight explained 50% to 55% of the variation in weanling and post-weanling price. The association between live-weight and price was weaker in cows, indicating that factors other than live-weight of the animal play a more important role in determining the price.
The regression of prices paid for older animals on prices paid for younger animals was expected to be unity, or greater than unity, or in other words a €1.00 difference between prices paid for younger animals would be reflected in at least €1.00 difference in price for older animals. The regression coefficients in Table 3 suggest that farmers are loosing money if they purchase animals at a certain age and sell through the marts at an older age. However, data from 2008 shows that for each extra Euro paid for a calf was reflected in €1.02 increase in post-weanling price and the trend was similar across the other maturity categories. Hence the lower regression when all years were examined maybe an artefact of the EU beef subsidy system.
Conclusions
A number of phenotypic and genetic factors are associated with the overall selling price of animals in livestock marts. Factors such as breed, live-weight, birth type, calving difficulty, heterosis, age, gender and age of dam were shown to have varying associations with the price achievable for an animal. Although prices did not remain constant across years, similar seasonal trends emerged in the age of animal at sale and time of year. Knowledge of these factors and the seasonal trends in sales can help farmers to maximise prices attainable for their animals and thus the profitability of their production system.