


Citizens’ personal attributes and attitudes have long been the dominant explanations of individual electoral turnout and vote choice. An innovative and growing body of work demonstrates, however, that many individual voting decisions arise not through the individual’s own attributes, but rather through social influence—when one’s political behavior depends on that of their associates. Our friends, family, and coworkers help us to learn about politics (Ahn et al. Reference Ahn, Huckfeldt, Mayer and Ryan2013; Eveland and Hively Reference Eveland and Hively2009), influence whether we participate in politics (Klofstad Reference Klofstad2010; McClurg Reference McClurg2006; Mutz Reference Mutz2006; Nickerson Reference Nickerson2008; Rolfe Reference Rolfe2012), and help us decide how to vote (Richey Reference Richey2008; Ryan Reference Ryan2011; Sinclair Reference Sinclair2012; Sokhey and McClurg Reference Sokhey and McClurg2012).
People are connected to one another in a large social network, but most research on social influence in voting focuses on only a few close relationships. People often form hundreds of interpersonal relationships—friends, families, coworkers, neighbors—and are connected to even more individuals through a series of intermediaries—friends’ families, coworkers’ neighbors, and so on. Compelling theories suggest this extended social network exerts important influence on individual decisions (e.g., Siegel Reference Siegel2009; Reference Siegel2013), but measurement challenges have impeded their empirical examination. Most observational work on the subject relies on survey batteries asking respondents to identify the three to five people with whom they talk most frequently. These batteries cannot possibly include all of the relevant associates with whom a respondent interacts, nor can they measure effects of associates’ friends and other people they are connected to only through intermediaries. Thus, the extended social network’s influence on voting has received little attention. Though our friends and family may indeed exert the strongest social influence in our lives, they comprise only a small subset our relationships—and we know little about whether and how these remaining relationships influence voting (Eulau Reference Eulau1980).
We focus on one mechanism by which these relationships may influence voting, exploring the extent to which individuals' turnout and vote choice depend on their social proximity to elites—the number of intermediaries in the social network between individuals and political elites such as candidates running for office. We rely on three datasets that allow us to measure this social proximity. The first two rest on newly-discovered historical records that reveal the individual votes of all electors in the 1859 statewide elections in Alexandria, Virginia and the 1874 local elections in Newport, Kentucky. Nineteenth century Virginia and Kentucky employed viva voce election law, requiring all votes to be cast by voice at assigned polling places. Every voter’s preference for every office was thus recorded by election clerks. Alexandria and Newport are the only two cities under this voting law for which the complete poll books have been recovered. We have conducted archival work to pair these individual votes with detailed profiles for all known inhabitants of these mid-sized U.S. cities at the times of these elections. Our records reveal inhabitants’ personal attributes such as age, wealth, place of birth and social attributes including religious affiliation, family structure, occupation, and place of residence. Our third dataset comes from a survey of students at the College of William & Mary prior to the 2010 municipal election in Williamsburg, Virginia. This modern election is useful because it shares with the nineteenth century datasets the ability to identify the network locations of potential voters and a candidate running for local elected office.
In each dataset, we show that people who are more proximate to elites in the social network are more likely to vote. When voting, people more proximate to elites from a particular party are more likely to support that party and less likely to support their opponents. Sensitivity analysis and a placebo test suggest these relationships are robust to confounds arising from the clustering of interests and environmental influences within the network. These results suggest that individuals’ voting behavior in state and local elections depends not only on their personal attributes and attitudes, but also the vast social network in which they are embedded. This work contributes to the voting literature by specifying a mechanism through which not only individuals’ close associates, but also their extended networks, influence individual voting behavior. It also contributes by providing a rare individual-level test of voting theories in an era predating scientific polling.
Social and Atomistic Explanations of Voting
At least since Paul Lazarsfeld and his colleagues from Columbia University surveyed residents of 1940 Erie County, Ohio and 1948 Elmira, New York, empirical studies of political behavior have explored social influence. The Columbia team’s focus on individual communities, with respondents in close proximity to one another, emphasizes the interdependence in individual political behavior (Berelson, Lazarsfeld, and McPhee Reference Berelson, Lazarsfeld and McPhee1954; Lazarsfeld Reference Lazarsfeld1948). The rise of the “Michigan model,” focusing on nationally-representative samples rather than individual communities, obscured this interdependence. Social influence is difficult to observe when individuals under study are treated as atomistic actors, geographically distant and socially isolated from one another. Since The American Voter (Campbell et al. Reference Campbell, Converse, Miller and Stokes1960), the nationally-representative sample has become the dominant paradigm in political behavior research. As a result, our understanding of social influence in voting has developed slowly, relative to the rapid progress made understanding the personal attributes that shape political behavior.
The literature on personal attributes suggests the best predictors of turnout in U.S. national elections are socioeconomic resources such as education, wealth, and occupational status (Leighley and Nagler Reference Leighley and Nagler1992; Verba, Schlozman, and Brady Reference Verba, Schlozman and Brady1995; Wolfinger and Rosenstone Reference Wolfinger and Rosenstone1980) as well as characteristics including race and church membership (for a review of this literature, see Campbell Reference Campbell2013). Resources also predict turnout in local elections, as do other attributes such as age and home ownership (Oliver and Ha Reference Oliver and Ha2007). For candidate choice, the predominant explanations focus on political attitudes such as ideology and partisan identification (Bartels Reference Bartels2000; Campbell et al. Reference Campbell, Converse, Miller and Stokes1960; Campbell, Green, and Layman Reference Campbell, Green and Layman2011). Models of candidate choice also frequently employ as explanatory variables the resources and demographics used to explain turnout (e.g., Miller and Shanks Reference Miller and Shanks1996; Oliver and Ha Reference Oliver and Ha2007). In modern U.S. national elections, economic resources are strongly associated with candidate support (Gelman et al. Reference Gelman, Park, Shor and Cortina2009) and this relationship appears to extend back to the nineteenth century (DeCanio Reference DeCanio2007). Citizens tend to be uninformed about local political issues, but those who show up to vote tend to be highly informed (McLeod, Scheufele, and Moy Reference McLeod, Scheufele and Moy1999). As a result, the predictors of candidate choice in high-information national elections also perform well in local elections (Oliver and Ha Reference Oliver and Ha2007).
Over the last few decades, we have made progress understanding social influence by returning to the community-centered designs pioneered by the Columbia team. Huckfeldt, Sprague, and colleagues reinvigorated this literature with their studies of 1984 South Bend (Huckfeldt and Sprague Reference Huckfeldt and Sprague1995) and 1996 Indianapolis and St. Louis (Huckfeldt, Johnson, and Sprague Reference Huckfeldt, Johnson and Sprague2004). Their surveys include name-generator batteries, which ask respondents to name a handful of individuals with whom they discuss politics. The researchers then interview some of these discussants, allowing them to examine social influence arising between main respondents and their discussants. This methodology provides detailed measurement of a few close relationships, but also comes with a cost. By focusing attention on only a few immediate relationships, name generators obscure social influence arising between less socially-proximate relations.
Social influence is likely to extend well beyond the handful of individuals identified in a name generator. We are all connected in a vast network of relationships. You are connected to your neighbors by geography and your neighbors are connected to their coworkers by occupation. Your neighbors thus act as intermediaries, connecting you to their coworkers. Siegel (Reference Siegel2009) develops a computational model of simulated voters to demonstrate the implications of this point. His model suggests that the influence of direct associates is inexorably intertwined with the extended pattern of relationships in the network. Whether two individuals influence each other depends not only on their dyadic relationship, but also on the pattern of relationships they each hold with others, the pattern of relationships that each of their associates hold with others, and so on. Siegel’s model suggests we can improve our understanding of voting by developing theory that incorporates these extended network effects, combined with more comprehensive measurement of the social network in which individuals are embedded.
A Theory of Social-Proximity Voting
To move toward a better understanding of how networks influence turnout and candidate choice, we focus on the role of elites. Social ties to elites have long played a prominent role in theories of turnout, if not candidate support. People participate when asked and these requests for participation often come from elites’ mobilization efforts (Rosenstone and Hansen Reference Rosenstone and Hansen1993; Verba, Schlozman, and Brady Reference Verba, Schlozman and Brady1995). People are more likely to receive mobilization appeals when they are involved in a variety of civic organizations because these associations lead to more frequent interaction with community leaders and other elites (Verba, Schlozman, and Brady Reference Verba, Schlozman and Brady1995). While this literature has focused on direct contact with these mobilizing elites, we should also expect influence to spread from individual to individual across the network. If you attend church with the county treasurer, she may encourage you to vote, and you may in turn encourage your neighbor to vote. Indeed, several recent studies suggest mobilization appeals influence not only recipients, but also their associates, though the effect dissipates as it spreads from person to person (Bond et al. Reference Bond, Fariss, Jones, Kramer, Marlow, Settle and Fowler2012; Nickerson Reference Nickerson2008).
Thus, we should expect the influence of elites to extend beyond initial recipients, spreading through the network. This expectation is consistent with two prominent studies—Nie, Junn, and Stehlik-Barry (Reference Nie, Junn and Stehlik-Barry1996) and Rolfe (Reference Rolfe2012)—each arguing that individuals’ positions in the social network covary with their levels of personal resources, causing scholars who have focused only on the latter to overlook an important social component of voter turnout. Nie, Junn, and Stehlik-Barry (Reference Nie, Junn and Stehlik-Barry1996) argue that socioeconomic resources influence participation, in part, by strengthening resource-rich citizens’ social connections with elites. Drawing from the terminology of social network analysis, Nie, Junn, and Stehlik-Barry conceive of individuals as nodes in a network, linked together by relationships formed on the basis of geography, occupation, hobbies, and a multitude of other domains. Educated individuals are more central in this network, where network centrality refers to how “well-connected” an individual is relative to others in the network. They argue,
[E]ducational attainment has a profound effect on the positions of individuals by placing them in more- or less-central network positions. Those with higher levels of formal education are substantially more likely to be found closer to the central nodes of politically important social networks, while those with less education are much more likely to be found at the periphery. Citizens who are at the center of society also end up at the center of political networks [45].
In their view, better educated people participate more frequently because education increases individuals’ centrality in society at large, which subsequently increases their social proximity to elites. Better-educated individuals are more central generally because they interact with broader sets of the community; they hold occupations with greater leadership and supervisory responsibilities, accumulate greater wealth, and participate in more voluntary organizations (see also Rosenstone and Hansen Reference Rosenstone and Hansen1993, 80–8). Nie, Junn, and Stehlik-Barry (Reference Nie, Junn and Stehlik-Barry1996, 45) assume this interaction with diverse parts of the network leads to greater interaction with elites, but this assumption warrants testing.
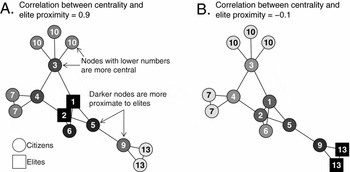
Because people tend to interact with others of similar age, class, and background (McPherson, Smith-Lovin, and Cook Reference McPherson, Smith-Lovin and Cook2001), elites and ordinary citizens are likely to occupy different social spheres. Given the paucity of elites relative to ordinary citizens, the most-connected citizens may still be distant socially from elites. Consider the two hypothetical networks displayed in Figure 1. In part A, the elites (represented by squares) are the most central actors.Footnote 1 Consistent with Nie, Junn, and Stehlik-Barry’s expectations, ordinary citizens (circles) who are more central in this network are also more socially proximate to elites. Consider the third most central individual (Node number 3). She is highly central because she interacts with five people and several of these people also interact with many others. She is also proximate to the elites, interacting with one (Node 1) and only a single intermediary (Node 4) separating her from the other elite (Node 2). In part B, the elites cluster in a separate part of the network. Here an individual’s centrality provides little information about her proximity to elites. Node 3’s centrality remains unchanged from part A, but she is now less proximate to elites because she must pass between three intermediaries (Nodes 1, 5, and 9) before reaching either elite.
Centrality does not Necessarily Imply Social Proximity to Elites

If elites are not the most central actors, centrality and social proximity to elites may have distinct effects on voting. The effect of network centrality should depend on the voting behavior of the most central actors. Individual decisions on whether and how to vote tend to follow those of their social relations (Huckfeldt and Sprague Reference Huckfeldt and Sprague1995; Lazarsfeld Reference Lazarsfeld1948; Rolfe Reference Rolfe2012; Sinclair Reference Sinclair2012). When well-connected people abstain or when they vote Republican, they will encourage many others to abstain or vote Republican as well. Therefore, in elections where the most central actors do not vote, increasing any individual’s centrality should decrease her likelihood of voting (Fowler and Smirnov Reference Fowler and Smirnov2005).
In contrast, we expect social proximity to elites to consistently encourage voting. Social proximity increases people’s access to political information, reducing the costs of voting; it magnifies their voice in the political system, strengthening their sense of political efficacy; and it increases social pressure to vote, which has a powerful effect on turnout (Gerber, Green, and Larimer Reference Gerber, Green and Larimer2008; Panagopoulos Reference Panagopoulos2010). Our first hypothesis follows from these mechanisms:
Elite Proximity-Turnout Hypothesis: Individuals more socially proximate to a city’s elites should be more likely to turnout to vote in elections.
While Nie, Junn, and Stehlik-Barry (Reference Nie, Junn and Stehlik-Barry1996) and Rolfe (Reference Rolfe2012) focus only on the effect of social proximity on turnout, we argue social proximity to elites should also affect candidate support. Individuals with direct relationships with local candidates tend to feel favorably toward these candidates (Oliver and Ha Reference Oliver and Ha2007, 404, footnote 15). These positive feelings should spread throughout the network through informational mechanisms and social pressure. In the informational route, social proximity to strong supporters of a particular party biases the stream of information an individual is likely to receive, producing more favorable messages about the party and less favorable messages about opposing parties (Downs Reference Downs1957; Huckfeldt, Pietryka, and Reilly Reference Huckfeldt, Pietryka and Reilly2014). Likewise, social pressure coupled with the desire to avoid cognitive dissonance (Festinger Reference Festinger1957; Reference Festinger1964), should encourage conformity in voting patterns amongst associates (Huckfeldt, Johnson, and Sprague Reference Huckfeldt, Johnson and Sprague2002; Reference Huckfeldt, Johnson and Sprague2004; Sinclair Reference Sinclair2012). Both of these effects should be strongest for those closest to a party’s elites and dissipate with social distance and proximity to elites from opposing parties:
Elite Proximity-Support Hypothesis I: Individuals more socially proximate to elites from a focal political party should be more likely to support that party in elections.
Elite Proximity-Support Hypothesis II: Individuals more socially proximate to elites from a political party opposing the focal party should be less likely to support the focal party in elections.
RESEARCH DESIGN
To test our hypotheses, we need data identifying the elites and ordinary citizens within a community and relationships connecting these individuals. Previous work on the topic has lacked these data. Nie, Junn, and Stehlik-Barry measure social proximity to elites using survey questions from a nationally representative sample, asking respondents whether they were personally acquainted with various elected representatives and media personnel. They show that people who report more acquaintances with these elites also report voting more frequently, even after controlling for personal resources. Rolfe uses survey data to demonstrate that more central people—measured as respondents who discuss politics with more people—tend to report voting at a higher rate, after controlling for personal resources and attitudes. Nie, Junn, and Stehlik-Barry lack a measure of general centrality while Rolfe lacks elite proximity. Therefore neither study can separate the effect of centrality from that of elite proximity and, without more detailed network data, neither approach can study individuals connected to elites only through intermediaries.Footnote 2
To better specify the relationships among individuals, we must draw from Huckfeldt and colleagues, focusing on small, well-defined communities. Much like the Columbia studies before them, Huckfeldt and colleagues make no claims that their samples are representative of the nation as a whole (Huckfeldt and Sprague Reference Huckfeldt and Sprague1995, 25). Rather, they chose to sacrifice representativeness to better observe the interdependence among their respondents. Since then, studies in the lab (e.g., Ahn, Huckfeldt, and Ryan Reference Ahn, Huckfeldt and Ryan2014; Carlson and Settle Reference Carlson and Settle2016), the field (e.g., Nickerson Reference Nickerson2008; Sinclair, McConnell, and Michelson Reference Sinclair, McConnell and Michelson2013), and computer simulations (e.g., Fowler and Smirnov Reference Fowler and Smirnov2005; Rolfe Reference Rolfe2012; Siegel Reference Siegel2013) have followed this model, contributing new insight into interdependence while eschewing nationally representative samples.
If we hope to make progress, we must accept that no single dataset is likely to provide both detailed measurement of social interaction and easily-generalizable results. Without representative samples, studies of social influence must demonstrate their generality through replication in new contexts. This replication process poses a challenge because social data are rarely gathered in the same way and the unique features of each context and measurement strategy may limit their comparability. Nonetheless, studies of social influence can bolster their generality by demonstrating that the same patterns of social influence arise in different contexts and under different measurement strategies.
With these considerations in mind, we test our theory in three settings: the 1859 state elections in Alexandria, Virginia, the 1874 municipal elections in Newport, Kentucky, and the 2010 municipal election in Williamsburg, Virginia. The central commonality between these studies is they each identify ordinary citizens, elites, and relationships between them. The differences in time, place, and measurement make comparisons between these studies difficult, but allow us to test the robustness of our results across different contexts and specifications. Together, these three settings provide insight into the social logic of voting that no single dataset could accomplish on its own.
1859 Alexandria and 1874 Newport
Alexandria, Virginia rests across the Potomac River from Washington, DC. By 1859, it was a prosperous commercial city, relying heavily on slave labor. Roughly 1,400 of its 13,000 residents were slaves, while another 1,500 were free blacks. Alexandria otherwise featured relatively little ethnic diversity, with eight percent Irish-born, two percent German-born, two percent born elsewhere in Europe, and the remainder born in the United States. Through most of the 1850s, the voters of Alexandria favored the Whigs, but by 1859 with the Civil War approaching rapidly, the Whigs had disintegrated and the Democratic Party had become increasingly dominant in the state. Virginia’s 1859 statewide elections therefore pitted the Democratic Party against the newly formed “Opposition Party,” comprised largely by former Whig members.
Like Alexandria, Newport also sits on a river—the Ohio—across from a larger urban center—Cincinnati. Unlike Alexandria’s mercantile economy, Newport was largely industrial. While similar in size to Alexandria, with almost 16,000 residents, fewer than one percent of 1874 Newport’s residents were African American. Newport was nonetheless ethnically diverse, with Irish- and German-born residents comprising about eight and 18 percent of the city’s population and another six percent born elsewhere in Europe. The city was in the midst of an economic depression, sparked by a financial panic, that came after years of sustained economic growth. By the 1874 municipal elections, the Democratic and Republican Parties had become the dominant electoral contestants.
With these and myriad other considerations in mind, voters in each city filed into their assigned polling places and each called out their votes for the various offices. These votes were all recorded and we use these records to construct the outcome variables in our analysis. To compliment these poll books, we have worked with a large interdisciplinary team to assemble public records about the cities’ social networks at the time of the elections. Using census rolls, tax lists, plat maps, city directories, and other sources, we have identified the familial relations, street addresses, and occupations of each known resident in Alexandria and Newport. Lastly, we have culled church membership lists to link residents to the specific churches they attended.Footnote 3 In addition to these social data, the records tell us residents’ age, gender, accumulated wealth, and if they own or are in the process of purchasing their home.
These nineteenth century elections are useful for understanding voting more generally because they provide unobtrusive and comprehensive measurement of all known citizens and local candidates in each city. In addition to official records listing attributes such as wealth and home ownership, these are the only data available that provide a census of who voted in an election and for whom each citizen voted. Only with unbiased measures of candidate choice can we test Elite Proximity-Support Hypotheses I and II. These data provide an opportunity to define the network using the same variables—family, neighbors, occupation, and church—that best predict relationships in modern political discussion networks (Huckfeldt et al. Reference Huckfeldt, Beck, Dalton and Levine1995, 1032). More generally, these measures predict many forms of human interaction across a range of regions and eras (for a review of this literature, see McPherson, Smith-Lovin, and Cook Reference McPherson, Smith-Lovin and Cook2001) including nineteenth century U.S. cities (Tilly Reference Tilly2007, 80). We have these measures for the entire city populations, providing a more detailed and comprehensive image of the cities’ social networks than can be afforded with most survey samples.
Despite the advantages of these data, nineteenth century elections differ in many ways from those of today. Dramatic changes in social and political life have occurred since the nineteenth century, limiting their comparability to modern elections. These changes raise a question: are theories developed through the use of modern survey data relevant for understanding voting in this earlier period (Shortridge Reference Shortridge1980, 617)? We are aware of no individual-level analyses of turnout and few of vote choice that test modern theories of voting in the nineteenth century.Footnote 4 Thus, a secondary contribution of our analysis is to study the extent to which resource-based models help us understand nineteenth-century voting.
We would also like to test our theory in a modern election, but the archival methods we use to collect the nineteenth century data cannot be replicated for recent elections. Without viva voce poll books, no archival work can provide a measure of vote choice. One could instead document public demonstrations of support such as displaying yard signs (e.g., Makse and Sokhey Reference Makse and Sokhey2012) and identify voters using state voter files. This approach will not disclose the identities of individuals who do not display a sign or register to vote, posing a significant selection problem for an individual-level study. One could pair these data with U.S. census records to enumerate an entire city population, but this path is precluded because individual census records remain closed for 72 years. The data we use to identify relationships between individuals would also be difficult to obtain. We rely on the census for occupational data, city tax records for neighbors, and a combination of the two for family. The city tax records are a historical artifact; nineteenth century cities taxed personal as well as real property, encouraging tax collectors to visit every household and enumerate all residents therein. Modern tax and property records may reveal the owner of a parcel, but provide no information about who resides there—impeding measures of family or neighbors. We identify religious membership from the archival records of the religious institutions, including member lists, baptisms, marriages, and deaths which have been deposited in public archives or which the institutions were willing to make available as historical documents. Religious institutions are unlikely to share such information about recent members.
For these reasons, we instead test our theory in a modern election using a survey of college students. College records overcome the challenge of enumerating all community members while a survey-based name generator, combined with housing records, map relationships between these individuals. These data provide a more detailed map of the network than can be obtained through either modern archival work or larger-community studies including Huckfeldt and Sprague’s innovative survey designs. To test our theory, we also require elites in the network, but few college students run for elected office. We leverage a rare exception in which a student ran for—and won—a city council seat.
2010 Williamsburg
The May 2010 Williamsburg municipal election occurred in the wake of several recent city council decisions affecting student life at the College of William & Mary, a liberal arts college located in the city. In particular, the council recently adopted a strict noise ordinance and banned more than three unrelated individuals from living together in a single dwelling. A central decision for voters in this election was whom to elect for city council. One of these candidates, Scott Foster, was concurrently a William & Mary student.
We rely on a survey fielded by Daniel Maliniak, Patrick Miller, and Ronald Rapoport during the election targeting all current William & Mary students (Miller et al. Reference Miller, Bobkowski, Maliniak and Rapoport2015). Most of our data are drawn from the preelection wave, which received responses from 2,740 students, representing just under 50% of the student body. We also draw some data from a postelection wave which received 992 valid responses constituting a sixth of the student body.Footnote 5 The social network we explore contains all students at the school, including Scott Foster, allowing us to measure each student’s social proximity to this elite. We use two methods to identify relationships between students. First, the preelection survey asked respondents to identify their five closest friends at William & Mary. Second, we obtained housing records for all 3,655 students living on campus, allowing us to identify relationships between roommates, even if they did not respond to the survey. These housing data add substantially to the network because 64% of students live on campus.
The Williamsburg data address several limitations of the nineteenth century studies. First, they allow us to test our theory in a modern municipal election because they provide measures of students, an elite, and the relationships connecting them. Second, by using a name generator and roommate records to identify the network, we obtain more concrete measures of relationships than those afforded by archival work—relationships are explicitly identified rather than imputed based on shared attributes. By relying on name generators, we test the robustness of our results using the typical measurement strategy of recent research on social influence in political behavior. Third, the survey measures attitudes including partisan identification and behaviors such as participating in previous elections, providing controls for established predictors of voting unavailable through archival work.
Limitations
Our three datasets share an ability to measure the attributes of everyday citizens, elites, and relationships connecting these groups. Like previous studies of social influence, the features of the data that make this measurement possible also limit their generality. The elites in all three datasets are candidates for local offices and elite proximity may have different effects in national elections, which feature broader, less-connected constituencies and larger mobilization efforts. Yet local elections are of great significance; due to the vast number of local governments, local elections occur in much greater number than national elections and locally-elected officials are responsible for implementing policy and allocating a large proportion of the nation’s resources (Trounstine Reference Trounstine2009).
The college-age citizens in the Williamsburg data may be more susceptible to social influence than older citizens. The nineteenth century data overcome this problem, but the public nature of the vote may also amplify social influence. Worse, it may have facilitated patronage—the partisan use of public office to appoint individuals dedicated to the welfare of a political machine. If present in our data, patronage may increase elites’ social influence relative to modern elections. But patronage systems typically arose in large cities which provided governing parties with many job openings to exchange for party loyalty. Nineteenth century Alexandria and Newport were too small and provided too few services to generate many such jobs. We have nonetheless searched for evidence of patronage in these cities, finding evidence that it occurred, but only rarely. The public vote also opens the possibility of vote buying and coercion, but like patronage we believe these behaviors were rare in these elections. See Online Appendix A for the evidence on which we base these conclusions.
The many differences between the nineteenth century data and the Williamsburg data limit our ability to draw connections between them. For instance, the nineteenth century networks feature many elites from different parties while the Williamsburg network features only a single elite. Citizens embedded in these different networks are likely to encounter different information and face different forms of social pressure. The network measures also differ with these two approaches. We assume in the nineteenth century networks that people from the same family, occupation, church, or block interact with one another. This assumption is often correct (Huckfeldt Reference Huckfeldt1983), but produces only a probabilistic measure of the network.Footnote 6 This network undoubtedly overlooks some important relationships while also imputing connections between people who do not know each other directly. The Williamsburg data avoid this problem, providing more certain measures of relationships. By focusing on close friends and roommates, these relationships are likely to be stronger and more personal than those captured in the nineteenth century data. The many differences between these studies provide a strong test of the robustness of our results, but they prevent us from identifying the specific mechanisms that generate these broad patterns. As we proceed, we therefore pay careful attention to the confounds that may lead us to ascribe social influence where none exists.
Perhaps the largest set of confounds we face are not limited only to our design, but pervade virtually all cross-sectional studies of social influence (Fowler et al. Reference Fowler, Heaney, Nickerson, Padgett and Sinclair2011). Regardless of how the network is measured, people who are socially proximate to one another inhabit similar environments and share similar interests. In our study, shared environments can confound our conclusions when people who are socially proximate to each other encounter the same external pressures to vote. A pair of neighbors or college roommates may each turn out to vote, not because one influenced the other, but because they were each canvassed by the same get-out-the-vote drive. Shared interests arise because people interact primarily with others who are similar to themselves (McPherson, Smith-Lovin, and Cook Reference McPherson, Smith-Lovin and Cook2001). Those shared interests can confound our estimates if they lead socially proximate individuals to vote similarly to one another. In the nineteenth century data, people who attend the same church as an elite may share the elite’s economic interests, beliefs, and values. These shared traits may also influence their political behavior. In the Williamsburg data, people may be friends because of their shared interest in politics and hence the similarity in their voting may be a cause of the friendship rather than the consequence. Our data allow us to control for some of these shared interests, but we cannot eliminate these confounds. We therefore subject our estimates to sensitivity analysis, originally developed by VanderWeele (Reference VanderWeele2011), in order to assess the robustness of apparent social influence effects to these and other unobserved confounds.
Constructing the Nineteenth Century Networks
Our goal is to measure the social proximity of an individual, i, to a city’s elites. We also must measure separately the social proximity of an individual to each party’s elites. We define the social distance between individual i and a set of elites [to be denoted Social Distance to Elites i ] as the average—across all members of the elite set—distance between individual i and elite j.
The distance between individual i and elite j, dij , is measured by first determining the social distance between every pair of individuals in the city. To measure this distance between any pair, we assume two individuals are more closely connected the more direct social connections between them. We therefore count the number of direct social connections between each pair using each of four possible means that can be observed in our data:
-
• whether they are in the same family (i.e., they share the same surname and live in the same residence),
-
• whether they are neighbors (i.e., they live on the same block and the same side of the street),
-
• whether they are confreres (i.e., they share an occupation), and
-
• whether they are affiliated with the same church.
We also allow for paths passing through intermediaries; if Tom and Dick attend the same church and Dick and Harry have the same occupation, then Tom and Harry are connected on a path passing through Dick. With these assumptions, we apply Dijkstra’s shortest path algorithm, which finds the shortest path between any two individuals (for details, see Cormen et al. Reference Cormen, Leiserson, Rivest and Stein2009, 658). The resulting social distance measure holds larger values for pairs of individuals with more intermediaries between them and fewer direct social relationships along the path. To arrive at dij , we then extract the distance between each individual i and elite j. Individuals not connected to an elite by any path length are coded as one plus the maximum path length to this elite.
In Alexandria, we define elites as the candidates who ran for city-wide office in the local elections held March 1, 1859.Footnote 7 These elections were held just three months before the May 29 statewide elections on which we base our outcome measures of turnout and vote choice. In total, 19 Opposition Party candidates, seven Democrats, and three candidates with no known party affiliation ran for these positions, including multiple candidates of the same party competing against each other for several positions.Footnote 8 In Newport, we define elites as the candidates running that year for one of the 11 city-wide elected officesFootnote 9 —the same elections on which we base our outcome measures of turnout and vote choice. Republicans fielded a candidate for each office, but Democrats did not field nominees for City Treasurer or City Engineer. We could not determine which of the six people named James Smith in our records was the Democratic candidate for Weights and Measures. We are hence left with eight Democratic and 11 Republican elites on whom we base our measures of elite proximity.
Tables B1 and B2 in Online Appendix B provide descriptive statistics for the social distance measures and all other variables used in the analyses. In Alexandria, the average social distance between an eligible voter and each candidate, regardless of party, is 9.9 (standard deviation = 2.15). Eligible voters average the same distance to each party as well, with an average distance of 9.9 (
 $\text{SD} = 2.14$
) to each Opposition Party candidate and 9.8 to each Democratic candidate (
 $\text{SD} = 2.25$
). In Newport, eligible voters average a social distance of 11.0 (
 $\text{SD} = 1.99$
) to each elite, 11.2 to each Democratic candidate (
 $\text{SD} = 1.98$
), and 10.8 to each Republican candidate (
 $\text{SD} = 1.99$
).Footnote
10
For all analyses, we standardize these measures with
 $\text{mean} = 0$
and
 $\text{SD} = 1$
. To aid in presentation, we then multiply these distance measures by − 1 so larger values indicate greater proximity to elites.
Constructing the Williamsburg 2010 Network
To measure Social Distance to the Elite i in Williamsburg, we rely on the name generator from the preelection survey, which asks respondents to identify “the first and last names of up to five of your closest friends who attend William & Mary.” There is a direct connection from individual i to individual j, if i named j as one of her five closest friends. Using the on-campus housing records, we also code a pair of individuals as connected if they share a room. We restrict our analysis to the 2,590 respondents who had at least one direct connection in this network.
Social Distance to the Elite
i
equals 1 + the number of intermediaries on the directed shortest path running from individual i to Foster, the William & Mary student running for city council. For the 85 students who cannot reach Foster on a path of any length, their social distance measure equals 1 + the maximum distance in the sample (maximum = 11).Footnote
11
Again, this approach yields a measure of distance between pairs of individuals where higher values indicate more intermediaries between the pair. Respondents were on average connected to Foster on a path length of 6.2 (
 $\text{SD} = 1.8$
).Footnote
12
As with the nineteenth century data, we standardize this elite distance measure with
 $\text{mean} = 0$
and
 $\text{SD} = 1$
and then multiply by − 1 so larger values indicate greater proximity to the elite.
EMPIRICAL RESULTS
Using these measures, we first explore social proximity’s relationship with turnout and vote choice in the nineteenth century. We then examine the 2010 election.
Turnout in the Nineteenth Century
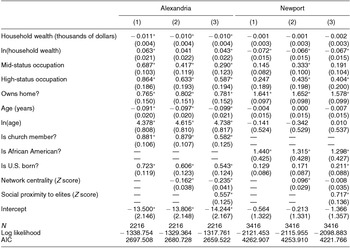
Table 1 displays individual-level logistic regressions modeling turnout in Alexandria and Newport. For each city, model 1 includes only personal attributes as explanatory variables. Model 2 introduces as an explanatory variable an individual’s weighted eigenvector network centrality. Model 3 introduces our measures of elite proximity. The models are restricted to eligible voters.
Estimates from a Model Predicting an Individual’s Probability of Voting Using his Social Proximity to Elites and Other Variables (Based on the Statewide Elections in 1859 Alexandria, VA and the Local Elections in 1874 Newport, KY)

Notes: Reported coefficients are from logistic regressions (with standard errors in parentheses). Models are restricted to eligible voters (in Alexandria, white males at least 21 years of age; in Newport, males at least 21 years of age). The omitted reference category for occupational status includes low-status occupations, the unemployed, and those lacking occupational data. In each city, a likelihood ratio test suggests that model 3—which includes the social network measures—provides a better fit than does model 1 (in Alexandria,
 $\chi ^2 (\text{DF} = 2) = 42$
; p < 0.001. In Newport,
 $\chi ^2 (\text{DF} = 2) = 45.1$
; p < 0.001).
*p < 0.05.
The models control for several resource-based covariates, including wealth, occupational status, and home ownership. In Alexandria, where we have complete church records, we control for whether someone was on a church membership list (Campbell Reference Campbell2013, 38). Recall that we use church attendance as a form of connection in the social network. We include this control to defend against the possibility that the relationships exhibited by the elite proximity measures are spurious, emerging instead due to differences between church members and nonmembers.Footnote 13 In Newport, where blacks had the right to vote, we control for race. In both cities, we also control for age. We expect wealth and age to have diminishing returns (see Rolfe Reference Rolfe2012, 140) and therefore also include the natural log of both variables (we set the minimum wealth to $1 before this transformation).
Predictors of turnout commonly used on modern data receive mixed support in these elections. Socioeconomic resources perform as expected in Alexandria. The models suggest, all else equal, people who have greater wealth, have higher-status occupations, and own homes are all more likely to vote.Footnote 14 In Newport, greater resources do not consistently distinguish voters from nonvoters. All else equal, wealthier individuals turnout at lower rates and the difference in turnout between people with mid- and low-status occupations is not statistically significant. People with high-status occupations do vote more frequently than people with low- or mid-status occupations and home owners vote more frequently than nonowners. Aside from these resources, the other covariates perform as expected, with voters in each city disproportionately comprised of older citizens, the U.S. born, and (in Alexandria) church members. In Newport’s 1874 elections—only a few years after the Fifteenth Amendment extended the franchise to African Americans—blacks were significantly more likely to vote than were whites, all else equal.
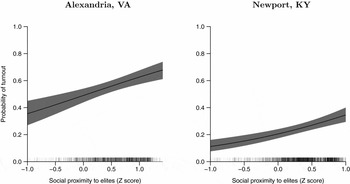
Our Elite Proximity-Turnout Hypothesis receives support in both cities. In each, model 3 shows a positive and statistically significant coefficient associated with elite proximity, suggesting people more proximate to elites vote at higher rates. Figure 2 plots individuals’ predicted probabilities of turnout by their social proximity to elites. In Alexandria, the predicted probability of turnout is 0.36 for people one standard deviation below the mean in elite proximity, 0.49 for people at the mean (first difference = 0.49 − 0.36 = 0.13; 95% confidence interval [0.09, 0.18]), and 0.63 for people a standard deviation above (
 $\text{FD} = 0.63 - 0.49 = 0.14$
; 95% CI [0.09, 0.18]). In Newport, the corresponding probabilities are 0.11, 0.21, and 0.35 (and again the differences in these probabilities are each statistically significant). These differences are similar in magnitude to the differences in the turnout between people with high- and mid-status occupations. In Alexandria, people with high-status occupations have a 0.13 greater probability of turnout than otherwise similar people with mid-status occupations (95% CI [0.06, 0.19]). In Newport, this difference is 0.09 (95% CI [0.02, 0.16]).
An Individual’s Predicted Probability of Voting Given his Social Proximity to Elites (Based on the Statewide Elections in 1859 Alexandria, VA and the Local Elections in 1874 Newport, KY)

These results also help disentangle the role of general centrality from that of proximity to elites. While both Nie, Junn, and Stehlik-Barry (Reference Nie, Junn and Stehlik-Barry1996) and Rolfe (Reference Rolfe2012) assume a strong association between these two measures, they are only weakly related in our data; Pearson’s r = 0.21 in Alexandria and 0.23 in Newport. In Alexandria, the Table 1 models 2 and 3 coefficients associated with network centrality are negative and statistically significant; all else equal, more central citizens were less likely to vote than those more disconnected from the community. In model 3, both centrality and social proximity exhibit a distinct relationship with turnout, but in opposite directions, and thus one cannot serve as a proxy for the other. We should not expect centrality to discourage participation in all elections, however. The computational models of Fowler and Smirnov (Reference Fowler and Smirnov2005) as well as Siegel (Reference Siegel2009; Reference Siegel2013) suggest the effect of centrality will depend on the overall levels of participation in the election.
Vote Choice in the Nineteenth Century
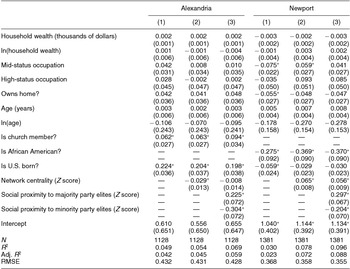
While social proximity to elites has a strong relationship with turnout, how does it relate to voters’ candidate choices? Table 2 models vote choice as a function of the same explanatory variables used to predict turnout.Footnote 15 In Alexandria, the outcome variable is equal to the proportion of votes an individual cast for the Opposition Party across the five races for national or state government: U.S. Congress, VA House of Delegates, VA Governor, VA Lieutenant Governor, and VA Attorney General. In Newport, the outcome variable is equal to the proportion of votes cast for the Democratic Party across the nine citywide positions contested by both parties.Footnote 16 We use OLS for these models.Footnote 17 As above, the first model for each city includes only personal attributes as explanatory variables, the second adds the centrality measure, and the third adds the social proximity measures.
Estimates from a Model Predicting the Proportion of an Individual’s Votes Cast for the Majority Party in the City (Based on the Statewide Elections in 1859 Alexandria, VA and the Local Elections in 1874 Newport, KY)

Notes: Reported coefficients are from ordinary least squares regressions (with standard errors in parentheses). Models are restricted to voters. The outcome variable is equal to the proportion of votes cast for the majority party in the city (The Opposition Party in Alexandria; The Democratic Party in Newport). The omitted reference category for occupational status includes low-status occupations, the unemployed, and those lacking occupational data. In each city, an F test suggests that model 3—which includes the social network measures—provides a better fit than does model 1 (In Alexandria,
 $F (\text{DF} = 3, 1115) = 7.7$
; p < 0.001. In Newport,
 $F (\text{DF} = 3, 1368) = 33.2$
; p < 0.001).
*p < 0.05.
Both elections were closely divided, with Opposition candidates securing 59% of votes in Alexandria and Democratic candidates securing 52% in Newport. Table 2 shows that, unlike modern elections (Gelman et al. Reference Gelman, Park, Shor and Cortina2009), resource-based measures were poor predictors of vote choice in these elections. Unsurprisingly in the wake of the Civil War, model 3 in Newport suggests that, all else at its median, African Americans were 37 percentage points less supportive of Democratic candidates than were people of other races (95% CI [− 55, −19]).
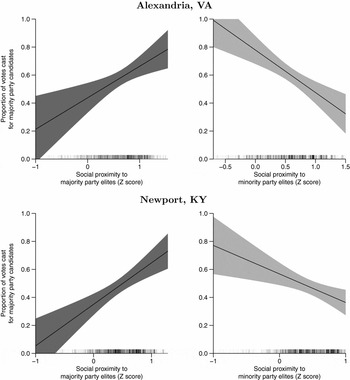
In model 3 from each city, the positive and statistically significant coefficient associated with proximity to the majority party provides support for Elite Proximity-Support Hypothesis I. Likewise, the negative and statistically significant coefficient associated with proximity to the minority party provides support for Elite Proximity-Support Hypothesis II. Figure 3 plots the predictions from the models as the social proximity measures vary. The left panel of the figure shows the proportion of votes an individual is predicted to give to the majority party in the city as social proximity to this focal party increases. The right panel shows how this support decreases with increases in social proximity to the minority party. The figure shows that, all else equal, citizens closer socially to majority-party candidates cast a greater proportion of their votes for that party. Compared to people at the mean social proximity to the majority party, those one standard deviation above are predicted to have 0.23 greater support for the majority party in Alexandria (95% CI [0.09, 0.37]) and 0.30 greater support in Newport (95% CI [0.16, 0.44]). The right panel shows that voters closer to minority-party candidates are decreasingly likely to vote for the majority party. Compared to people at the mean social proximity to the minority party, those one standard deviation above are predicted to have 0.30 less support for the majority party in Alexandria (95% CI [− 0.44, −0.07]) and 0.20 less support in Newport (95% CI [− 0.34, −0.06]).
The Predicted Proportion of an Individual’s Votes Cast for the Majority Party in the City Given his Social Proximity to Each Party’s Elites (Based on the Statewide Elections in 1859 Alexandria, VA and the Local Elections in 1874 Newport, KY)

If social proximity encourages candidate support, local party organizations can profit by recruiting candidates with strong social connections to their communities. Alternatively, our results may arise if candidates in our elections ran because of their social proximity to their supporters (or because of unobserved factors that covary with social proximity). Our cross-sectional data cannot provide a conclusive test of these mechanisms. Though candidates may have emerged due to their social proximity to typical party supporters, we see little evidence that candidates emerged because they were socially proximate to citizens generally. If social proximity predicts candidate emergence, we should expect candidates to be particularly central in the network, which they were not. Candidates had an average weighted eigenvector centrality of 0.04 in Alexandria and 0.13 in Newport, slightly less than the 0.17 and 0.14 averages for eligible voters in each city. If elites were exceptionally central, the distinction between social proximity to elites and general centrality would be muted; the most central citizens would also be the most proximate to elites.
Turnout and Participation in 2010 Williamsburg
We next examine the 2010 Williamsburg election, where we model turnout and political participation in support of Foster’s campaign as functions of social proximity to Foster. We focus on campaign participation rather than vote choice because we lack variation in respondents’ vote choices; of the respondents casting a ballot, 96% report voting for Foster. Participation provides a useful alternative because it allows us to study other forms of candidate support and campaign engagement that are not available in the nineteenth century data.
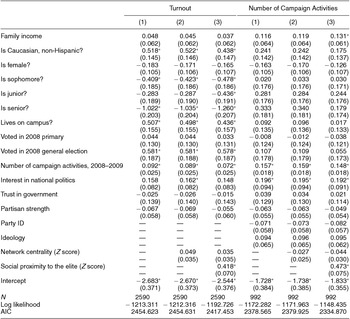
To measure turnout, we obtained the Williamsburg voter file for the election. Our outcome variable equals one if the respondent’s name was in the file and zero otherwise. By using this validated voting measure, we avoid the problem of overreporting turnout that is common to public opinion surveys (Clausen Reference Clausen1968; Holbrook and Krosnick Reference Holbrook and Krosnick2010). In addition to the social proximity measure discussed above, we control for respondents’ family income, race/ethnicity, gender, and place of residence. At the time of the election, Foster was a senior government major and hence his close social circle was likely to be older and more politically interested. We therefore control for academic year, past political participation (including voting in 2008 and an additive index of political participation in 2008 and the 2009 VA gubernatorial race),Footnote 18 and various political attitudes (interest in national politics, trust in government, and partisan extremity).Footnote 19 All controls are measured using the pre-election wave of the survey. Online Appendix B discusses measurement details and Table B3 displays summary statistics for these variables. King et al. (Reference King, Honaker, Joseph and Scheve2001) argue that missing data pose a large problem for survey research, asserting that multiple imputation of missing values provides an improvement over listwise deletion. Our models, displayed in Table 3, therefore rely on multiple imputation via the Amelia package in R (Honaker et al. Reference Honaker, King and Blackwell2011). For details on the imputations, see Online Appendix F.Footnote 20
Estimates from Models Predicting an Individual’s Probability of Electoral Turnout and Number of Campaign Activities Completed in Support of Foster (Based on the Local Election in 2010 Williamsburg, VA)

Notes: Reported coefficients are from logistic regressions for the Turnout models and negative binomial regressions for the Campaign Activities models (with standard errors in parentheses). All estimates are based on five imputations. The omitted reference category for academic year is freshman. For both outcome variables, a likelihood ratio test suggests that model 3—which includes the social network measures—provides a better fit than does model 1 (for Turnout,
 $\chi ^2 (\text{DF} = 2) = 41.2$
; p < 0.001). For the Campaign Activities models,
 $\chi ^2 (\text{DF} = 2) = 47.7$
; p < 0.001).
*p < 0.05.
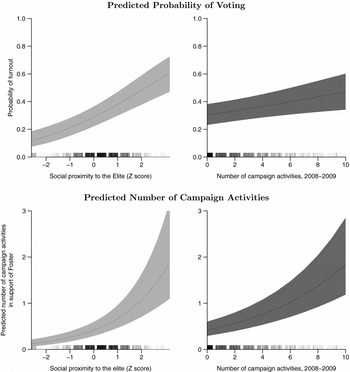
The first three models of the table examine turnout. In model 3, the coefficient associated with social proximity to the elite is positive and statistically significant, lending further support for our Elite Proximity-Turnout Hypothesis. The top-left panel of Figure 4 graphs this relationship. Consider individuals with five intermediaries between themselves and Foster, roughly corresponding to the mean social distance (social proximity to the elite Z score ≈ 0). With other variables at their medians, the model predicts they will have a 0.31 probability of voting. If these individuals made friends with someone separated from Foster by only two intermediaries, they would then be separated by only three intermediaries rather than five—roughly a standard deviation increase in social proximity (social proximity to the elite Z score ≈ 1). In this scenario, their predicted probability of turnout would increase to 0.41 (
 $\text{FD} = 0.41 - 0.31 = 0.10$
; 95% CI [0.06, 0.13]). For comparison, the top-right panel graphs the relationship between previous campaign participation and turnout—one of the strongest turnout predictors (Brody and Sniderman Reference Brody and Sniderman1977; Gerber, Green, and Shachar Reference Gerber, Green and Shachar2003). Compared to an individual who completed the mean number of campaign activities in 2008 and 2009 (
 $\text{mean} = 1.6$
), someone who completed a standard deviation more activities (
 $\text{SD} = 2.2$
) is predicted to have a 0.03 greater probability of voting (
 $\text{FD} = 0.35 - 0.32 = 0.03$
; 95% CI [0.01, 0.06]). We are not arguing that the strength of the social proximity relationship exceeds that of previous participation; voting in the 2008 general election, a different measure of past participation, also predicts turnout.Footnote
21
Rather, we wish to emphasize the similarity between the results from this modern election to those from the nineteenth century. A strong relationship persists between turnout and social proximity to the elite despite the absence of viva voce voting, and even after controlling for past participation and political attitudes.
An Individual’s Predicted Probability of Voting and Predicted Number of Campaign Activities in Support of Foster Given her Social Proximity to the Elite (Based on the 2010 Williamsburg Election)

Our theory suggests that social proximity to the elite should encourage turnout in the 2010 municipal election, but it should have no effect on turnout in the 2008 election, which occurred two years before Foster ran for office and before many students arrived at William & Mary. Thus, turnout in 2008 provides a placebo test for our model (Sekhon Reference Sekhon2009). In the test, we model 2008 turnout as the outcome variable using as explanatory variables the remaining covariates from Table 3 model 3. If the coefficient associated with social proximity remains large and statistically significant in this model, it contradicts our interpretation of the results, suggesting instead that people more proximate to Foster participate at higher rates due to shared interests or reasons other than social proximity. As Table G1 of Online Appendix G demonstrates, however, the coefficient is almost zero, lending support to our approach.
The last three models in Table 3 display the relationship between social proximity and participation in favor of Foster’s campaign, providing a new test of our Elite Proximity-Support Hypothesis I. The models are estimates from negative binomial regressionsFootnote 22 where the outcome variable is a count of the number of campaign activities in which the respondent engaged specifically in support of Foster, measured in the postelection wave.Footnote 23 In addition to the controls from the turnout models, we control for party ID and ideology.
The positive and statistically significant coefficient associated with social proximity suggests, all else equal, more proximate respondents participated in more campaign activities in support of Foster. The bottom row of Figure 4 plots this relationship as well as that between the 2008–2009 participation index and participation in support of Foster. Someone at the mean of social proximity is predicted to perform 0.4 acts in support of Foster compared to 0.7 acts for someone one standard deviation above (
 $\text{FD} = 0.68 - 0.42 = 0.26$
; 95% CI [0.15, 0.40]). For campaign activism in 2008–2009, someone at the mean is predicted to perform 0.6 acts in support of Foster, compared to 0.8 acts for someone one standard deviation above (
 $\text{FD} = 0.76 - 0.55 = 0.21$
; 95% CI [0.14, 0.32]). Like the turnout model, this analysis suggests a strong relationship between social proximity to the elite and participation in support of the elite, even after controlling for individuals’ past engagement in similar forms of participation.
In the analyses above, we show in three different settings that voting has a strong relationship with social proximity to elites, even after including a variety of controls. Nonetheless, these apparent social influence effects may instead arise due to unobserved confounds arising from associates’ shared environments and interests. We therefore subject all of our estimates to sensitivity analysis, originally developed by VanderWeele (Reference VanderWeele2011). In Tables H1– H6 of Online Appendix H, we show that all of our social influence estimates prove robust to large levels of bias from these or other confounds.
CONCLUSION
Most people do not know personally someone who has run for elected public office (Nie, Junn, and Stehlik-Barry Reference Nie, Junn and Stehlik-Barry1996, 48), but many may know someone who knows such an elite. We are all connected to elites through this social network, some of us more closely than others. We have shown that people more closely connected to elites vote at higher rates and, when choosing among candidates, often choose members of the party they are closest to socially. This study was only possible because the three elections we examine share the ability to identify ordinary citizens, elites, and relationships between them. The attributes of these communities that allowed this measurement also make them unrepresentative in many ways. Indeed, recent work in social influence suggests these relationships will differ from context to context (e.g., Huckfeldt, Johnson, and Sprague Reference Huckfeldt, Johnson and Sprague2004; Siegel Reference Siegel2009). It is for this reason that we replicate our analysis in three different elections, which vary in time, place, and measurement strategy. The large differences between these studies—different age groups, different voting institutions, different candidate pools—demonstrate the robustness of our results, but also limit our ability to examine the specific mechanisms driving these patterns. To what extent do the patterns we observe emerge from social pressure, information diffusion, candidate emergence or asocial processes such as networks of shared interests? We must leave it to future work to answer these questions. Despite these limitations, we think these results contribute to our understanding of social influence in political behavior, local elections, and voting more generally.
Over the last three decades, work on social influence in political behavior has relied primarily on name-generator survey batteries, exploring social influence arising among people’s closest friends and family. These few individuals comprise only a small fraction of the hundreds of people we interact with directly and the thousands we are linked to through intermediaries. Our theory presented here specifies how these remaining relationships influence individual voting decisions, with influence flowing from elites to their immediate associates and then spreading to less proximate individuals in the network. Our work suggests close associates can connect individuals to the broader climates of opinion within their community. As such, we bridge recent research on close relationships to earlier contextual studies focusing on the correlation of attitudes or behaviors of individuals within neighborhoods (e.g., Tingsten Reference Tingsten1963), religions (e.g., Langton and Rapoport Reference Langton and Rapoport1976), and social classes (e.g., Berelson, Lazarsfeld, and McPhee Reference Berelson, Lazarsfeld and McPhee1954). We demonstrate that individuals are not atoms disconnected from the broader context, nor are they social sponges, indiscriminately absorbing the prevailing political culture. They are tied to the broader context by specific and idiosyncratic networks of associations. By specifying this network we can better understand the ways individuals respond to the contexts in which they are embedded.
The elites we study are all candidates for local office and our work provides clarity into the social forces underlying these important, but understudied elections. Our work extends to local elections the logic of friends-and-neighbors voting—a phenomenon of interest to political scientists for over half a century (e.g., Gimpel et al. Reference Gimpel, Karnes, McTague and Pearson-Merkowitz2008; Stokes and Miller Reference Stokes and Miller1962; Tatalovich Reference Tatalovich1975). This theory, largely developed and tested in congressional districts and statewide electoral offices, suggests geographic proximity to a candidate encourages voters to “back the home-town boy” (Key Reference Key1949, 41). Our Newport results suggest that in local elections, where all candidates are from the hometown, social proximity rather than geographic proximity alone may drive this relationship.Footnote 24 Our analysis of Virginia’s state elections demonstrates that local social ties also help shape state-level elections, lending support to the claim that friends-and-neighbors voting occurs through the transmission of information (Bowler, Donovan, and Snipp Reference Bowler, Donovan and Snipp1993). While recent work on the topic suggests more salient races may influence down-ticket elections (Meredith Reference Meredith2013), this result suggests less-salient races may also impact more salient ones. The electoral fate of geographically-distant statewide candidates is linked to the social network within voters’ communities.
Finally, our analysis of two nineteenth century elections demonstrates both the usefulness and limitations of voting theories originally developed with modern data. Much like modern elections, people with more socioeconomic resources at stake are more likely to participate. Unlike more modern elections, socioeconomic resources provide little insight into the divisions between supporters of competing parties. In contrast, the social network measures we develop clearly separate voters from nonvoters and supporters of a party from supporters of another—suggesting we can better understand elections by considering not only what citizens have, but also who they know. Unfortunately, specifying the relationships between individuals proves difficult using the random samples that dominate the voting literature. The challenge for electoral scholars is to specify these relationships without abandoning the many advantages that come from random samples.
SUPPLEMENTARY MATERIALS
To view supplementary material for this article, please visit https://doi.org/10.1017/S000305541600071X







Comments
No Comments have been published for this article.