Feynman’s challenge
Richard Feynman, as a physicist, of course knew that the fundamental resolution limit of any optical instrument is proportional to wavelength divided by aperture angle. In his classic 1959 lecture at the annual meeting of the American Physical Society, Feynman said,Reference Feynman1 “The reason the electron microscope is so poor is that the f-value of the lenses is only 1 part to 1000; you don’t have a big enough numerical aperture. And I know that there are theorems which prove that it is impossible, with axially symmetrical stationary field lenses, to produce an f-value any bigger than so and so; and therefore the resolving power at the present time is at its theoretical maximum. But in every theorem there are assumptions. Why must the field be axially symmetrical?” f-value refers to the aperture of the lens, the ratio of the focal length to the diameter. He was probably aware that in 1947, Otto Scherzer had already published designs for aberration correctors that used non-round lenses.Reference Scherzer2 An earlier article by Scherzer proved that round lenses had intrinsically large positive spherical aberrations,Reference Scherzer3 although it also stated that “the unavoidability of spherical aberration is a technical barrier but not a barrier in principle.” In other words, as Feynman said in his lecture, “it is not against the laws of physics.” Nevertheless, achieving successful aberration correction did indeed turn out to be a formidable engineering challenge.
Based on the laws of physics, aberration correctors for stationary field lenses can use two schemes, (1) quadrupoles and octupolesReference Archard4 or (2) round lenses and hexapoles.Reference Beck5 Early corrector designs did not lead to improved resolution,Reference Crewe and Kopf6 but later designsReference Rose7,Reference Krivanek, Dellby and Lupini8 formed the basis for the successful correctors in use today. Apart from the problem of stability of all of the individual power supplies, there is the problem of tuning or focusing in the multidimensional space of multipole lenses. Only in the computer era did this become possible, such that computers could be used to measure aberrations and iterate the lenses to achieve a sharp focus. The first successful improvement in resolution came with the scanning electron microscope,Reference Zach and Haider9 then with the transmission electron microscope,Reference Uhlemann and Haider10–Reference Haider, Rose, Uhlemann, Kabius and Urban13 and later with the scanning transmission electron microscope (STEM).Reference Dellby, Krivanek, Nellist, Batson and Lupini14
It was the STEM that achieved sub-angstrom resolution for the first time at moderate accelerating voltages,Reference Batson, Dellby and Krivanek15,Reference Nellist, Chisholm, Dellby, Krivanek, Murfitt, Szilagyi, Lupini, Borisevich, Sides and Pennycook16 and it is the STEM that holds the current record for the highest resolution, close to 0.5 Å.Reference Erni, Rossell, Kisielowski and Dahmen17,Reference Sawada, Tanishiro, Ohashi, Tomita, Hosokawa, Kaneyama, Kondo and Takayanagi18 Again, this is in accord with the laws of physics. The resolution record was obtained using the high-angle annular dark field (HAADF) or Z-contrast mode (Z = atomic number) of imaging,Reference Pennycook and Boatner19–Reference Pennycook and Jesson21 which uses electrons scattered to high angles off the atomic nuclei (i.e., Rutherford scattering). Each atom scatters independently, and the resulting image is termed an incoherent image. It was shown long ago by Lord RayleighReference Rayleigh22 that incoherent imaging has a factor of two higher resolution than coherent imaging, in which scattering from different atoms interferes coherently.
There is another reason to pursue this challenge with the STEM. Feynman’s motivation for improving the electron microscope by a factor of 100 was so we could “just look at the thing,” that is, figure out its atomic structure. This is much easier to do with an incoherent image, which is directly interpretable. The long road to achieving incoherent imaging in the electron microscope was described recently in MRS Bulletin.Reference Pennycook23 The STEM also provides additional significant advantages such as the possibility of generating multiple simultaneous images. For example, in addition to the HAADF signal, one can obtain an aberration-corrected bright-field phase-contrast image, an incoherent annular bright-field phase-contrast image, or a spectroscopic image formed from inelastically scattered electrons, as was also described recently in MRS Bulletin.Reference Pennycook and Colliex24 All of these signals give valuable, complementary information about the sample.
Another reason for the recent surge of interest in the STEM is that aberration correction has finally overcome the noise issue that has plagued the STEM since its inception by Manfred von Ardenne in 1938.Reference von Ardenne25 With the introduction of the high-brightness cold field emission electron gun by Albert Crewe,Reference Crewe26 single atoms became visible in the electron microscope for the first time in the STEM.Reference Crewe, Wall and Langmore27 With aberration correction, however, their visibility improves dramatically, as shown in Figure 1. Not only is the probe size reduced upon aberration correction, giving a smaller atom feature, but the peak intensity is also increased, and the signal-to-noise ratio correspondingly improves, as is clear upon comparison of panels a and b of Figure 1 before and after installation of a third-order aberration corrector, respectively, on a 300 kV STEM. Figure 1c shows how, with a fifth-order aberration corrector, similar image quality can be obtained for the much lighter Si atoms on graphene at an accelerating voltage of only 60 kV, which is below graphene’s damage threshold, and with shorter frame rates. Now, movies can be made of atomic motion,Reference Lee, Zhou, Pennycook, Idrobo and Pantelides28 and bonding of single atoms can be deduced through electron energy-loss spectroscopy (EELS).Reference Zhou, Kapetanakis, Prange, Pantelides, Pennycook and Idrobo29
Imaging of Pt atoms on γ-alumina with a VG Microscopes 300 kV scanning transmission electron microscope (STEM) (a) before and (b) after correction of third-order aberrations. Some Pt trimers and dimers are visible before correction (yellow circles) but are much more visible after correction (white circles). (c–d) Images of three Si atoms occupying six C vacancies in a graphene monolayer, taken with a fifth-order aberration-corrected Nion UltraSTEM instrument at only 60 kV beam voltage. (a) Reproduced with permission from Reference 62. © 1996 American Association for the Advancement of Science. (b) Reproduced with permission from Reference 63. © 2004 Wiley-VCH. (c–d) Reproduced with permission from Reference 64. © 2014 National Academy of Sciences.

So, with all of these recent improvements, why push for yet higher resolution? Is there not enough to look at already? The answer is that each new generation of aberration corrector has brought dramatic scientific gains, and so would the next. If we could see atoms even more clearly, we could link structure to functionality with much more precision, and we could determine the atomic structures of materials that are impossible to see with today’s resolution, such as glasses and nanophase materials. Whole new views of materials await.Reference Pennycook and Kalinin30 Who today would use an uncorrected electron microscope if a corrected one were available? Who would choose a third-order-corrected microscope if a fifth-order-corrected one were available? Not only does the image quality improve with each new generation of aberration corrector, but equally importantly, the ease and rate of data collection also increase dramatically. So why stop here?
More precise atomic coordinates
Complex oxides provide excellent examples of materials whose structure and properties are exquisitely linked to very fine-scale details of structure. Aberration correction yielded the ability to see ferroelectric displacements, and this has advanced the science of ferroelectrics enormously.Reference Jia, Urban, Alexe, Hesse and Vrejoiu31–Reference Borisevich, Chang, Huijben, Oxley, Okamoto, Niranjan, Burton, Tsymbal, Chu, Yu, Ramesh, Kalinin and Pennycook38 An example of the interplay between cation displacements, octahedral rotations, and electric polarization is presented in Figure 2,Reference Kim, Kumar, Hatt, Morozovska, Tselev, Biegalski, Ivanov, Eliseev, Pennycook, Rondinelli, Kalinin and Borisevich39 which shows a BiFeO3 (BFO) film grown on La0.7Sr0.3MnO3 (LSMO) with two different LSMO terminations, namely, either MnO2 or (La,Sr)O. The different terminations were confirmed both by direct Z-contrast imaging and by EELS line scans, and the polarization could be determined cell by cell from the Z-contrast images. The role of the octahedral rotations became clear from the bright-field images of the O columns, which revealed the expected checkerboard pattern of tilts (shown schematically in Figure 2e) except near the interface of the MnO2-terminated LSMO, as seen in the inset to Figure 2a. The averaged line profiles show the rotation angles to be fully quenched in this region, recovering to bulk values about 15 nm into the BFO film. The (La,Sr)O-terminated LSMO shows no quenched region, but the rotation angles are one-half the bulk values, and the film has no polarization in this region. It is remarkable that such very different behavior could result from the different octahedral tilt patterns imposed by the terminating monolayer, and this underscores the sensitivity of properties to the precise atomic coordinates.
Octahedral tilt and polarization mapping in BiFeO3 (BFO): (a–b) scanning transmission electron microscope (STEM) bright-field images showing oxygen as bright spots, taken in the [110] pseudocubic orientation, of films grown on (a) MnO2-terminated La0.7Sr0.3MnO3 (LSMO) and (b) (La,Sr)O-terminated LSMO. The derived octahedral tilt maps (insets) show checkerboard patterns of positive (white) and negative (black) tilt angles. (c–d) Line profiles of octahedral tilts averaged over vertical rows of the respective tilt maps in (a–b): positive tilts in red, negative tilts in green. The solid lines in each graph represent the tilts of the respective bulk BFO (blue) and LSMO (orange). (e) Schematic showing how the structural parameters of a BFO unit cell oriented to the [110] psuedocubic direction can be measured from the STEM image. Note: a x, out-of-plane lattice spacing; a y, in-plane lattice spacing; d z, out-of-plane cation displacement; d y, in-plane cation displacement; θ, octahedral tilt. Reproduced with permission from Reference 39. © 2013 Wiley-VCH.
In general, however, rotations are three-dimensional (3D), and other distortions such as the Jahn–Teller distortion might also be important. In Figure 2e, the exact O and cation positions carry this information. However, the two O positions along each edge of the octahedra are too close to be resolved at today’s resolution and blur into a single shape in the image. Although analysis of the exact shape might hold promise for extracting such information,Reference Borisevich, Ovchinnikov, Chang, Oxley, Yu, Seidel, Eliseev, Morozovska, Ramesh, Pennycook and Kalinin37 higher intrinsic resolution would make the task a whole lot easier. The distortion of an interfacial octahedral layer connecting two different tilt patterns must necessarily be different from either of the individual patterns. In general, it comprises a mixture of different distortion modes, which ultimately generates a pattern unique to the interface, as indicated in Figure 3.
Schematic showing oxygen octahedral deformations at the interface between two perovskite oxides, one with untilted octahedra (blue) and the other with tilted octahedra (beige). The interfacial octahedra (pink) are forced to undergo a complex distortion. Shown below are the possible components of the resulting distortion, such as (left to right) Jahn–Teller elongation, polar off-centering, and additional rotational modes. Oxygen atoms are in red, A-site atoms are in green, and B-site atoms are in gray and blue. Reproduced with permission from Reference 65. © 2010 American Physical Society.
However, it is not only ferroelectrics that would benefit from imaging with improved resolution. The origin of the conductivity at the LaAlO3–SrTiO3 interface is another good example of a structure–property relationship. Careful analysis of charge transfer by EELS and of polarization by imaging of atomic positions can distinguish between an intrinsic mechanism based on the polar catastrophe scenario (the valence mismatch between the polar LaAlO3 and the non-polar SrTiO3) and extrinsic mechanisms such as interdiffusion or O vacancies.Reference Cantoni, Gazquez, Miletto Granozio, Oxley, Varela, Lupini, Pennycook, Aruta, di Uccio, Perna and Maccariello40 Again, higher resolution could significantly reduce the error bars in such analyses, which would facilitate the study of a larger range of materials and open the door to an enhanced understanding of the origin of many more interfacial properties.
Imaging thermal vibrations
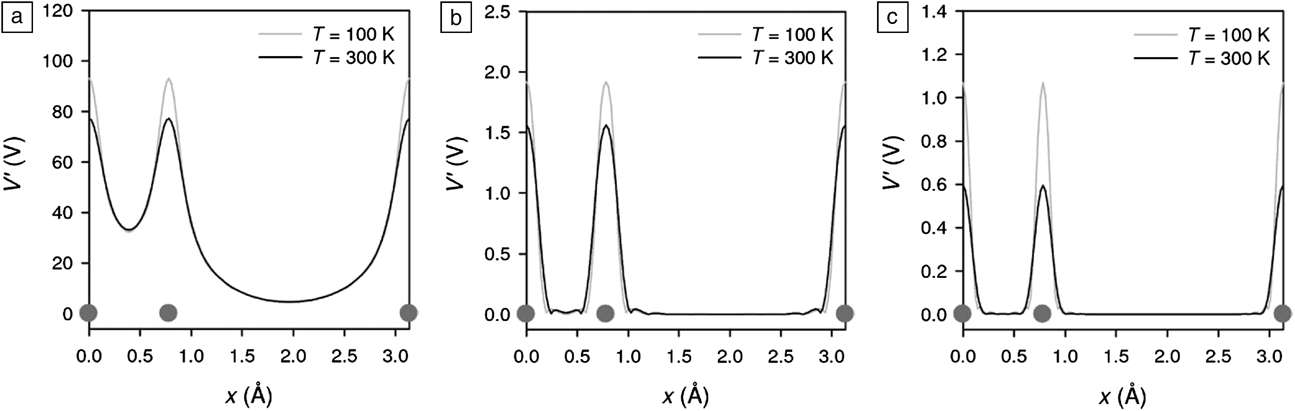
The ultimate resolution in a Z-contrast image is the width of the nuclear scattering potential. As we push to higher resolution, we will need to increase the inner and outer angles of the HAADF detector, which would force higher-angle scattering from closer to the nucleus. The width of the scattering potential would then necessarily become smaller. Figure 4 shows how this occurs for the case of Si in the [112] orientation,Reference Peng, Oxley, Lupini, Chisholm and Pennycook41 where pairs of closely spaced columns (referred to as dumbbells) are separated by only 0.78 Å. The potential for the bright-field image is sufficiently broad that it does not reach zero between the columns. However, the HAADF potentials do reach zero between the columns, and the higher detector angle has a narrower potential. The size of the atom depends on how you see it—the size decreases as the detector angles increase. Thermal vibrations provide the ultimate limit to HAADF resolution, and even at absolute zero, atoms are vibrating with quantum zero-point energy. The figure shows that the effect of thermal vibrations is to broaden the potential and reduce the peak intensity. As the image resolution increases, one expects to be able to see the effects of thermal vibrations directly in the image.
Scattering potential V′(V) of Si in the [112] orientation for (a) bright-field imaging, (b) annular dark field imaging with a detector spanning 45–200 mrad, (c) high-angle annular dark field (HAADF) imaging with a detector spanning 90–200 mrad, for temperatures (T) of 100 and 300 K. The Si atom positions are marked as gray circles. The effective size of the atom decreases with higher scattering angles. Reproduced with permission from Reference 41. © 2008 Wiley.
Today’s resolution is insufficient to see the effects of thermal vibrations directly. Nevertheless, we can see their effects through their influence on image intensity. Figure 5 shows how particular sites in a decagonal Al72Ni20Co8 quasicrystal appear bright, which is due to anomalously high thermal vibrations.Reference Abe, Pennycook and Tsai42 The sites are quasi-periodically correlated and appear bright in either a medium-angle annular dark-field image or a regular HAADF image if the sample is heated. The contrast arises through the Debye–Waller effect on scattering amplitudes (a reduced scattering amplitude as a result of atomic vibration), and quantitative analysis of the intensities reveals the root-mean-square thermal vibration amplitude to be ∼0.1 Å. Clearly, if the resolution were to approach this level, we would be able to image thermal vibration amplitudes directly in the normal Z-contrast image as a blurring of the image of an atomic column. We would be able to see anisotropy of thermal vibrations just from the shape of the atom column, at least in the two dimensions perpendicular to the beam direction. This would bring us the accuracy of synchrotron studies for quantifying thermal vibrations but with the ability to study atom columns at interfaces, grain boundaries, or nanocrystal surfaces. We would be able to study single atoms in two-dimensional materials such as graphene. Even with today’s resolution, evidence for a fluxional, liquid-like surface layer on a <2-nm CdSe nanocrystals has been deduced to be the origin of their white light emission.Reference Pennycook, McBride, Rosenthal, Pennycook and Pantelides43 Such dramatic effects might be abnormal, but thermal vibrations will certainly change dramatically at interfaces, and their quantitative study would be highly useful in diverse endeavors including the development of new thermoelectric materials, the elucidation of sintering in nanocrystalline materials, and the optical and electronic properties of graphene.
Images of an Al–Co–Ni decagonal quasicrystal using a 100 kV aberration-corrected scanning transmission electron microscope with an annular detector inner angle of (a) 50 mrad, giving a Z-contrast image, and (b) 35 mrad, showing quasi-periodically correlated thermal vibration anomalies as brighter patches. Their pentagonal arrangement is marked by yellow lines. (c) Image obtained at 1100 K with a 200 kV uncorrected microscope and an inner detector angle of 45 mrad, again revealing the thermal vibration anomalies. Red circles denote the 2 nm clusters of the quasicrystal structure. (a–b) Adapted with permission from Reference 66. © 2005 Annual Reviews. (c) Adapted with permission from Reference 42. © 2003 Nature Publishing Group.
Test of density functional theory
The error bars on experimentally obtained atomic positions are typically larger than can be obtained through density functional theory. However, with improved resolution and positional accuracy in the future, it will be possible to use microscope images as a test of different functionals or different theoretical schemes (e.g., Hubbard-U, time-dependent density functional theory, quantum chemistry approaches). Figure 6 shows images of a Si6 cluster trapped in a nanopore in a graphene monolayer.Reference Lee, Zhou, Pennycook, Idrobo and Pantelides28 Under the influence of an electron beam, this cluster was seen to repeatedly transform between two different configurations. Based on the images, the 3D structures of the clusters were deduced using density functional theory. The activation barrier for the transformation could then be calculated and compared with the rates seen experimentally. The right-hand (R) configuration was ∼0.6 eV higher in energy than the left-hand (L) configuration. If the jumps were thermally activated, the rate from left to right would be approximately 1012 times faster than the rate from right to left, which would mean that the metastable right-hand configuration would never be observed. However, these jumps are initiated by direct momentum transfer from the beam, which was calculated to differ by only a factor of two for the two directions, in good agreement with experimental observation. Nevertheless, the agreement between experiment and theoretical structures is not perfect. Improved resolution would provide more accurate atomic coordinates, which, in turn, would facilitate direct comparisons of different calculation schemes.
(Left) Z-contrast images of a Si6 cluster in a graphene nanopore obtained with a Nion UltraSTEM (scanning transmission electron microscope) at 60 kV beam energy and (right) corresponding lowest-energy clusters. One Si atom (shown in orange) hops repeatedly from left (L) to right (R). Note: Z, atomic number. Adapted with permission from Reference 28. © 2013 Nature Publishing Group.
Atomic resolution in three dimensions: Optical sectioning
Many structures that are critical to materials properties are nevertheless invisible to even the aberration-corrected microscopes of today. One therefore rarely even thinks of trying to study structures that do not project into well-resolved atom columns, such as grain boundaries in nanophase or polycrystalline materials or amorphous materials. Today, one can see dislocation core structures only if the dislocation line is close to being parallel to the beam direction.Reference Li, Poplawsky, Wu, Lupini, Mouti, Leonard, Paudel, Jones, Yin, Al-Jassim, Yan and Pennycook44 Even in such a favorable case, it is the structure of a kink (a likely impurity site) that controls dislocation motion, where this might well determine electronic and optical properties. If atomic resolution in the third dimension could be achieved, then maybe it would be possible to see these structures that are so important to bulk properties.
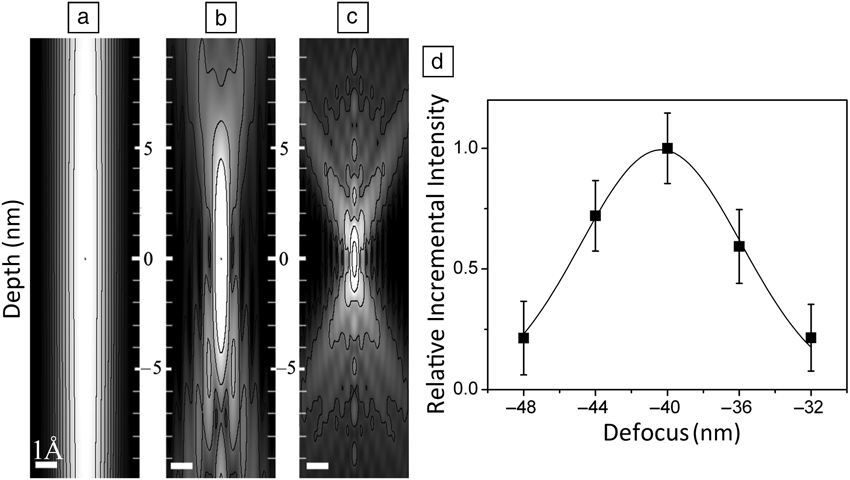
Whereas lateral image resolution improves as wavelength divided by aperture angle, depth resolution improves much faster as wavelength divided by aperture angle squared. Figure 7c shows the rapidly improving depth resolution upon aberration correction, which gives nanometer-scale depth resolution in fifth-order-corrected machines. It is impossible to know whether Feynman realized that, with a 300 kV microscope, 0.1-Å lateral resolution would imply a depth resolution of ∼3Å, which would make it possible to perform optical sectioning with atomic resolution. In optical sectioning, a focal series of images is taken, each of which represents a slice through the object, provided that the object does not scatter the beam too strongly. This approach was used to locate atoms in a 1-nm-thick layer of amorphous SiO2 in a HfO2/SiO2/Si alternative gate dielectric stackReference van Benthem, Lupini, Kim, Baik, Doh, Lee, Oxley, Findlay, Allen, Luck and Pennycook45,Reference van Benthem, Lupini, Oxley, Findlay, Allen and Pennycook46 with a depth precision much higher than the actual depth resolution. In favorable cases, such as single Pt atoms on a carbon support, a depth precision of 0.2 nm was demonstrated when the depth resolution was only 7 nm.Reference Borisevich, Lupini and Pennycook47 The reason for this discrepancy is that the focal series allows the peak intensity to be located to high accuracy, by fitting a Gaussian, for example, as shown in Figure 7d. The depth resolution is the full width at half-maximum of the intensity distribution, but the peak can be located to a precision determined by noise statistics. However, difficulties occur if the sample is a crystal at a major zone axis because of the tendency of the atomic columns to channel the electron beam, a tendency that opposes the beam coming to a focus at a specific depth.Reference Borisevich, Lupini, Travaglini and Pennycook48 The depth resolution is also degraded for extended objects, although that limitation can be overcome through a true confocal geometry.Reference Nellist, Behan, Kirkland and Hetherington49,Reference Behan, Cosgriff, Kirkland and Nellist50
Sections through the probe intensities of (a) uncorrected, (b) third-order-corrected, and (c) fifth-order-corrected microscopes showing the increasing transverse and depth resolution. Intensities are shown in logarithmic scale with 12 equally spaced logarithmic contours. (d) Intensity of a single Pt atom on a C film as a function of focus showing how the depth precision (position of peak intensity) can be determined with much greater accuracy than the depth resolution (width of the Gaussian fit). Adapted with permission from Reference 47. © 2006 National Academy of Sciences.
Recent advances in quantitative STEM imagingReference LeBeau, Findlay, Allen and Stemmer51,Reference Lebeau, D’alfonso, Findlay, Stemmer and Allen52 mean that it is possible to quantify crystal thickness to single-atom accuracy by measuring scattered intensitiesReference LeBeau, Findlay, Allen and Stemmer53–Reference Van Aert, De Backer, Martinez, Goris, Bals, Van Tendeloo and Rosenauer56 and viewing samples in multiple directions. It is even possible to perform 3D reconstructions with atomic resolution.Reference Van Aert, Batenburg, Rossell, Erni and Van Tendeloo57–Reference Goris, De Backer, Van Aert, Gómez-Graña, Liz-Marzan, Van Tendeloo and Bals60Figure 8 shows an example of the determination of the thickness of AlN to single-atom precision.Reference Ishikawa, Lupini, Findlay, Taniguchi and Pennycook54 Single Ce atoms are easily visible in such a light matrix, and they are seen to move around under the influence of the electron beam. This means that, by taking a time series of images, the thickness of every column in the field of view could be measured even if the Ce atom were located within the column for only part of the time. However, determining the depth of the Ce atom within the specimen is much more difficult. As a result of channeling, the Ce intensity is a monotonic function of the column length for only a few unit cells,Reference Hwang, Zhang, D’Alfonso, Allen and Stemmer61 certainly not for the thickness imaged here. However, the shape of the Ce atom image is also a function of depth inside the AlN, and by fitting not only the peak intensity but also the mean signal level and atom shape, it is possible to uniquely identify the Ce atom depth, as shown in Figure 9.Reference Ishikawa, Lupini, Findlay, Taniguchi and Pennycook54 Ce atom A is located nine atoms deep in a 15-atom column, whereas atom B is eight atoms deep in a 16-atom column. Whether the surface step is on the top or the bottom of the crystal, the atoms are near neighbors, as shown in Figure 9d. Hence, we have determined the diffusion pathway in three dimensions.
Z-contrast images of a Ce atom in AlN obtained by averaging of a time series of images: (a) frames 1–19, (b) frames 21–40 after the atom jumped from column A to column B, with intensities indicated as percentages of the incident beam. (c) Schematic of the structure, where Ce is shown in green, Al in pink, and N in blue. (d) Thickness map in units of atoms determined from quantitative comparison to frozen phonon image simulations. Note: Z, atomic number. Reproduced with permission from Reference 54. © 2014 American Chemical Society.
Ce atom depth determined by quantitative comparison of Z-contrast image profiles for (a) column A for Ce as atoms 8, 9, and 10 in the column, showing position 8 as the best fit to the experimental profile (red circles) and (b) Ce atom B located at position 8. (c–d) Insets compare experimental and simulated images. Schematics of the structure viewed along (c) the  $\left[ {11\bar 20} \right]$ direction and (d) the orthogonal
 $\left[ {1\bar 100} \right]$ direction, showing that the Ce atom hops between two next-neighbor positions. Note: Z, atomic number; ADF, annular dark field. Reproduced with permission from Reference 54. © 2014 American Chemical Society.
The situation would be much easier if we could open the probe-forming aperture to 100 mrad. The angular range over which strong channeling occurs is only on the order of 10 mrad, so only 1% of the beam would be affected by channeling, even in a zone axis of a crystal. The Ce atom could then easily be located to single-atom accuracy, and if a column were to contain two Ce atoms, then each could be located by optical sectioning. Indeed, because we would no longer need to rely on channeling to resolve atomic columns, why tilt the crystal to a zone axis at all? It would be beneficial to be away from a zone axis, as this would increase the vertical separation between atoms at any given probe position, giving higher precision for each individual atom. Of course, the optimal conditions, detector angles, dose, scan rates, and so on all remain to be explored, but this possibility could significantly change the way microscopy is performed.
Conclusions
The few examples presented here show that there is much to gain from continuing to push toward achieving Feynman’s challenge of making the electron microscope 100 times more powerful. We have achieved a factor of 20, which has given rise to remarkable gains in our ability to see atomic structure, composition, and bonding. Our ability to link atomic structure to key interfacial and macroscopic properties has been dramatically improved. Pushing to still-higher resolution translates directly into higher precision in bond lengths and bond angles, greatly enhancing our ability to understand how to tune the functionality of materials including complex oxides, thermoelectrics, and nanomaterials. However, perhaps the more dramatic impact would be the ability to see structures that are not periodic, to see in three dimensions, atom by atom. Such high-angle, so-called “random” grain boundaries are structures that we cannot see today. But are they really random? Are the structures of glasses truly amorphous or actually nanocrystalline? To test density functional theory, to see thermal vibration ellipses, to image point defects diffusing inside materials—all of these would be significant advances. These are fundamental physics issues as well as key materials issues. Atomic resolution in the depth direction would mean that we could do surface science, just by “looking at the thing,” without the need for surface periodicity. We would be able to image an interface monolayer-by-monolayer, finally distinguishing roughness from interdiffusion.
Would the sample survive? This same question arose with the first generation of aberration correctors and again with the second. Each time, the gain in the signal-to-noise ratio and available image contrast meant that images could be obtained with a lower rather than a higher dose. Many samples survived. We still do microscopy, and we obtain vastly more data and scientific insights today. The same would be true for the next-generation aberration corrector.
The whole issue really comes down to engineering. Achieving Feynman’s challenge will require better electrical and mechanical stabilities, improved accuracy in measurement of aberrations, and maybe improved corrector designs. Yet, as Feynman pointed out, these are “not against the laws of physics.”
Acknowledgments
The author expresses his gratitude to his colleagues E. Abe, A.Y. Borisevich, M.F. Chisholm, J. He, J.-C. Idrobo, R. Ishikawa, S. Kalinin, Y.-M. Kim, J. Lee, A.R. Lupini, P.D. Nellist, S.T. Pantelides, K. Sohlberg, M. Varela, Z. Yang, and W. Zhou for the research collaborations presented here, as well as R. Ramesh and the faculty in the Department of Materials Science and Engineering at the University of Tennessee.
Stephen J. Pennycook is a professor in the Department of Materials Science and Engineering at the National University of Singapore and adjunct professor in the Department of Materials Science and Engineering at the University of Tennessee. Previously, he was a Corporate Fellow in the Materials Science and Technology Division of Oak Ridge National Laboratory and leader of the Scanning Transmission Electron Microscopy Group. He received his PhD degree in physics from the Cavendish Laboratory, University of Cambridge, in 1978. He is a Fellow of the Materials Research Society (MRS), the American Physical Society, the American Association for the Advancement of Science, the Microscopy Society of America, and the Institute of Physics. Pennycook is a recipient of the MRS Medal, Microbeam Analysis Society Heinrich Award, Institute of Physics Thomas J. Young Medal and Award, and MRS Innovation in Characterization Award. He has authored 38 books and book chapters and over 400 publications in refereed journals, and he has given over 200 invited presentations on the development and application of atomic-resolution Z-contrast microscopy and electron energy-loss spectroscopy. Pennycook can be reached by email at spennyco@utk.edu.