Introduction
The most well-known perspective on regional differences in political orientations is Lipset and Rokkan’s (Reference Lipset and Rokkan1967) cleavage model for the industrial societies. Lipset and Rokkan identified the regional division as a centre–periphery cleavage. It was a ‘conflict between the central nation-building culture and the increasing resistance of the ethnically, linguistically and religious subject population in the provinces and peripheries’ (Lipset and Rokkan, Reference Lipset and Rokkan1967: 10; emphasis in the original). Lipset and Rokkan’s work was based on the historical development of the various cleavages, and since their writings, territorial politics and regional differences in political orientations may have changed. Territorial politics became central in West European countries in the late 1960s and the 1970s. In the 1980s there were signs of a stabilization of territorial politics, and from the late 1980s there was a new wave of regionalism which – according to Keating – was impelled by functional pressures on the state combined with new forms of political mobilization and a redefinition of the social and economic meaning of territory (Keating, Reference Keating1998: Ch. 4).
The central tenets of this new regionalism are that politics has been re-territorialized along several dimensions. Keating (Reference Keating2006: 142–145) identifies such re-territorialization along four dimensions: economy, culture, politics and, as a separate point, the welfare state. Regional cultures, including regional identities, are then important components of the new regionalism; they may have revived and even been invented as a basis for political mobilization (Keating, Reference Keating2008: 143–144).
Similar perspectives have been formulated within political geography. In an influential article, Gilbert (Reference Gilbert1988) stresses culture as a prime point of departure, concentrating on issues such as regional identification. The region is understood as a set of cultural relation between a specific group and a particular place (see also Paasi, Reference Paasi1996, Reference Paasi2004). Other researchers focus, however, more on de-territorialization as an important process. Mlinar (Reference Mlinar1992) focuses on the impact of individualization and globalization in European societies. Territorial communities are losing their traditional identity. Belongingness to specific territorial units is generally diminishing in importance as an explanatory factor of the characteristics of the individual or the group. The number of non-territorial actors is increasing, and territorial proximity is becoming less important for the definition and explanation of social and political behaviour. Notions like ‘the end of geography’ (O’Brian, Reference O’Brian1992) and ‘the end of territory’ (Badie, Reference Badie1995) have been used to describe the diminishing role of territorial differences.
Other researchers see both a de-territorializing of existing identities and interests and a re-territorializing on the basis of localized economic interests as consequences of the progressive expansion of globalization (Strassoldo, Reference Strassoldo1992; Scholte, Reference Scholte1996; Brenner, Reference Brenner1999a, Reference Brennerb; Agnew, Reference Agnew2001; Berezin, Reference Berezin2003).
Based on the literature on new regionalism and various processes of re- or de-territorialization which is indicated in the literature, differences in political orientations between the centres and the peripheries might have been reduced, but new differences might also have been created between regions with different economic and political developments.
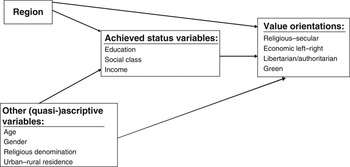
In this article, I will examine regional differences in social and political value orientations. I identify four central sets of value orientations and examine the relationship between regions and these orientations on the basis of the causal model shown in Figure 1. Region and several other structural variables that have a more or less ascriptive character are considered prior to the structural achieved status or class variables. All of these variables influence value orientations because they all are socio-structural variables that influence political orientations.
Casual model for the relationship between region, other socio-structural variables and value orientations.

Region is not among the social background variables that are most frequently used to explain value orientations or basic political attitudes in comparative research. Empirical comparative research on the regional cleavage has mainly focused on regional differences in party choice (Rose and Urwin, Reference Rose and Urwin1975; Caramani, Reference Caramani2004).Footnote 1 There are few theoretical arguments for the comparative strength of the relationship between regions and each of the four value orientations. The empirical analysis in this article is then exploratory, and the hypotheses formulated are general and do not include expectations about comparative differences.
Below, I focus on three related research problems:
(1) Which of the four value orientations are most strongly anchored in regional differences, and in which countries do we find the largest value differences between the regions?
(2) Do we find the same ranking of the regions across the four value orientations, or do the value orientations group the regions in separate ways? Are, for example, the regions that have the most religious population those which also have the most rightist orientations regarding economic values, or do the various value orientations cut across the regional division in the sense that different regional divisions are found for the various value orientations?
(3) One possible explanation for the regional differences with regard to value orientations is that the regions have different social compositions. Can the other socio-structural variables explain the impact of region on value orientations, or is that impact unique?
The four sets of value orientations
Culture can be considered as the rich complex of meanings, beliefs, symbols, norms, and values prevalent among people in a society (Schwartz, Reference Schwartz2006: 138–139). Cultural differences can be studied along many dimensions. Values are prescriptive beliefs signifying that certain end-states or modes of conduct are personally or socially preferable to other end-states or modes of conduct (Rokeach, Reference Rokeach1973: 5–8). Political values are prescriptive beliefs that individuals would like to see implemented in the political system, and they include the forms of political participation by which individuals seek to influence politics. Value orientations may be the most central feature of culture because they express shared conceptions of what is good and desirable. Studies of values are then essential in studies of cultural differences and similarities.
Some important political value orientations can be derived from the structural cleavages incorporated in the Lipset and Rokkan model (Reference Lipset and Rokkan1967). The religious cleavage is related to religious vs. more secular values. Christian values focus on the importance of Christian morals and principles in society and politics, and on traditional moral guidelines in school and society in general. Secularization is often understood as a process whereby mundane reality is less and less interpreted from a supernatural perspective, and secular values are based on more modern norms of morality that people want to decide for themselves, without the guidelines of the church (Halman and de Moor, Reference Halman and de Moor1994).
The most important political value orientations that emerged from the Industrial Revolution were economic left–right values or left–right materialist values. These value orientations are economic in nature, and they refer, in particular, to the role of government in creating more economic equality in society vs. the need for economic incentives and efficiency. These value orientations incorporate value conflicts related to control, power, and the degree of distribution of resources in the production sphere, and they include workers’ control and state regulation of the economy vs. private enterprise, private property, and the market economy, as well as economic and social equality vs. the need for differentiated rewards for stimulating effort (Inglehart, Reference Inglehart1984: 25; Lafferty and Knutsen, Reference Lafferty and Knutsen1984; Knutsen, Reference Knutsen1995a).
The moral value dimension and economic left–right values are often referred to as ‘Old Politics’ because they capture the essence of the traditional lines of conflict in industrial society. In contrast, ‘New Politics’ refers to value conflicts emerging from post-industrial society. More specifically, New Politics-related value dimensions involve conflicts over a more modern set of issues related to, for instance, environmental quality, alternative life styles, social and political participation, minority rights, and social equality.
There are, however, different ways of conceptualizing the New Politics value dimensions. According to Ronald Inglehart, value conflicts related to materialist/post-materialist value orientations reflect the New Politics conflict dimension. Inglehart argues that ‘new’ post-materialist values are deep rooted and stand in opposition to more traditional materialist values. He identifies a ‘silent revolution’ in which a gradual value change takes place along the materialist/post-materialist (MPM) dimension. This involves a shift from a preoccupation with physical sustenance and safety values towards a greater emphasis on belonging, self-expression, and quality-of-life values (Inglehart, Reference Inglehart1977, Reference Inglehart1990). In his more recent works, the MPM values are a central component of a broader post-modernization survival vs. self-expression/well-being dimension (Inglehart, Reference Inglehart1997: Ch. 3; Inglehart and Welzel, Reference Inglehart and Welzel2005: Ch. 2).
Another way of conceptualizing ‘New Politics’ is represented by environmental vs. economic growth values. Today, this conflict is firmly rooted in the public mind, and in many West European countries conflicts over environmental values seem to be the most manifest expression of the ‘New Politics’ conflict. A clear manifestation of this is the emergence of green parties, which have gained considerable electoral support in many western democracies.
Scott Flanagan has, in a series of articles, emphasized that Inglehart’s conceptualization of value change combines two dimensions: a materialist/non-materialist dimension and a libertarian/authoritarian dimension (Flanagan, Reference Flanagan1987; Flanagan and Lee, Reference Flanagan and Lee1988, Reference Flanagan and Lee2003). The overarching concept that integrates libertarian values is self-actualization, and the central value orientations within the notion of libertarian values are autonomy, openness, and self-betterment. The authoritarian value orientation ‘designates a broader cluster of values, which, along with concerns for security and order, includes respect for authority, discipline and dutifulness, patriotism and intolerance for minorities, conformity to customs, and support for traditional religious and moral values’ (Flanagan, Reference Flanagan1987: 1305). The libertarian/authoritarian value orientations are also the central components in Herbert Kitschelt’s (Reference Kitschelt1994, Reference Kitschelt1995) important works on changes in the party systems of western democracies. In essence, Kitschelt’s conceptualization of libertarian values is that they emphasize maximum social and democratic participation and individual autonomy in both politics and culture, whereas authoritarian values emphasize hierarchical arrangements in politics, together with a limitation of diversity and individual autonomy in cultural expression.
Theoretically, it is reasonable to argue that the MPM value orientation incorporates significant aspects of both of the other two post-industrial value dimensions and therefore overlaps considerably with them.Footnote 2
On the basis of the above discussion, I will use the following central value dimensions for analysing the relationship between regions and value orientations:
(1) Religious beliefs, or religious vs. secular values (Religious v.);
(2) Economic left–right (Econ. lr.);
(3) Libertarian/authoritarian (Lib./aut. v.); and
(4) Green values, or ecology vs. growth orientations (Green v.).
The indicators that are used for construction indices for the four sets of value orientations are shown in Appendix 1, and the abbreviations used above will be used in the tables below for the indices tapping these orientations.Footnote 3
Hypotheses
Below, I formulate some general hypotheses for each of the three research problems.
The relative strength of the regional differences
Lipset and Rokkan (Reference Lipset and Rokkan1967: 10) indicated that the regional cleavage, to a large extent, could be explained by the other social cleavages. The social composition of the various regions was a main explanation for the regional differences in voting behaviour. Both the class cleavage and the religious cleavage have historically had a regional dimension (Keating, Reference Keating1998: 24–26), and since the two Old Politics value orientations are closely associated with these structural cleavages, we expect that the Old Politics orientations are more strongly correlated with region than the New Politics orientations. However, the class cleavage, which is the most important functional-economic cleavage, basically tends to cut across the regional dimension and has historically contributed to smaller regional differences, particularly regarding support for class parties (Caramani, Reference Caramani2004).
The impact of New Politics values can be coupled to the new regionalism literature. Regional differences along these orientations may be part of the re-territorialization process that is so central within this perspective.Footnote 4 New Politics values can then also be expected to vary between regions, although these values do not reflect historically manifest cleavages.
Based on the traditional literature on regional differences in political orientations, I hypothesize that:
(1.1) Old Politics orientations will be more strongly anchored in regional differences than New Politics orientations.
(1.2) Among the Old Politics orientations, religious–secular values will have the strongest regional anchorage.
Based on the literature on new regionalism, I formulate a competing hypothesis to the first one above:
(1.3) New political values may have a strong regional anchorage, perhaps even stronger than Old Politics values.
The grouping of the regions along the various value orientations
The approach in this article takes as a point of departure that the number of dimensions along which regions can vary regarding value orientations is an empirical question and can vary between countries. In contrast to several of the studies mentioned below, that analyse cross-national differences, the dimensional space is not fixed, that is, determined before the regions enter into the analyses.
A simple and straightforward point of departure is a developmental perspective. The centres and the most economically and structurally advanced regions should have the most modern (or post-modern) value orientations, whereas less advanced regions should have more traditional values. Regions will therefore discriminate between the four value orientations in the same way because the secular, economic rightist, libertarian, and green values will be found in the same (centre) regions, and the opposite religious, economic leftist, authoritarian, and growth/anti-green values will also be found in the same (periphery) regions.
This hypothesis is partly based on the theoretical conceptualizations of the different value dimensions, empirical research about the social background of those who emphasize different value orientations, comparative analysis of differences between countries (as an equivalent to differences between regions within the same country) with regard to these orientations, and a few studies concerning regions and values.
In a comparative study of value priorities in 13 countries, based on the second wave of the European Values Study, there were clear tendencies for secular, economic rightist, libertarian, and green values to be more strongly emphasized in the economically advanced countries, whereas religious, economic leftist, authoritarian, and anti-green values were emphasized in the less advanced countries (Knutsen, Reference Knutsen1995b: 9–10).
In a study of 54 European Union (EU) regions, Beugelsdijk and Noorderhaven (Reference Beugelsdijk and Noorderhaven2003) found support for a hypothesis that economic growth was stronger in regions with so-called entrepreneurial attitudes. These attitudes were mainly variables that comprised the rightist orientations on our economic left–right index.
Existing evidence from factor analyses of value orientations indicates, however, a two-dimensional structure:
In an analysis of Europe’s ‘basic values map’, Hagenaars et al. (Reference Hagenaars, Halman and Moors2003) factor analysed a series of value and attitudinal scales and found a two-dimensional structure, both at the individual level and country level on the basis of EVS 3: one that they interpret as a dimension of autonomy vs. authority, and one dimension where one pole comprises individuals and countries emphasizing strict moral standards and highly valued societal norms, particularly the religious tradition (Hagenaars et al., Reference Hagenaars, Halman and Moors2003: 37). This two-dimensional map could be interpreted to include central components of the New Politics dimension and the religious–secular dimension, respectively,Footnote 5 whereas the economic left–right orientations were not included in the study.
Inglehart and Welzel’s (Inglehart, Reference Inglehart1997: Ch. 3; Inglehart and Welzel, Reference Inglehart and Welzel2005: Ch. 2) well-known analyses of long-termed structural development and value change are based on a two-dimensional value structure: one dimension based on traditional vs. secular–rational values, and one dimension based on survival vs. self-expression/well-being values. The most essential values in the first dimension are religious vs. more secular values, whereas MPM values are central in the second dimension. Economic left–right values do not appear to be central in either of the two dimensions, but could nevertheless be primarily located along the first dimension (Inglehart, Reference Inglehart1997: 82, Fig. 3.2; Inglehart and Welzel, Reference Inglehart and Welzel2005: Ch. 2).
In these two-dimensional maps, economic left–right values do not play a central role along any of the dimensions. It can be argued that the structural underpinning of the economic left–right dimension, social class, has historically had a strong regional anchorage in many countries (Keating, Reference Keating1998: 24–25), that this today applies to the value-based equivalent, economic left–right values, and that this regional division cuts across the other regional value-based divisions. This perspective then implies a three-dimensional solution. One dimension will distinguish between religious and secular regions; another will distinguish between economic rightist and leftist regions; and the last differentiate between regions that are predominantly materialist (or authoritarian and growth-oriented) and regions where ‘New Politics’ green and libertarian values are more widespread. In sum, value conflicts that originated in pre-industrial society, industrial society, and post-industrial society have different social anchorage, including anchorage in different regions.
We then have three evidently competing hypotheses regarding the dimensional solutions:
(2.1) One dimension where some centre regions have secular, economic rightist, green, and libertarian values whereas some other peripheral regions have the opposite orientations.
(2.2) Two dimensions where Old Politics orientations and New Politics orientations define their separate dimensions. On the Old Politics dimension, leftist and secular values define one pole, whereas rightist and religious values define the other.
(2.3) Two Old Politics dimensions defined by religious–secular and economic left–right values, respectively, in addition to a New Politics dimension determined by the two sets of New Politics orientations.
Instead of considering these hypotheses as competing with each other, I expect that to the extent that we find a one-, two-, or three-dimensional solution, they will conform to the expected patterns and reveal highly meaningful spatial configurations.
Can other socio-structural variables explain the impact of region on value orientations?
The literature on regional differences seldom explicates whether these differences are genuine or can be explained by other, more traditional structural variables. For example, Lipset and Rokkan, who considered the regional conflicts along a centre–periphery configuration, associated them with the degree to which linguistic, religious, and ethnical groups of individuals were opposed along territorial lines (Lipset and Rokkan, Reference Lipset and Rokkan1967: 10). Other socio-structural variables were then expected to explain a large portion of the impact of region. In accordance with this line of reasoning, I therefore hypothesize that, to a substantial degree, the regional differences are spurious owing to strong correlation with other quasi-ascriptive variables, or can be transmitted (as an indirect effect) via the socio-structural status variables in Figure 1 (hypothesis 3.1).
An alternative hypothesis which is more in line with the new regionalism literature is that the re-territorialization that has taken place in various countries, can not be traced back to changes in the social structure, and therefore that socio-structural variables can only to a small degree explain the value differences between the regions in the various countries (hypothesis 3.2).
Data and variables
In this study, I use the third wave of the European Values Study conducted in 1999–2000 (hereafter, EVS 3) for 13 West European countries. Two West European countries, Norway and Switzerland, did not participate in this wave. I therefore use data from these countries based on the third wave of the World Values Study (hereafter, WVS 3), which was conducted in 1995–96 for these countries.
The regions
Categorization of regions is a difficult task in a comparative project, given the country-specific character of the variable. In contrast to most other social background variables, regions are different in each country, and there is no established or standardized way of classifying regions in a comparative setting. In addition, the regions in the data set varied regarding how many were coded. The original number of categories in the EVS 3 and WVS 3 (for Norway and Switzerland) varied from 5 in Portugal, to 26 in Switzerland (the cantons).Footnote 6 Since I am using survey data, the number of regions should be limited.
The bases for the classification were the classification of regions that has been established by Eurostat (NUTS),Footnote 7 personal communication with country-experts,Footnote 8 and in some cases, empirical considerations regarding the number of cases within the various categories. On the basis of these considerations, the regions were classified into 4–10 categories in the various countries. For most of the countries, the NUTS division conforms to historical or cultural regions. Two countries deserve specific treatment because the NUTS classifications proved unsatisfactory.
In Spain, the NUTS division groups the historical and cultural regions Galicia, Catalonia, and the Basque Country into regional categories, which also comprise other regions. These regions have been treated as separate categories in the final classification of regions in Spain, and the Spanish regional division comprises 10 regions.
In Switzerland the NUTS classification deviates from the traditional Swiss classifications, which have been according to language regions and party or political system (Kriesi, Reference Kriesi1998; Klöti, Reference Klöti1998). These two alternative regional divisions have only three categories. In the Swiss case, I report the findings from all three divisions: the two traditional ones in addition to the more detailed, seven-category NUTS classification.
The final classification of regions in the 15 countries and the frequencies are displayed in the Appendix 2.
Other socio-structural variables
Apart from gender and age, the structural variables included in the model tap the central structural (cleavage) variables in Lipset and Rokkan’s model: Religious denomination taps the religious structural conflict;Footnote 9 urban–rural residence taps the economic conflict on the commodity market; the three class or status variables tap the labour market conflict; and region taps the centre–periphery conflict.
Religious denomination is tapped by two questions in the EVS/WVS surveys. First, the respondents are asked whether they belong to any religions denomination. Then, those who indicate that they belong to a religion are asked, ‘Which one?’ Eight different denominations could be coded, but in most countries very few respondents were coded as belonging to anything other than the dominant denomination. These were grouped into one category for ‘other denominations’. However, both the Catholic Church and the Protestant (Evangelic) Church categories were kept in the religiously mixed countries Great Britain, Germany, the Netherlands, and Switzerland, and an additional category for Free Churches/non-conformists was used in Great Britain. In the Netherlands, there exist three significant denominations, and the Calvinists Rereformed Church was kept as a third category for relevant religious denominations.
The conflict in the labour market is tapped by three class variables, namely social class, education, and household income. I have used a version of the Erikson/Goldthorpe class schema to tap social class. The class variable comprises seven categories: (1) employers, (2) self-employed/employers in the primary industries,Footnote 10 (3–5) higher-, medium-, and lower-level non-manual workers, and (6) skilled and (7) unskilled manual workers. Education is tapped by a question about the age when the respondent completed full-time education, and age-range varies from 12 to 26 years.Footnote 11 The household income variable was tapped by showing the respondents a scale of income comprising 10 categories, and having them place their household income into one of these categories.
The cleavage in the commodity market is tapped by urban–rural residence, which, in the international values studies, is measured by a survey question about the size of the town or locality where the respondent lives. There were seven or eight response categories, depending on the size of the largest cities in the given countries.Footnote 12
Empirical analysis
Correlation between regions and value orientations
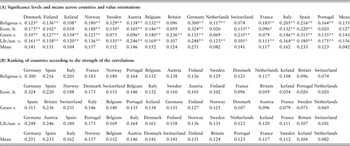
Table 1 shows the correlations between regions and the four sets of value orientations by means of the η-coefficient. The means across the 15 countries for each set of value orientations, and the mean for each country across the four sets of value orientations are also calculated. In the bottom part of the table, the countries are ranked according to the size of the correlations for each set of value orientations and according to the mean for all the four value orientations.
Correlations between regions and value orientations

Religious v., religious–secular; Econ. lr., economic left–right values; Green v., green values; Lib./aut. v., libertarian/authoritarian values.
The correlation coefficients are η-coefficeints.
It is not the Old Politics orientations that are unambiguously most strongly correlated with region. There are only small differences in the strength of the correlations between the four sets of value orientations and region according to the average correlations. The strongest average correlation is found for libertarian/authoritarian and religious–secular values, whereas the average correlation is somewhat lower for the other two orientations.
Libertarian/authoritarian values are most strongly correlated with region in six countries, whereas the other orientations are most strongly correlated in two to four countries. Religious–secular values are then, on average, more strongly correlated with region than economic left–right values, in accordance with hypothesis 1.2; but Old Politics orientations are generally not more strongly correlated with region than New Politics orientations. The results indicate no clear support for any of the alternative hypotheses about the relative strength of Old and New Politics orientations, but since region has a somewhat stronger correlation with green values than economic left–right values, the findings lean towards the hypothesis derived from the new regionalist literature (hypothesis 1.3).
The correlations are moderate, although most correlations are significant.Footnote 13 The moderate-sized correlations are also shown by the fact that only 10 of the 60 correlations are above 0.20 and only three are above 0.30.
In Germany, the strength of the correlation is outstanding, in particular for the Old Politics orientations, in a comparative perspective, and the correlation is largest for three of the four value orientations; although the correlation for libertarian/authoritarian values in Austria is on the same level. The correlations in Spain are also large, in particular for Green values, which is larger than in any other country.
It is difficult to find any clear pattern regarding the comparative strength of the correlations between regions and value orientations, but for religious values the correlation is strongest in many of the Catholic countries. Apart from Germany and Norway, all of the Catholic countries are ranked higher than the Protestant and religiously mixed countries. In the Catholic countries, there is obviously a considerable division between religious and secular regions. Green values are most strongly correlated with region in Britain and Switzerland after Spain, whereas libertarian/authoritarian values are most strongly correlated in Germany and Austria.
As to the mean for the four value orientations according to country, the correlations vary moderately, from about 0.25 in Germany and 0.23 in Spain, to 0.08 in the Netherlands. For 12 of the 15 countries the average correlation is within the range of 0.10 to 0.16.Footnote 14
In Switzerland, I also correlated the value orientations with two alternative groupings on the cantons (see above). The correlations based on these alterative regional divisions showed smaller correlations or correlations of the same size, and those reported in Table 1 based on the seven-category division. The correlations for religious values were not significant for the two alternative divisions either. They were not significant for economic left–right values in contrast to those for the seven-category variable, and the correlation for New Politics orientations were smaller for the alternative regional divisions. The average correlations for the four value orientations were 0.095 and 0.084 for the regional variables based on language and party system, respectively, compared with 0.141 for the seven-category variable. I therefore use the seven-category NUTS-based regional division for Switzerland in the analyses below.
The grouping of regions: results from discriminant analysis
In order to find dimensions that group the regions according to their placements on the four value orientations, I use discriminant analysis because it is a powerful technique for analysing the degree to which the regional differences in value orientation can be ordered along a single dimension or several dimensions (Klecka, Reference Klecka1980):
• Discriminant analysis is used to study the difference between two or more groups (a nominal-level variable) on the basis of a set of discriminating variables. In our case, the group variable is region, and the discriminating variables are the four sets of value orientations.
• The technique is appropriate for studying the ways in which groups differ: whether one is able to ‘discriminate’ between different groups on the basis of some set of characteristics, how well these characteristics discriminate, and which of these are the most powerful discriminators.
• To study the nature of group (regional) differences, the technique provides a set of canonical discriminant functions. A canonical discriminant function is a linear combination of the discriminating variables, derived such that differences between the groups (according to the group means) are maximized for the first function; the second function is also derived so as to maximize the differences between the groups, but under the added condition that values of the second function are not correlated with values of the first function, and so forth. Each discriminant function corresponds to one dimension in a spatial perspective, thus indicating an empirical dimension where the regions differ regarding their value orientations.
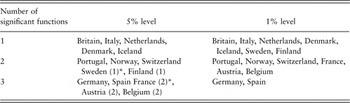
Table 2 sums up the number of significant discriminant functions in each country according to the 5% and 1% significance level criteria.
Number of significant functions in discriminant analyses based on regions and four sets of value orientations

*(1) and (2) means that only one and two functions are significant with 1% significance level.
The number of significant functions (at the 5% level of significance) varies from one to three functions with five countries in each of the three groups as shown in Table 2. With a significance level of 1%, one significant function is found in seven of the 15 countries.
According to the one-dimensional hypothesis (hypothesis 2.1), secular, economic rightist, green, and libertarian values should define a centrist pole, whereas the opposite values should define a periphery pole among the regions. Given that religious, economic leftist, green, and libertarian values have been assigned high scores on the composite indices, the two Old Politics and the two New Politics orientations should all have significant discriminant coefficients on the same function, but opposite signs on the discriminant coefficients on a common discriminant function.
Since it is not possible to show the results from the discriminant analyses for all 15 countries, I show only tables for three countries, examples where the analyses resulted in one, two, and three functions or dimensions.Footnote 15
I start by commenting on the results from the countries where the discriminant analyses resulted in only one function, and then on the countries with two- and three-function solutions. For the countries where the number of significant functions varies according to the 5% and 1% criteria, I decided to choose the solution that was most meaningful, but in some of these cases I also comment on the alternative solution.
On the basis of this criterion, I group Finland among the countries with a one-dimensional solution; Austria, Belgium and Sweden as countries with a two-dimensional solution; and France as a case with a three-dimensional solution.
The Italian, Finnish and Icelandic one-function solutions are close to the ideal solution according to the one-dimensional hypothesis. In all these three countries, all the four value orientations discriminate on one function as expected, and the regions are grouped more or less along a centre–periphery dimension.
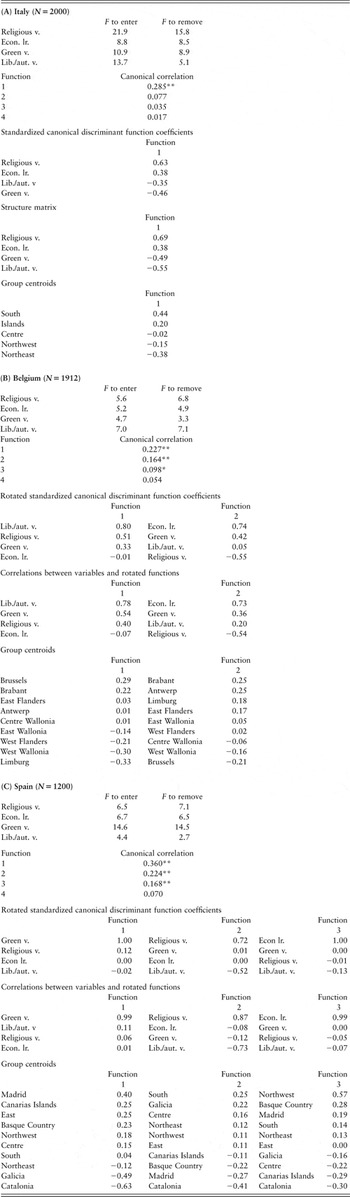
The results from the discriminant analysis from the Italian material are shown in Table 3A. I comment upon the various statistics in some detail in order to illustrate discriminant analysis and how it is a powerful technique for analysing the given research question.
A–C. Results from discriminant analyses from three countries with regions as group variable and value orientations as discriminating variables

Religious v., religious–secular; Econ. lr., economic left–right values; Green v., green values; Lib./aut. v., libertarian/authoritarian values.
The F-to-enter and F-to-remove statistics show the relative importance of the variable for discriminating between the regions across the various functions and are most relevant where there is more than one significant function (Klecka, Reference Klecka1980: 52–60). The canonical correlation coefficients measure the correlation between the discriminant function and the group centroids (see below) of the different functions (Klecka, Reference Klecka1980: 36–38). In the Italian case, only one correlation coefficient is significant, and there is therefore only one significant discriminant function.
The standardized discriminant coefficients tell us the relative contribution of different discriminant variables for determining the given discriminant function, whereas the structural coefficients are the correlations between a single discriminant variable and a discriminant function. These coefficients are equivalent to the β-weights and the r-coefficients in regression analysis (Klecka, Reference Klecka1980: 29–34).
In the Italian case, we see that according to both of these sets of coefficients, the signs of the coefficients are as expected according to the one-dimensional hypothesis, and all the four value orientations have fairly high absolute magnitude as we should expect from the hypothesis. Religious values are however, more important than the other value orientations in defining the discriminant function, whereas the importance of the other three value orientations are fairly equal.
The group centroids indicate the groups’ mean placement along a given function. Applied to our research problem, these represent the mean placement of the respondents in the various regions along a function or dimension, and thus correspond to the spatial location of the regions. We see from the Italian case that the South and the Islands are located at one pole, whereas the two northern regions, in particular the Northeast, are at the opposite pole. From the signs, we can conclude that the former regions are populated with religious, leftist, authoritarian, and anti-green individuals, whereas the opposite value orientations characterizes the regions close to the other pole.
In Finland, all four orientations have high standardized discriminant coefficients along the first function and locate the regions in such a way that the Centre region is contrasted with the Northern, Western, and Eastern regions.
In Iceland, the role of the economic left–right orientations is small but discriminates, nevertheless, in the expected direction, and the regions are grouped in a way that contrasts the Reykjavik region with the other regions. This function is then primarily defined by New Politics value orientations and religious values.
The Dutch solution resembles the expected one-dimensional pattern to some degree. Religious values and libertarian/authoritarian values are the two value orientations most strongly correlated with region. These orientations determine, first and foremost, the significant function, and they have high coefficients (with opposite signs), but green and religious values contribute as expected although with considerably smaller coefficients on the only significant function. This dimension contrasts the West vs. the East and the South. This division is in accordance with Daalder’s characterization of the South and the East in the Netherlands as the traditionalist areas (Daalder, Reference Daalder1981: 219–220).
The one-function solutions in Britain and Denmark do not fit the one-dimensional hypothesis.
In the Danish case, economic left–right and libertarian/authoritarian values are most strongly correlated with region, and these orientations have high discriminant coefficients on the significant function. They both have positive signs, indicating that they discriminate in the same direction, in contrast to our hypothesis. Religious values have a significant negative coefficient on the function, as expected. This function contrasts the radical Copenhagen area with the various Jutland regions and the Islands. These orientations then group the regions similarly in the Danish case, but somewhat opposite to our hypothesis. The Copenhagen areas (the city and its surroundings) stand out as the secular, libertarian and economic leftist areas, whereas the Jutland regions and the Islands have the opposite value orientations.
In the British case, green values are much more strongly correlated with regions than the other value orientations. This is reflected in the discriminant solution where green values are dominant, and discriminates primarily between the Green London and Scotland regions vs. the North and East of England.
A two-dimensional solution was found in six countries. Four of these solutions conform to our hypothesis about an Old and a New Politics dimension (hypothesis 2.2), whereas the other two do not.
The results from the Belgian two-dimensional solution are shown in Table 3B. We note from the F-statistics that the contributions of the four value orientations are fairly equal, which corresponds with the correlation coefficients in Table 1. Three canonical correlation coefficients are significant at 5%-level, but only two at 1%-level, and the two-function solution is preferred.
The first function is first and foremost defined by libertarian/authoritarian values, and also by religious and green values. The contribution of religious values does not fit our model for a two-dimensional solution, but we see that green values have a higher correlation with function rather than religious values. On the second function, economic left–right values and religious values have high coefficients with opposite signs as expected. The location of the various regions is shown in the table and will not be commented here.
The Portuguese two-factor solution is determined by libertarian/authoritarian and religious values for the first and second functions, respectively. The roles of the two other value orientations are small. On the first function, the North region is located at the libertarian pole, whereas Algarve, Centre, and Alentejo are located at the opposite, authoritarian pole. On the second religious dimension, the Centre region and the Lisbon region are contrasted. The two-factor solution can be interpreted as an Old Politics and a New Politics dimension, but the roles of the other two Old and New Politics orientations are minor.
In the Swedish case, we find an Old Politics and a New Politics function in accordance with the two-dimensional hypothesis. On the first function, the two Old Politics orientations are important and discriminate in opposite ways, whereas libertarian/authoritarian values are dominant on the second function. The first function contrasts the secular and leftist North and East with the more religious and rightist South and West. On the second dimension, the regions comprising the two largest cities and their surroundings are contrasted by the North, the East, and the South (libertarian and authoritarian, respectively).
Since the second function is barely significant in the Swedish case, I also examined the one-function solution. This solution conforms to a certain degree to the one-dimensional hypothesis. On this function, libertarian/authoritarian values and religious values are dominant (with opposite signs), whereas the roles of the other two value orientations are smaller but in the expected direction. This solution contrasts the regions around the two largest cities and the Öresund regions, which are then characterized by secular and libertarian values, with the West and the South.
In the Swiss case, green values are most strongly correlated with region, followed by economic left–right values. These orientations define the two significant functions in the Swiss case, but libertarian/authoritarian and religious values contribute on the two dimensions as expected, according to the two-dimensional hypothesis. One interesting aspect of the location of the regions along the two functions is that Zürich and the Eastern region have the most green and right-wing population, according to the data.
In the Norwegian case, the two Old Politics orientations are most strongly correlated with region, and each of them defines the two significant functions, although the two New Politics orientations also contribute significantly. The first dimension – determined primarily by economic left–right values – contrasts the Oslo fjord region with Trøndelag and the two economic peripheries, the North and the Inner East. The former region is economic right-wing and libertarian, whereas the other three located at the opposite pole are left-wing and authoritarian.
The second dimension is defined primarily by religious values but also to some degree by the two New Politics orientations (with green values most prominent) (with opposite signs). It contrasts the regions with the well-known counter-cultures in Norwegian politics, the West and the South, with the other regions, in particular the Oslo fjord region. The two-dimensional solution in the Norwegian case indicates that the regional axis in Norwegian politics can be grouped along an economic dimension and a cultural dimension defined primarily by the two Old Politics value orientations, economic left–right and religious–secular. These dimensions are completely in accordance with the well-known Rokkan–Valen analyses of centre–periphery dimensions in Norwegian politics (Rokkan and Valen, Reference Rokkan and Valen1964; Rokkan, Reference Rokkan1967: 403–425; Valen and Rokkan, Reference Valen and Rokkan1974).
The Norwegian solution is similar to the expected three-dimensional solution in the sense that the two first dimensions are defined by the Old Politics orientations, but New Politics do not define a separate dimension.
In the Austrian case, libertarian/authoritarian is much more strongly correlated with regions than the other value orientations, and this is reflected in the discriminant solutions, which do not fit the two-dimensional hypothesis. Libertarian/authoritarian values are dominant on the first function, but religious values also contribute significantly. This function discriminates between libertarian and secular Vienna and the other regions. The other function is based on economic left–right values and green values and contrasts different regions (East vs. Kärnen, first and foremost).Footnote 16
In Germany, and Spain, we find three significant functions, and I also use the three-function solution for France. All three solutions fit the expected pattern according to hypothesis 2.3 to some degree.
The results from the discriminant analysis based on the Spanish material are shown in Table 3C. The F-statistics indicate that green values have the largest, and libertarian/authoritarian values the lowest, discrimination power across the various functions in accordance with the correlations in Table 1.
On the three significant functions, green values, religious values, and economic left–right values define the three dimensions, but libertarian/authoritarian contribute significantly on the same function as religious values, not on the function defined by green values, as we expected from the three-dimensional hypothesis.
The location of the various regions shows interesting patterns. On the green dimension, the Madrid region is contrasted with two of the historical regions, Galicia and Catalonia, which are least green. The southern region and Galicia are the most religious regions and are contrasted with Catalonia, Madrid, and the Basque Country as most secular (and libertarian). The Northwest region and then the Basque country are the most leftist regions whereas the Catalonia and Canarias Islands are most right-wing.
The first two functions in the analysis of the German data are determined by the Old Politics orientations, whereas libertarian/authoritarian values – and to some extent green values – determine the third function. The New Länder and Berlin are important for all three functions in the sense that they are located at one of the poles on all three functions: left-wing on the first dimension, secular on the second, and authoritarian on the third. The value differences between people living in the New Länder and the regions in the Old Federal Republic are the main reason why regional differences are larger in Germany than in the other West European democracies. There are three functions and not only one because the ranking among the eastern and western regions varies somewhat. Among the western states, the Northwest and Nordrhein-Westfalen have, for example, the most economic rightist population, whereas Bavaria and the Southwest have the most religious populations.
We find a similar three-function solution in France. The first and third functions are determined by religious values and economic left–right, respectively, whereas the New Politics function is somewhat confusing, as the two New Politics orientations that determine the function have opposite signs. Libertarian/authoritarian values are, however, the most important. The religious dimension contrasts the West and the Paris surroundings close to the secular pole with several other regions located closer to the religious pole. The function defined by the economic left–right values contrasts the Northern region, Paris-surroundings and the South West (leftist) primarily with the Western region (rightist). On the somewhat confusing authoritarian/libertarian function, the Mediterranean and the Paris-surrounding regions are close to the libertarian (and anti-green!) pole, whereas the Northern regions are located at the opposite pole.
Is the impact of region unique or can it be explained by the other socio-structural variables?
To analyse the impact of the various socio-structural variables on each set of value orientations, I have carried out multivariate analysesFootnote 17 with the indices for each of the four value orientations as dependent variables. The structural variables are included in two steps after the inclusion of region (see Figure 1):
In the first step, the other (more or less) ascriptive variables are included. If the direct effect of region is strongly reduced when controlling for these variables, the correlations between region and values are spurious. In the second step, the achieved status variables are included. If the impact of region is strongly reduced, these variables can explain why region has a causal impact on value orientations. The inclusion of these variables in the two steps are called bloc 1 and 2 below.
I have first examined the portion of the bivariate correlations between region and the value orientations that persist when controlling for the other structural variables in bloc 1. Since this is not relevant for the bivariate correlations that are not significant, the analyses are based on 11 to 14 countries for each value orientation (see Table 1). Below, I only report the main findings related to the research questions.
The portion (based on the average for 11 to 14 countries) of the bivariate correlations that persists when controlling for the variables in bloc 1, varies from 73% for religious values and 85% for libertarian/authoritarian values, to about 100% for the two other value orientations. Only a small portion of the impact of region is then spurious for all orientations, according to these average calculations.
As to religious values, the largest change from the bivariate correlations to the first control (the variables in bloc 1) is found in Germany, where only 44% of the bivariate correlation persists when controlling for the other variables within the bloc. In seven other Catholic and religiously mixed countries, 50% to 79% persists. Only in the Nordic countries do very few of the bivariate correlations diminish when controlling for the ascribed variables. Due to the reduction of the coefficients in several countries, the causal impact of region is largest in Norway and Italy (compare Table 1), and the impact in Germany, which was outstanding in the bivariate case, is now reduced to fifth place in the ranking. It is natural to explain the reduction in the coefficients in relation to the religious denomination variable, which is highly correlated with religious values, and also considerably correlated with region in many countries. Closer empirical analyses show that this is the case. Nearly all reduction in the coefficients for region is caused by the control for religious denomination.
For economic left–right values, we find a significant reduction only in Denmark (23%). For some countries, such as Austria, Belgium, and Switzerland, the effect of region even increases when controlling for the other variables within the bloc. The impact of region is still largest in Germany and then in Spain and Norway, whereas the impact in Denmark is comparatively smaller than in the bivariate comparison.
For libertarian/authoritarian values, only 30% persist when the other ascribed variables are controlled for in Austria, whereas 60% to 70% persists in four other countries (Denmark, Iceland, the Netherlands, and Spain). A closer examination of which variables cause the decline in these countries shows that urban–rural residence is the main explanation in Austria as well as in Denmark and Iceland. In these countries, the urban areas are the most libertarians, and the centre regions include a large portion of those who live in the most urbanized areas. Region and urban–rural residence are highly correlated in these countries. In the Netherlands and Spain, the drop in the correlations between region and libertarian/authoritarian values is caused by both urban–rural residence and religious denomination.
The largest causal impact of region is still found in Germany and then in Portugal and Belgium, whereas the impact in Austria is smallest, even though Austria was ranked second based on the bivariate correlation (compare with Table 1).
For green values, more than 90% of the bivariate correlations persist in all countries. In two countries, the effect even increases, and the causal impact remains largest in Spain, Switzerland, and Britain.
The next research question is then how much of the causal impact of region is mediated by the three status variables. To calculate this, I start with the coefficients for region from bloc 1. These coefficients are compared with those found when the three status variables are entered into the analyses in a second (or third)Footnote 18 step.
Starting with the average statistics for the countries where the bivariate correlations are significant, we can conclude that very little of the impact of region is intermediated by social status variables. The portion that persists varies – according to the average figures – from 88% for libertarian/authoritarian values to 92% to 93% for economic left–right values and green values, to 98% for religious values. The small portion that is intermediated via these variables from region to economic left–right values is surprising.
The small portion that is transmitted via the status variables according to the average is found in most countries for all value orientations. More than 80% persist as direct causal effects in all countries for religious values, economic left–right values, and green values.
Only for libertarian/authoritarian values is a significant portion (25% to 40%) of region’s effect explained by the class variables in four countries: Belgium, Iceland, Denmark, and Sweden.
Contrary to the hypothesis 3.1, class variables are only to a small degree intermediate variables, which explains why we find regional differences in value orientations. The degree to which class variables can explain the impact of region on value orientations is not largest for economic left–right values, but for libertarian/authoritarian values.
The findings, in general, strongly support hypothesis 3.2.
Conclusions
Are there different cultures in the various regions in West European countries? In this article, I have focused on value orientations, as they are central components of culture. In the introduction, I formulated three research questions, which were tested in separate parts in the subsequent empirical analysis. I will sum up the empirical findings for each of these research questions.
The correlations between regions and value orientations are modest. The average correlations between regions and each of the four value orientations are fairly similar but somewhat larger for religious values and libertarian/authoritarian values. Old Politics value orientations are generally not more strongly coupled to regional cultures than New Politics orientations. The regional differences are largest in Germany, where we find strong and persistent (across three of the four value orientations) regional differences between the regions in the Old Federal Republic and the New Länder.
With regard to the hypotheses that were formulated about the spatial solutions from discriminant analyses, we expected one-, two-, and three-dimensional solutions based on different spatial configurations.
The one-dimensional configurations implied that there exist some (centre) regions that have secular, economic rightist, green, and libertarian regions, and (peripheral) regions with opposite value orientations. This pattern was found in four of the six countries with a one-dimensional solution: Italy, Iceland, Finland, and the Netherlands. In one of the countries where we did not find such a pattern, Denmark, economic left–right values did not fit the expected pattern since the centre capital region had economic leftist values, contrary to the expectation. The expected two-dimension solution with an Old Politics and a New Politics dimension was found in four of the six relevant countries: Belgium, Portugal, Sweden, and Switzerland. The expected three-dimensional solution with two Old Politics dimensions and one New Politics dimension was found in Germany, Spain, and partly in France. The Norwegian two-dimensional solution also resulted in two Old Politics dimensions, whereas a New Politics regional dimension was not found.
In the multivariate analysis, where we examined the causal impact of region, we found that only a small portion of the correlation between region, and value orientations was spurious when controlling for the other (quasi-)ascriptive variables, contrary to our hypothesis. Furthermore, only a small portion of the impact of region was transmitted via the three class variables in the model. To a large degree, the impact of region on value orientations is genuine, direct causal effects. To the extent that there are different regional value cultures, they can only, to a small degree, be explained by the different social composition in the various regions.
The first and third sets of competing hypotheses were derived from Old Politics, and from new regionalism and New Politics literature, respectively. Those hypotheses that were derived from new regionalism and New Politics were basically confirmed from the empirical analysis.
Appendix 1 Indicators used in indices tapping the four value orientations
Religious values
In both EVS 3 and WVS 3:
Which, if any, of the following do you believe in?
A. God
B. Life after death
C. Hell
D. Heaven
E. Sin
The index is constructed by simply summing the positive answers (yes) to these five questions and then multiplying the scores by two to obtain values from 0 to 10 (see below).
Economic left–right values
In EVS 3:
Now I’d like you to tell me your view on various issues. How would you place your views on this scale?
(For these items, the respondents were asked to place themselves on a 10-point scale: 1–10).

In WVS 3 (for the Norwegian and Swiss surveys):
1. The same as (1) in EVS 3

Questions 2 and 3 also used 10-point scales.
Green values
In EVS 3:
I am now going to read out some statements about the environment. For each one read out, can you tell me whether you agree strongly, agree, disagree, or disagree strongly?
1. I would give part of my income if I were certain that the money would be used to prevent environmental pollution
2. I would agree to an increase in taxes if the extra money were used to prevent environmental pollution
3. The government has to reduce environmental pollution, but it should not cost me any money
In WVS 3:
1. The same as (2) in EVS 3 shown above.
2. I would buy things at 20% higher than usual prices if it would help protect the environment (Likert scale as for 1)
3. Here are two statements people sometimes make when discussing the environment and economic growth. Which of them comes closest to your own point of view?
A. Protecting the environment should be given priority, even if it causes slower economic growth and some loss of jobs
B. Economic growth and creating jobs should be the top priority, even if the environment suffers to some extent
Libertarian/authoritarian values
In both EVS 3 and WVS 3:
1. Which of these statements do you tend to agree with?
A. Regardless of what the qualities and faults of one’s parents are, one must always love and respect them (A)
B. One does not have the duty to respect and love parents who have not earned it by their behaviour and attitudes (L)
2–5. Here is a list of qualities which children can be encouraged to learn at home. Which, if any, do you consider to be especially important? Please choose up to five. (11 were mentioned)
• Good manners (A)
• Independence (L)
• Imagination (L)
• Obedience (A)
6. Here is a list of various changes in our way of life that might take place in the near future. Please tell me for each one, if it were to happen, whether you think it would be a good thing, a bad thing, or don’t you mind?
Greater respect for authority (A)
7. People have different ideas about following instructions at work. Some say that one should follow instructions of one’s superiors even when one does not fully agree with them. Others say that one should follow one’s superiors’ instructions only when one is convinced that they are right. Which of the two opinions do you agree with?
• Should follow instructions (A)
• Must be convinced first (L)
(A) means that the alternative is considered as an authoritarian option, whereas (L) means that it is a libertarian option.
All indices are constructed as additive indices where the various items are weighted equally, and the final indices are assigned values from 0 to 10.
Appendix 2 The regional divisions with number of cases and frequencies