In some countries, political participation is a dangerous business. In Hun Sen’s Cambodia, where he has been in power for most of the past three decades, government-sponsored election violence and intimidation are among the tools the incumbent Cambodian People’s Party has used to remain in power.Footnote 1 As Sen himself threatened: ‘I not only weaken the opposition, I’m going to make them dead […] and if anyone is strong enough to try to hold a demonstration, I will beat all those dogs and put them in a cage’.Footnote 2 In Belarus, facing protests after the corrupt 2006 elections, President Alexander Lukashenko openly vowed to ‘break the neck immediately–like a duckling’ of any demonstrators.Footnote 3 He has been in power since 1994. Sen and Lukashenko are just two of dozens of incumbent leaders who have used election violence–including physical harassment of the opposition and significant violence involving civilian deaths–before, during or after elections.Footnote 4
Election violence is often discussed in the context of other methods to manipulate elections, such as fraud, or as a subtype of political repression more generally.Footnote 5 Although governments seeking to rig elections often mix methods of manipulation, we focus in this article on government-sponsored election violence because it is a form of election manipulation that is distinct from–and has generally received less attention than–election fraud, corruption and vote buying.Footnote 6 As our data show, not all governments that use election violence also use fraud, and vice versa. Among methods of election manipulation, violence poses the greatest threat to the personal safety of the opposition and voters, and it may have distinct causes and consequences from political repression more generally. Moreover, government-sponsored election violence and intimidation are widespread and occur across nearly all regime types.Footnote 7
It is often assumed that election violence is used precisely because it works in favor of those who use it.Footnote 8 Although research on election violence is growing rapidly, it is not known whether election violence–like election fraud–actually helps incumbent governments to stay in power, either in terms of their ability to win elections or to withstand post-election challenges.Footnote 9 We explore whether election violence actually ‘works’ for incumbents by focusing on the effects of pre-election violence during two points of the election cycle when an incumbent’s hold on power is most likely to be threatened: (1) the election itself, which they could lose outright and (2) the post-election period, when protest movements can lead incumbents to resign, hold new elections or otherwise make significant concessions.
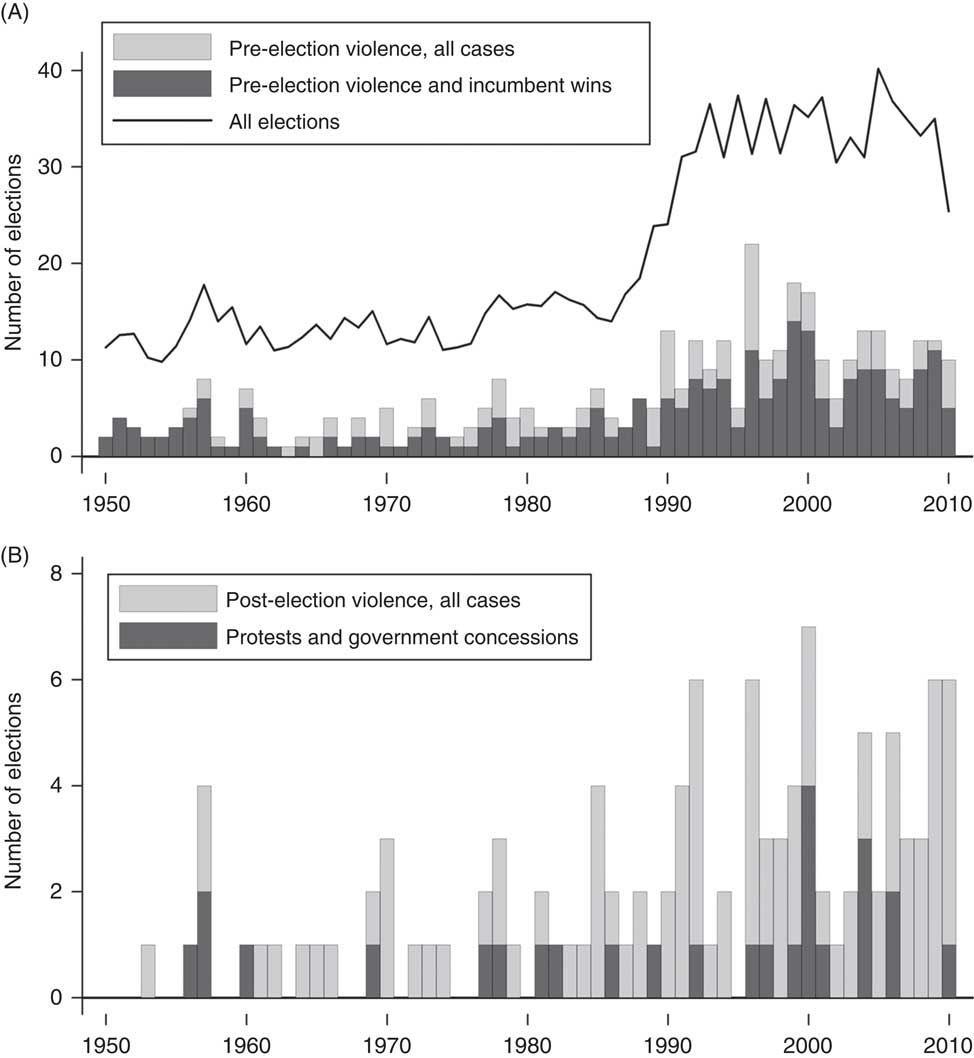
The historical record reveals that election violence is not a guaranteed strategy for maintaining power. Panel A of Figure 1 plots all instances of government-sponsored pre-election violence between 1950 and 2010 and shows that government-sponsored election violence is not always followed by incumbent victory. Leaders can also face challenges to their rule in the immediate post-election period, in part because elections (especially manipulated or violent elections) can facilitate post-election protests against the government. Panel B shows that when post-election protests occur, they have often been followed by significant costs to the incumbent (which we label ‘government concessions’), including the annulment of election results, incumbent resignation or, in a few cases, a military coup. In short, leaders may use election violence because they believe it will work in the short term, but violence does not guarantee that incumbents will win elections––and even when incumbents win, the use of violence as a tactic of manipulation can increase post-election challenges to their rule.
Trends in election violence and its consequences over time Note: based on data from the National Elections Across Democracy and Autocracy dataset (Hyde and Marinov Reference Hyde and Marinov2012). Elections with pre-election violence (Panel A) are those in which the government harassed the opposition or used violence against civilians. Elections with post-election concessions (Panel B) are those which are followed by election annulment, incumbent resignation or a coup. We explain these data in more detail in the empirical section of the article.

We evaluate the relationship between an incumbent government’s decision to use election violence and its ability to withstand challenges to its rule using a unique election-event dataset that measures pre-election violence, post-election protest and post-election concessions of incumbent power. The full dataset illustrated in Figure 1 contains 1,322 potentially competitive elections in 122 countries, including 339 elections in which the incumbent government used pre-election violence.Footnote 10
Drawing on these data, we show that a government’s decision to use election violence in the pre-election period–much like the decision to use fraud–increases the probability that the incumbent wins the election. We also show that incumbents who use pre-election violence are more likely to face post-election protests. These protests, in turn, increase the risk of costly power concessions. In fact, incumbents who face post-election protests are more than three times as likely to be forced to resign or hold new elections. Moreover, government-sponsored violence against protestors does not improve an incumbent’s chances of surviving these post-election challenges. In short, even though election violence has historically increased an incumbent’s chances of winning an election, the longer-term consequences of using violence include an increased risk of post-election protests, which can result in serious post-election repercussions.
These differences in the short- and medium-term effects of election violence reflect the changing options available to citizens and opposition parties over the course of an election cycle. Within electoral regimes, at least in theory, elections represent a legitimate and institutionalized mechanism through which individuals and parties can compete for power. Opposition parties and individual voters who are dissatisfied with the regime have numerous options in the pre-electoral period, most obviously supporting an opposition party or candidate and trying to gain elected office through legitimate means. Incumbent-sponsored election violence can be used to coerce would-be opposition supporters into staying home or intimidate them into voting for the regime. Additionally, election violence (like fraud) may increase the probability of incumbent victory through another mechanism: by provoking opposition parties to boycott. Although winning a boycotted election may carry significant reputational consequences for the government, a well-executed election boycott also makes an incumbent victory a near certainty.Footnote 11
Thus violence makes incumbent victory more likely by provoking election boycotts and biasing voter turnout in favor of the incumbent.Footnote 12 If the incumbent wins the election, individuals wishing to challenge the incumbent’s hold on power must either accept defeat or take to the streets in protest. But using pre-election violence can make post-election protest more likely, and post-election protest, in turn, increases the likelihood that the incumbent will be forced to make power concessions.Footnote 13
This seemingly inconsistent behavior of the opposition–manipulated into conceding the election yet willing to engage in risky post-election anti-regime protest–makes sense when one considers that the pre- and post-election periods have different focal points for collective action.Footnote 14 Even when the government blatantly employs pre-election violence, pre-election protest aimed at ousting the government is rare for many of the same reasons that collective action against repressive governments is rare in general. In the absence of a clear focal point or knowledge about how many other citizens are willing to challenge a repressive government, any individual effort to challenge the regime is likely to come with ‘high costs coupled with very low chances of success’.Footnote 15 Additionally, before elections, opponents of the government still have the ability to challenge the incumbent using formal and proximate institutional means, either by winning votes or by attempting to undermine the election’s legitimacy with a boycott. Citizens may prefer to wait and see whether other people vote, how many others participate in a boycott, whether the incumbent wins (and by how much), or how much violence (and fraud) is ultimately used.
Pre-election protest is rare, and when it does occur, it is usually in an effort to pressure the government to improve the quality of the electoral process rather than to fundamentally challenge the regime. In the post-election period, however, citizens and parties have gained information about the incumbent’s behavior and popularity. The range of potential options has also narrowed considerably, and protest is often the only remaining option when elections have failed to unseat a corrupt, fraudulent or violent incumbent government.
This article builds on recent work on election manipulation and authoritarianism as well as ‘democratization by elections’ in authoritarian regimes.Footnote 16 These literatures debate the role that elections play in political transitions, including whether election manipulation is a sign of democratization or a tool that electoral autocrats use to stay in power. By examining the consequences of election violence for the governments that use it, our study contributes to related research agendas that focus on the relationship between violent strategies and regime type or the role of violence in explaining political transitions. Our central contribution is to show that, although government-sponsored election violence increases the chances that incumbents win the election, violence can undermine the longer-term benefits of election victory by generating risky post-election dynamics such as mass protest.
The article presents the argument in greater detail, focusing on the different dynamics in pre- and post-election periods. We evaluate the empirical implications of our argument in both periods of the election cycle using global data on all potentially competitive elections from 1981 to 2004. We conclude with a discussion of the study’s broader implications and potential limitations.
The Argument
Although most incumbents facing re-election would prefer to win outright and avoid paying the costs of manipulating an election, some governments nevertheless resort to illicit tactics like election violence. Recent research shows that government-sponsored election violence is particularly likely when incumbents think they might lose or are uncertain about their own popularity.Footnote 17 However, existing studies of election violence do not make clear whether violence is an effective strategy for manipulating elections. Is violence a surefire tactic for incumbents wishing to avoid a serious electoral challenge? Or is the use of violence akin to gambling for resurrection, with a very low probability of success? The answer to these questions hinges in part on how opposition groups and voters respond to election violence, in both the pre- and post-election periods.
How Pre-Election Violence Can Help Incumbents Win Elections
We argue that election violence makes incumbent victory more likely through at least two mechanisms: by making opposition party boycotts more likely and (relatedly) by manipulating who turns out to vote in a manner that benefits the incumbent. Opposition-organized election boycotts can occur for many reasons.Footnote 18 Some parties boycott to save face when they realize they are unlikely to win. More commonly, boycotts are a costly signal aimed at discrediting the electoral process, drawing international attention to the manipulation of an election, or signaling opposition to a violent or illegitimate regime.Footnote 19
Government use of election violence in the pre-election period also signals that the election is unlikely to be free and fair. Under some conditions, a boycott can allow opposition parties to minimize additional physical harm to their supporters while drawing public attention to the manipulation of the election process. As Emily Beaulieu explains:
Opposition leaders hope to force the incumbent into holding fairer elections in the future by [boycotting]. Furthermore, if the kind of manipulation the incumbent is using contains elements of violent repression–or if the opposition suspects that Election Day manipulation will include violence on the part of the incumbent–a boycott may be an attractive option for reducing harm to opposition supporters.Footnote 20
Several accounts suggest that government persecution of opposition candidates is a significant driver of election boycotts, although this relationship has not been formally tested. As Staffan Lindberg argues, ‘opposition parties tend to stay out of presidential elections where politically motivated violence is systematic and/or widespread’.Footnote 21 Beaulieu shows that opposition-initiated pre-election boycotts have been more likely when civil liberties have been curtailed, election fraud was anticipated and the opposition was harassed.Footnote 22 We expect that violence increases the likelihood that opposition groups boycott elections, and that boycotts, in turn, increase the likelihood that the incumbent government ‘wins’ the election.
Opposition boycotts may undermine the government’s legitimacy in the long term and even result in higher-quality elections in the next cycle.Footnote 23 This is why boycotts can be a rational strategy for opposition parties. However, in the short term, boycotts increase the probability that the incumbent will win the election. By asking their supporters to stay home, boycotting parties reduce their potential for representation, and in so doing reduce electoral competition.Footnote 24 Boycotts are more likely in the presence of election violence or fraud, though in theory, governments could react to an election boycott (or any other form of opposition-organized collective action) with additional fraud and violence.Footnote 25 Although in practice, boycotts should diminish the need to use illegitimate means to win an election, our argument does not rule out the possibility that violence and the decision to boycott are iterated throughout the election cycle.Footnote 26
A second way in which pre-election violence can increase the probability of incumbent victory is through voter intimidation aimed at influencing who turns out to vote on election day and who they ultimately vote for. While ballot box stuffing and similar forms of election fraud distort official turnout figures, violence can also change voting behavior in a variety of ways that advantage the incumbent. Violence can convince opposition voters to stay home on election day, reducing turnout in favor of the opposition.Footnote 27 It can also coerce would-be opposition voters into voting for the incumbent out of fear of reprisal for supporting the opposition. And it can threaten voters who would otherwise prefer to abstain, and convince them to turn out to vote for the incumbent. These methods of intimidation are not mutually exclusive and may require violations of ballot secrecy, or at least knowledge of who is likely to vote for an opposition candidate.Footnote 28 For example, Lisa Blaydes notes in reference to Egyptian elections, ‘in addition to positive inducements for voting, there are also reports of the use of hired thugs to force voters to choose particular candidates […] [and] they are also used to prevent supporters of other candidates from voting at all’.Footnote 29 An international human rights group reported similar efforts in advance of the 2010 elections in Ethiopia:
In the weeks leading up to the polls […] new methods [were] used by the ruling Ethiopian People’s Revolutionary Democratic Front (EPRDF) to intimidate voters in the capital […] apparently because of government concerns of a low election turnout […] officials and militia […] went house to house telling citizens to register to vote and to vote for the ruling party or face reprisals […] [As one voter said], ‘Intimidation to register and to vote for the ruling party is everywhere […]’.Footnote 30
We expect that pre-election violence has historically biased elections by increasing voter turnout in support of the incumbent through intimidation and/or decreasing turnout in favor of the opposition through voter suppression. Both outcomes, which are not mutually exclusive, increase the likelihood that the incumbent wins the election.Footnote 31
How Pre-Election Violence Increases the Risk of Post-Election Protests
Even if a strategy of election violence helps a threatened government ‘win’ an election, we argue that such a strategy may be myopic and can trigger significant consequences in the post-election period that can undermine some or all of the benefits of winning. Specifically, the use of violence in the pre-election period makes post-election protest more likely, which in turn can bring about significant political costs to the incumbent government.
Citizens sometimes respond to the state’s attempts at election manipulation through fraud and violence by expressing their dissent through non-institutional means, frequently by protesting in the streets.Footnote 32 Although there are some cases in which citizens amass in the streets to challenge a regime prior to an election, anti-government post-election protests are much more common.Footnote 33 Prominent examples of protest include the ‘color revolutions’, and the 2009 Iranian elections.Footnote 34 We anticipate that the opposition’s motivation to engage in election-related mass protest is much stronger in the post-election period in part because several options that are available in the pre-election period are no longer on the table.Footnote 35 Prior to the election, citizens or parties unhappy with the government can work to mobilize voters to support opposition candidates on election day. Or, opposition parties dissatisfied with the election process can engage in an election boycott. Once the election has taken place, however, public protest is one of the few remaining forms of dissent; post-election protest becomes the most likely avenue for anti-government mobilization. Many protesters acknowledge this difference between the pre- and post-election periods explicitly. For instance, several participants in the opposition protests and violence following the 2007 Kenyan elections noted to Human Rights Watch interviewers that they ‘were merely doing by force what they had been denied a chance to do through the ballot box’.Footnote 36
Of course, protest does not automatically follow elections that are corrupted or violent. For protests to emerge as a challenge to the incumbent government’s hold on power in the post-election period, citizens must solve a collective action problem. This is particularly difficult in repressive regimes.Footnote 37 Tucker describes the problem:
Most members of society would likely agree that society as a whole would be better off with a less abusive and appropriately restrained state […]. Achieving this goal in states where such abusive actions regularly take place, however, requires confronting these abuses and attempting to stop them.Footnote 38
Because protesters–and especially those citizens who initiate protest–face significant risk of bodily harm, many cases in which citizens are unhappy with their government do not result in protest because it is individually rational to stay home.Footnote 39 Tucker goes on to argue that elections with major election fraud can help solve collective action problems by ‘lowering the costs of participating in anti-regime actions’ after elections, making protests more likely to be successful in bringing down the incumbent government.Footnote 40 As the number of protestors grows, each individual protester is less likely to be punished, while the probability of successful protest (that is, bringing down the government or forcing political concessions) increases.Footnote 41 This logic is consistent with other work that implicitly or explicitly employs the same model in which elections marred by fraud or violence provide a focal point allowing citizens to solve a collective action problem and protest against the regime.Footnote 42 These arguments are consistent with our prediction that pre-election violence is one factor that will increase the likelihood of post-election protests.
Post-election protests occur in about 15 per cent of the elections in our study and, if we are correct, should increase the probability that the newly re-elected incumbent will eventually make substantial power concessions, including the annulment of election results, the holding of new elections, resignation or removal by force. For example, in South Korea in 1960, President Syngman Rhee ran unopposed following the unexpected death of his challenger. Widespread fraud was documented during the election process, including the discovery of a document announcing that ‘police will use force if necessary to see that the voters vote right’.Footnote 43 People took to the streets to protest Rhee’s election, steadfast in the face of a violent government response. After six weeks of protest and at least 145 deaths, Rhee stepped down.Footnote 44
Protests can lead to significant costs for the incumbent–including resignation, annulment of the election results, military coup or new elections–for several reasons.Footnote 45 Unlike most elections, protests represent a publicly coordinated challenge to the regime. They can signal a government’s vulnerability or weakness while also demonstrating the potential strength or resolve of political opponents. And protests of sufficient size and strength can also provoke other challengers–inside or outside the government–to take advantage of the incumbent’s unpopularity and any public moment of weakness.
In some cases, protests can also send a signal to external pro-democracy advocates, such as powerful states or international organizations. Because post-election protests, especially of the pro-democracy variety, tend to attract global media attention, they can increase the chances that outside actors will pressure the government to change its behavior, support protestors directly or otherwise damage the international reputation of the incumbent government, as happened in Ukraine in 2004 and Ethiopia in 2005.Footnote 46
Because mass public protests can threaten to bring down governments after elections, it is not surprising that governments sometimes decide to respond to election protests with violence in an effort to suppress dissent. In Albania, for example, the 1991 legislative election sparked protests against the government, as thousands of people gathered to protest the government’s monopolization of state resources and the media to disadvantage the opposition.Footnote 47 Violence broke out in President Aila’s hometown of Shkoder when police shot to death Arben Broxi, an opposition activist, killed two other protesters and injured fifty-eight. Meanwhile, in the capital city, protesters occupied the communist party headquarters and the police threatened to blow up the building with the activists inside.Footnote 48 Protesters amassed outside. Army troops and tanks were sent out to disburse the crowd and threatened to open fire if protesters did not leave. Several people were shot; three were killed.Footnote 49
Though governments use violence against post-election demonstrators in an effort to crush public opposition to the regime, we expect violence at this stage in the election cycle to be less incumbent sustaining than pre-election violence. Before elections, government violence seeks to manipulate an election outcome in the incumbent’s favor by reducing election competition, provoking actions that reduce the immediate election competition. The objective of post-election violence, by contrast, is frequently to undermine an already mobilized mass movement protesting the regime. Breaking the opposition’s resolve at this stage is likely to be a more difficult task. Post-election violence against demonstrators is inherently very public, and may be as likely to increase the resolve of anti-regime protesters as to deter them. Once protests are in motion, the opposition has, by definition, already overcome the initial collective action problem that is most likely to limit their success. Moreover, since protests are often a response to pre-election violence, fraud and other forms of election manipulation, protesters may have already factored the threat of violence into their decision to protest.
Anecdotal reports suggest that many protesters acknowledge this risk. For example, Mehdi Karrubi, an opposition leader and participant in the 2009 Iranian post-election protests, explained his decision to continue protesting despite the risk of arrest and likely abuse in prison:
They’ve attacked my house twice and broke all the windows. They’ve shut down my office, my newspaper, and my party. They beat up one of my children. Two of my children are banned from leaving the country. They’ve arrested many people who were close to me. Any member of the Parliament who comes to visit me is chased and attacked. I’m not sure whether they’re going to arrest me or not, but […] we are all ready to pay any price for our struggle for the people of Iran.Footnote 50
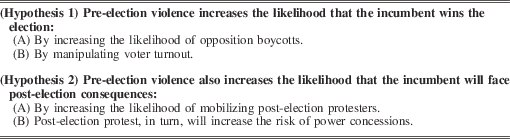
If individuals within a country are able to overcome the collective action problems associated with organizing against a repressive government, and are resolved enough to protest despite significant risk of personal harm, dispersing them is not trivial. Given these factors, we expect that once post-election protests occur, violence against demonstrators is not likely to increase (and may decrease) the likelihood that the incumbent stays in power. Table 1 summarizes the argument and its observable implications.
The Argument

Empirical Analysis
Data
To evaluate the argument we use the National Elections Across Democracy and Autocracy (NELDA) dataset on the characteristics of national elections all over the world.Footnote 51 The NELDA data cover all election events, including more specific measures of election violence, incumbent victory and the dynamics of election protest than have previously been available for all regions.Footnote 52 These data contain information on competitive elections for national office for all sovereign states with a population greater than 500,000, including information on election protest and the existence of several types of election violence.Footnote 53 Temporal limitations of other data used in our model limit the sample to 1981–2004.
NELDA data sources include news wire reports, newspaper archives, academic research including the data handbooks on elections edited by Dieter Nohlen,Footnote 54 archives for specific countries and from intergovernmental organizations such as the Inter-Parliamentary Union, and other sources that are listed in the dataset’s codebook.Footnote 55 Each round of a multi-round election is coded separately. Because post-election protest could follow any round in an election, we treat each round as a separate observation.Footnote 56 For all estimates (below), we exclude the long-term developed democracies (eleven), which are outside the scope of our theory, and elections in which competition is not permitted.Footnote 57
These data are more fine-grained than studies that rely on nationwide aggregate measures of repression or protest that are unable to disaggregate types or targets of repression, or distinguish whether protests or violence are related to an election (as opposed to simply taking place during the calendar year of an election).Footnote 58 In contrast, we measure election-related violence that is targeted at opposition groups and civilians in the pre-election period, and distinguish it from the use of violence by the government against post-election protesters. We also distinguish empirically between election fraud and violence.
The Effect of Pre-Election Violence on Election Victory
This section shows that pre-election violence against opposition supporters, candidates and the citizenry is strongly associated with an increased probability that the incumbent wins the election. For each election round, we use the NELDA data to code a binary measure of whether the Incumbent Wins,Footnote 59 limiting the sample to elections in which the incumbent runs. This rule includes elections in which the incumbent prime minister or president runs for re-election. In order to measure whether an incumbent used violence prior to an election we use Pre-Election Violence,Footnote 60 from Hafner-Burton, Hyde and Jablonski,Footnote 61 which equals 1 if an incumbent harassed or used violence against opposition members or civilians prior to or during the election, and 0 otherwise.Footnote 62 Although opposition harassment (which often includes acts of violence) and civilian violence may sometimes be used separately, our hypotheses make predictions about both violence against voters and opposition groups, so we combine the two in our analysis. In practice, incumbents often target both opposition groups and voters with violence in an effort to suppress competition.Footnote 63 The combination of these two categories of violence is consistent with other published work.Footnote 64 In the Appendix, we also show separate estimates for opposition harassment and civilian violence.Footnote 65
In order to account for the possibility that governments may use violence in response to expected political competition, we include Victory Uncertain if the incumbent made statements prior to the election that suggested she was not confident of victory, or if pre-election polls were unfavorable for the incumbent.Footnote 66
Even after accounting for election competition, it is plausible that more democratic leaders will face a more mobilized opposition and stronger constraints on the use of repression.Footnote 67 To address this source of bias, we include a control for a country’s political institutions.Footnote 68 An additional concern is that election violence is more likely in repressive regimes, and our models estimate the effect of overall repression, rather than election-specific violence. To address this issue, we control for a government’s pre-existing propensity to engage in political repression.
To measure political institutions, we include the Polity2 variable from the Polity IV project.Footnote 69 Polity2 is a twenty-one-point index that ranges from the most autocratic (−10) to the most democratic (10) political institutions. Pre-existing levels of government repression are measured with Physical Integrity, from the CIRI dataset,Footnote 70 which is an additive index of government-sponsored repressive activity, including murder, torture, political imprisonment and forced disappearance. It ranges from 0 (no government respect for these four rights) to 8 (full government respect for these four rights). For both of these variables, we use the average value from the three years prior to the election in order to ensure that these measures are not themselves determined by election violence.Footnote 71 Summary statistics for all variables are shown in the Appendix.
We first estimate a logit model in which the dependent variable is a binary measure of whether or not the incumbent wins the election (Incumbent Wins):
 $$ P(Incumbent\,Wins_{{ij}} )=f(\alpha {\plus}\beta \,Election\,Violence_{{ij}} {\plus}\varphi X_{{ij}} ),$$
where Incumbent Wins indicates whether the incumbent wins in country i in election j, and φX ij is a vector of control variables. In the Appendix we also re-estimate all models with country fixed and random effects.
Except where noted, standard errors are clustered by country to account for within-country correlation of errors. Additional control variables include GDP (log) and Population (log) from the World Development Indicators as additional controls, because a country’s population and wealth may influence an incumbent’s election strategies.Footnote 72 Leader-specific factors like time in office and experience may also influence an incumbent’s strategy. All models include Leader Tenure, which is the incumbent leader’s number of days in office, and Leader Age, from the Archigos dataset.Footnote 73 Civil War is included from the Major Episodes of Political Violence datasetFootnote 74 because internal conflict is correlated with human rights violations.Footnote 75
Where appropriate, models include measures of pre-election expectations of Fraud and an aggregate annual measure of Demonstrations. We include controls for these variables to ensure that we are capturing election violence, and not inadvertently using election violence as a proxy for other related events. Fraud measures whether there were concerns, before the election, that it would not be free and fair, and allows us to evaluate the relative effects of fraud compared to, and in conjunction with, violence.Footnote 76 As a proxy for the overall likelihood of any kind of Demonstrations in a given country, we include the total number of any type of anti-government demonstrations, anti-government strikes and riots during the year based on Banks CNTS coding.Footnote 77 Unless otherwise noted, these country- and election-specific control variables are used in models across several dependent variables, in part for simplicity, and in part because they are intended to capture background characteristics that may influence the dynamics of election behavior.
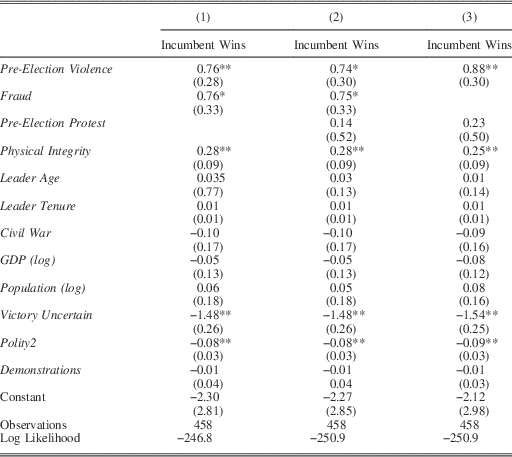
One potential alternative to our argument (that violence provokes boycotts that reduce competition) is that governments are more likely to use election violence against a weak opposition. If this is the case, then a positive relationship between pre-election violence and incumbent victory could be spurious. In our model Demonstrations is a proxy for the propensity of citizens to protest. However, to measure pre-election mobilization more precisely, Table 2, Model 2 includes Pre-Election Protest, which takes a value of 1 if there were any election-related anti-government protests in the period before an election took place.Footnote 78 This allows us to account for the extent to which the opposition is mobilized against the government prior to the election.Footnote 79
The Effect of Pre-Election Violence on Incumbent Victory

Note: robust clustered standard errors in parentheses. **p<0.01, *p<0.05.
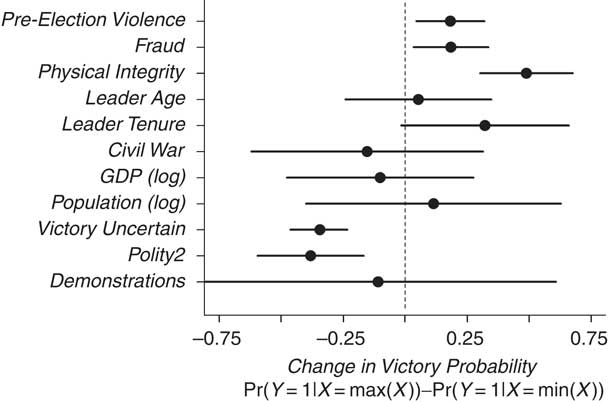
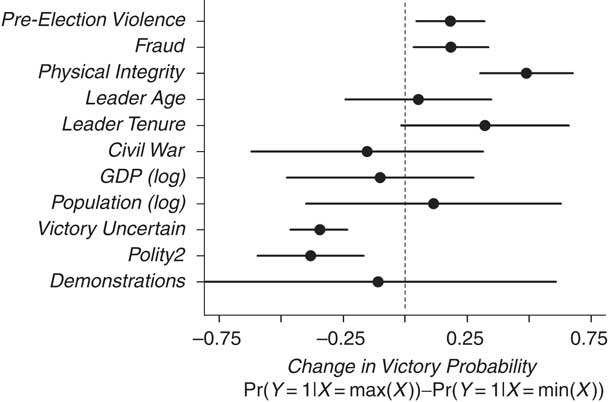
The results presented in Model 1, Table 2 indicate that pre-election violence, on average, increases an incumbent’s likelihood of winning the election. When she uses election violence, the incumbent has a 50.9 per cent greater predicted probability of winning the election (from 0.37 to 0.55). This is similar to the predicted effect of fraud, which results in a 51.3 per cent increase in the probability of victory. Our results remain nearly identical in Model 2, suggesting that the effect of fraud and violence on the election outcome is not explained by levels of opposition strength. Because fraud and violence are at times used together (correlation=0.36), we exclude fraud in Model 3 and find consistent effects of violence. Figure 2 shows the simulated increase in the probability of Incumbent Wins given a change in each independent variable from its minimum to its maximum level, holding all other variables at the mean (based on Model 1). It illustrates graphically that pre-election violence is associated with election victory for the incumbent at about the same rate as fraud.
Estimated effects of explanatory variables on incumbent victory Note: points indicate the simulated increase in the probability of Incumbent Wins given a change in each independent variable from its minimum to its maximum level, holding all other variables at their mean. Lines indicate the 95 per cent confidence intervals for predictions. Estimated using a logit model with robust clustered standard errors.
Next, we evaluate whether the data are consistent with our argument that the success of Pre-Election Violence results in part because violence increases the probability of boycotts. We create Boycott, which equals 1 if some opposition leaders boycotted the election and 0 otherwise,Footnote 80 and estimate a logit model:
 $$P(Boycott_{{ij}} )=f(\alpha {\plus}\beta \,Election\,Violence_{{ij}} {\plus}\varphi X_{{ij}} ),$$
where Boycott indicates if there was a boycott in country i and election j, and φX ij is a vector of control variables. Since boycotts usually occur before instances of fraud, we exclude fraud as a control from this model to avoid post-treatment bias. To confirm that boycotts favor the incumbent at the polls, we also estimate a logit model of Incumbent Wins, with the addition of Boycott as an explanatory variable to the model shown in Equation 1.
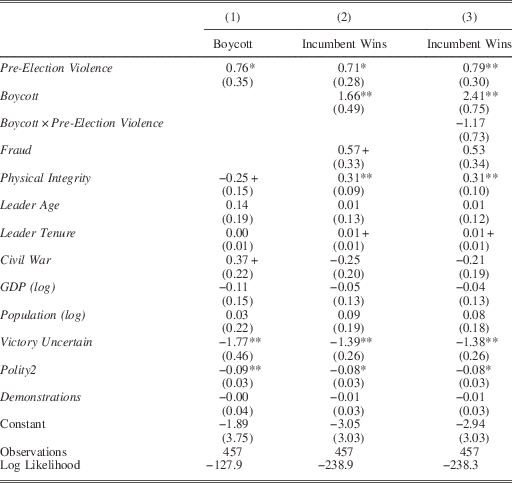
Table 3 presents estimates consistent with the hypothesis that boycotts are part of the reason election violence works in the short term. In Column 1, we estimate that Pre-Election Violence increases the probability of Boycotts by about 80 per cent (from 0.05 to 0.09). In Column 2, we confirm that boycotts in turn increase the likelihood of incumbent victory by about 45 per cent (from 0.38 to 0.55). By comparing these predictions with those from Table 2, we conclude that the effect of Pre-Election Violence on Boycotts explains about 18 per cent of the effect of Pre-Election Violence on Incumbent Wins.Footnote 81
The Effect of Pre-Election Violence on Boycott and Victory

Note: robust clustered standard errors in parentheses. **p<0.01, *p<0.05, +p<0.1.
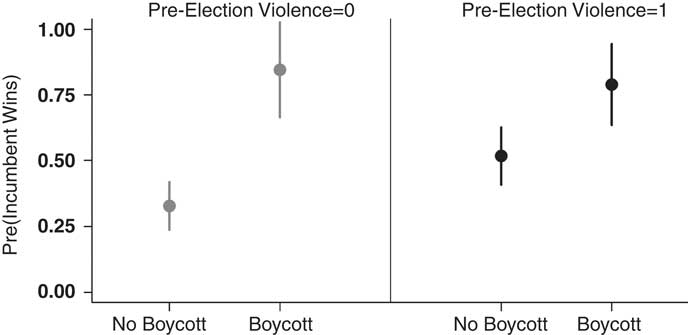
One might be concerned that these estimates are driven by the effect of boycotts in non-violent elections. Boycott strategies might be different in violent versus non-violent elections. In non-violent elections, candidates may boycott in order to avoid an obvious election defeat, particularly when there are expectations of widespread fraud.Footnote 82 However in violent elections, opposition candidates often boycott despite facing an electorally threatened incumbent.Footnote 83 To assess whether boycotts are effective in both violent and non-violent elections, in Column 3 of Table 3 we include an interaction between Boycott and Pre-Election Violence. The results confirm that boycotts increase Incumbent Victory in both violent and non-violent elections. We plot these predictions in Figure 3.
Probability of incumbent victory in violent and boycotted elections Note: predicted probability of incumbent victory for all values of Boycott and Pre-Election Violence with 95 per cent confidence intervals. Predicted from Column 3 in Table 3. All control variables set at mean.

We next evaluate the relationship between pre-election violence and turnout to determine whether violence is changing voter behavior to the advantage of the incumbent. We argue that government-sponsored violence in the pre-election period should alter voter turnout in a manner that benefits the incumbent, decreasing votes by the opposition and/or increasing votes by regime supporters. It is easy to find anecdotal reports of electoral violence and intimidation influencing turnout, though the effect of violence on turnout can be positive or negative. For example, as one opposition member in Ethiopia was quoted during the 2010 elections amid predictions of high turnout, ‘A lot of soldiers are around. It’s a sign of intimidation of the local population to vote for the government.’Footnote 84 In contrast, during the 2015 Sri Lankan presidential elections, the Centre for Monitoring Electoral Violence predicted low turnout in some regions due to ‘the government instilling fear among the electorate by deploying the army in the guise of providing security’.Footnote 85
Evaluating whether the effect of violence on turnout benefits the incumbent is challenging for several reasons, including the fact that cross-national data cannot document turnout by individual vote choice, which is really what our ideal test would include. Moreover, there are weaknesses in existing data since violent regimes may also be more likely to falsify official turnout results.Footnote 86
Recognizing these limitations, we use two approaches to evaluate this hypothesis. First, we evaluate the effect of Pre-Election Violence on turnout using cross-national data to see if we can observe aggregate effects of violence on turnout. In order to evaluate the effects of Pre-Election Violence on turnout levels, we create Voter Turnout, which equals the percentage of registered voters that casts a ballot.Footnote 87 We estimate a linear model of Turnout and a logit model of Incumbent Wins which are identical to Equation 1 but add Turnout:
 $$Turnout_{{ij}} =f(\alpha {\plus}\beta \,Election\,Violence_{{ij}} {\plus}\varphi X_{{ij}} ),$$
where Turnout ij indicates the rate of voter turnout in country i and election j, and φX ij is a vector of control variables. In addition, we control for institutional variables that are likely to affect voter turnout. We include Compulsory Voting, which equals 1 if there was a law requiring citizens to vote and 0 otherwise.Footnote 88 We also control for Multiple Rounds, which equals 1 if there were multiple rounds of voting.Footnote 89 To account for additional institutional confounds, we also include fixed effects estimates in the Appendix, which are consistent.
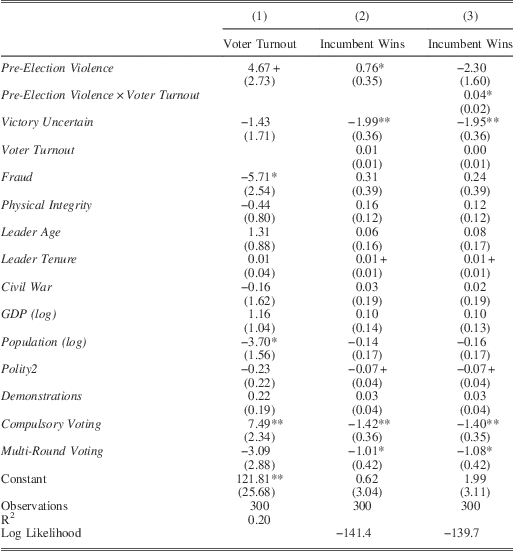
Column 1 of Table 4 shows the relationship between Pre-Election Violence and Turnout. The estimates provide some limited support for our argument about violence being used to coerce support. Column 1 shows that when incumbents use violence, there is a positive effect on voter turnout, though this effect is only significant at the 10 per cent level. These results provide suggestive evidence that violence can increase turnout in favor of the incumbent. We recognize, however, that interpreting this result is challenging given the fact that the effect of violence may also be to lower turnout among opposition supporters.Footnote 90
The Effect of Pre-Election Violence on Turnout

Note: robust clustered standard errors in parentheses. Excludes cases where the incumbent lost the election and exited office. **p<0.01, *p<0.05, +p<0.1.
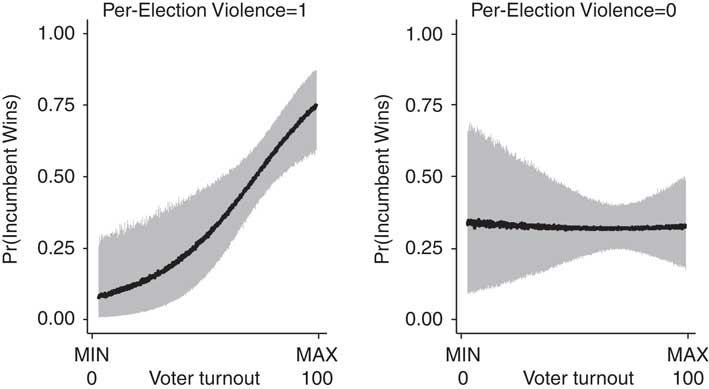
Column 2 indicates that higher turnout is associated with a higher probability that the incumbent government wins the election. Column 3 includes the interaction between Voter Turnout and Pre-Election Violence. The probability that the Incumbent Wins when Voter Turnout and Pre-Election Violence are set at their maximums is over 0.75 compared to the probability (0.32) that the incumbent wins without the use of pre-election violence (but maximum turnout).Footnote 91 This result is consistent with the argument that pre-election violence results in changes in voter turnout that benefit the incumbent.Footnote 92 Figure 4 shows the effect of turnout on the probability that Incumbent Wins by whether or not there was Pre-Election Violence, with all other variables held constant at mean values.
The effect of Turnout on Incumbent Wins Note: estimated effect of Pre-Election Violence on the probability of Incumbent Wins at various levels of turnout. Vertical lines indicate the 95 per cent confidence interval.

These results imply that when pre-election violence occurs, higher turnout is associated with an increased probability of incumbent victory. Combined with the survey-level data in the Appendix, this suggests that incumbents are often successful at using violence and intimidation to ‘persuade’ voters to turn out and vote in their favor. The results also suggest that this strategy works for incumbents: when the government does not use pre-election violence, increasing turnout has no effect on incumbent victory. However, when the government employs pre-election violence, higher turnout is associated with a higher probability of incumbent victory. This is consistent with our hypothesis that violence shifts turnout among opposition and incumbent supporters in ways that increase vote totals for the incumbent.
As a complementary approach, we include a separate set of regressions using individual survey data. Using Afrobarometer and Latin America Barometer survey results, we estimate whether reported turnout differs between respondents who claim to support opposition parties and those who claim to support incumbent parties. The results show that respondents in violent elections who support opposition parties are less likely to report having voted than citizens who support incumbent parties. We discuss these results in more detail alongside the estimates in the Appendix.
The Effect of Post-Election Protests on Power Concessions
This section explores whether pre-election violence drives mass protests, and whether such protests increase the likelihood that the incumbent will make power concessions. Election Protests equals 1 if there were election-related riots and protests after the election, and 0 otherwise.Footnote 93 We estimate the effect of Pre-Election Violence on Election Protests in country i and election j using a logit model with clustered standard errors and the same set of control variables described above:
 $$P(Election\,Protests_{{ij}} )=f(\alpha {\plus}\beta \,Election\,Violence_{{ij}} {\plus}\varphi X_{{ij}} ),$$
where φX ij is a vector of control variables. Since our primary interest is in how violence affects incumbent behavior, we exclude cases where the incumbent lost the election and exited office.Footnote 94
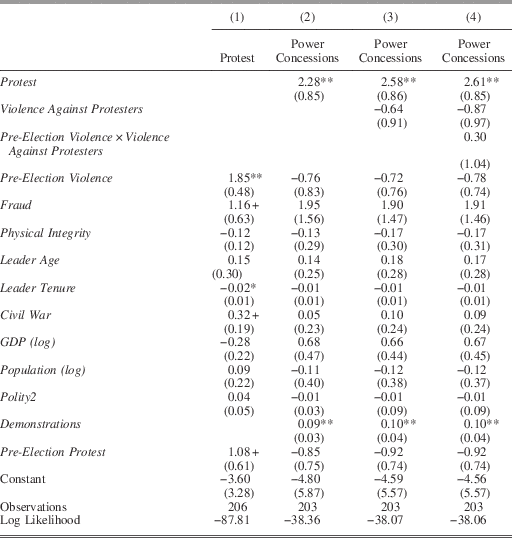
The estimates in Column 1 of Table 5 confirm that pre-election violence–like fraud–significantly predicts the outbreak of post-election protests. Violence increases the estimated probability of protests by 0.21.Footnote 95 For comparison, the use of fraud increases the probability of protests by 0.10.
The Effect of Protests on Power Concessions

Note: robust clustered standard errors in parentheses. Excludes cases where the incumbent lost the election and exited office. **p<0.01, *p<0.05, +p<0.1.
In Columns 2 through 5 we evaluate the relationship between protest and the probability that the newly re-elected incumbent makes concessions after the election. Power Concessions equals 1 if the incumbent is removed from power by means other than the loss of the election–including through resignation, coup or other non-electoral means–or if the initial election results were annulled and new elections held.Footnote 96
 $$P(Power\,Concessions_{{ij}} )=f(\alpha {\plus}\beta \,Election\,Protest_{{ij}} {\plus}\varphi X_{{ij}} ),$$
where φX ij is a vector of control variables. Again we exclude cases where the incumbent lost the election and exited office. We again account for the possibility that governments are more likely to use violence against a strong opposition by including Pre-Election Protest as a proxy for how mobilized the opposition was against the government prior to the election.
Column 2 of Table 5 reveals an interesting story. Protests increase the probability that an incumbent will make power concessions in the post-election period by more than 500 per cent.Footnote 97 Moreover, Column 3 suggests that using violence against protesters does not change the likelihood of concessions. Violence Against Protesters equals 1 if an incumbent used violence against demonstrators protesting the election, and 0 otherwise. The coefficient is statistically insignificant from 0. Although we cannot rule out the possibility that the more virulent protests are being repressed, this lack of a relationship suggests that post-election violence may not be an especially successful way for the incumbent to crack down on threats to her hold on power once post-election protests have begun. In Column 4, we include an interaction between Pre-Election Violence and Violence Against Protestors to investigate whether violence against post-election protestors counteracts concession demands against governments that have engaged in pre-election violence. The interaction coefficient is not significantly different from 0, suggesting that violence against protestors may not be a successful way to thwart concessions.Footnote 98
Together, these findings lend support to our argument that pre-election violence can help incumbents win elections but may also increase the risk that leaders will eventually face mass protests, which may oust them from power after the election, or annul election results that were favorable to the incumbent and call new elections.
Caveats
Why do ‘Rational’ Leaders Choose a Risky Strategy?
We have shown that pre-election violence–like fraud–increases the chances that leaders win elections as well as the chances they will face post-election protests, which are costly in their own right and can lead to power concessions. Rational leaders who aim to stay in power should seek to avoid these potentially negative consequences of using violence. Why, then, do the repercussions of violence in the post-election period not deter all violence in the pre-election period? If voters and opposition leaders are acting rationally given their available options, are leaders irrational?
While a definitive answer is beyond the scope of this article, we offer some tentative speculations. Our argument is not that leaders are irrational. To the contrary, much like the opposition they face, leaders running for re-election may be operating with short-term discount rates focused on the immediate goal of winning at the expense of longer-term strategy. They may be aware of the eventual possibility of protest and its consequences, but weigh the probability or longer-run costs associated with this strategy as lower than the immediate benefits of election victory. Some may also underestimate the strength or resolve of the general public once mobilized. And it is likely that many repressive incumbents have difficulty perfectly accessing or evaluating information about their own popularity–indeed, it is precisely in these circumstances of uncertainty that incumbents are most likely to engage in election violence, and thus may be prone to miscalculating the public’s reaction.Footnote 99
Endogeneity
The decision to use election violence is itself a strategic decision driven by factors such as election uncertainty, executive constraints and capacity. This raises the question of whether we are identifying an effect of election violence, or whether our results are biased by some unobserved characteristic of violent elections. One important concern is that both the use of violence and incumbent victory might be determined by the election threat faced by the incumbent. Other empirical work has shown that violence is most likely when incumbents are uncertain about the election outcome.Footnote 100 To the extent this is a problem, it should result in an underestimation of the effect of election violence on winning, since this logic suggests that the incumbents most likely to lose elections are also the most likely to use violence. We thus included several control variables that measure pre-election expectations of victory, including opposition mobilization, level of democracy and expectations of victory (Victory Uncertain). We also include fixed-effect estimates in the Appendix. Since many of these potential confounds vary little between elections (such as the level of executive constraints or democracy), they are unlikely to confound estimates from a fixed-effects model.
Reverse Causation
Relatedly, one might worry about reverse causation. If more electorally successful leaders are more likely to rely on election violence, then this relationship between violence and incumbent victory might be spurious. This seems unlikely. First, as we note above, leaders who are confident of victory rarely use election violence. Secondly, we include several control variables to account for expectations of victory and the incumbent’s tenure in office. Such an explanation does not align with our findings on the post-election consequences of election violence: if more successful leaders are using violence, we would not expect to see violence trigger protest and undermine leader tenure in the post-election period and over the longer term.
Other Manipulation Tactics
It is also possible that the choice to use violence is not independent of the choice to engage in other forms of election manipulation, such as distorting vote counts, manipulating election timing, vote buying or rigging registration processes. If these strategies complement or substitute for one another in ways that are related to incumbents’ election prospects, we run the risk of obtaining biased estimates of the effect of election violence.Footnote 101 A full exploration of these alternative strategies is an important area for future research and well beyond the scope of this article; however, we take several steps to address this inferential challenge.Footnote 102 First, we include controls for expectations of fraud in our models where feasible. This ensures that we are not substantially overestimating the effects of violence due to complementarities between fraud and violence. Controlling for other strategies–such as vote buying or abuse of public spending–is more difficult, yet we take steps to account for factors that others have suggested might make violence cheaper than other strategies, such as the presence of election monitors, the size of the government budget and media transparency. We describe and show these alternative estimates in the Appendix. Our results remain consistent.
Implications
Writing in the early 1990s, Samuel Huntington observed that ‘[w]e all know that military coups, censorship, rigged elections, coercion and harassment of the opposition, jailing of political opponents, and prohibition of political meetings are incompatible with democracy’.Footnote 103 Does this also imply that election violence is incompatible with democratization and greater political liberalization? Scholars have long recognized that most governments around the world hold elections, but the majority of election-holding countries are not full democracies.Footnote 104 Yet debate continues about the role political violence plays in political transitions, and what violent elections might mean for a country’s prospects for democratization. Despite the widespread recognition that many countries experience election violence, and the generally accepted tension between state-sponsored political violence and democracy, there has been little research investigating how the timing of election violence relates to its consequences. Much more attention has been given to fraud.
This article contributes to the debate about whether election violence is a ‘harbinger of democracy’Footnote 105 by examining the consequences of government-sponsored election violence across regime types, while also avoiding the assumption that annual measures of repression are accurate proxies for election violence. Our results point anecdotally to when and why violent elections should lead to democratic transitions and regime turnover. On the one hand, election violence helps unpopular incumbents win competitive elections in part because it mobilizes political parties to protest the regime–and the election process–by boycotting elections, and may also intimidate voters into increasing the incumbent’s vote share. On the other hand, violence can embolden opposition movements in the post-election period, which at times turn to non-election means such as protests that increase the risk that the incumbent will make concessions of power. This makes election violence risky as a long-term strategy for incumbents. The United Democratic Action Organization in the Philippines was able to mobilize support for overthrowing the Marcos regime in part by organizing rallies against the government’s purported assassination of opposition leader Benigo Aquino.Footnote 106 Similar links between election violence and opposition mobilization can be seen in the rise of opposition to Syngman Rhee in South Korea and Zulfikar Ali Bhutto in Pakistan.Footnote 107
One possible implication is that election violence may actually–and inadvertently–promote political liberalization in some cases over the long term. This is not to say that repression cannot quell these movements. The people power movement in 1988 Burma, the so-called 8888 movement, obtained significant concessions from the governing junta, only to be violently repressed following the movement’s victory in the 1990 parliamentary elections.Footnote 108 Even so, incumbents who use election violence are more likely to face protests that eventually force them out of power and are more likely to face some form of democratization event during their tenure.Footnote 109 Exploring all conditions under which election violence leads to political liberalization is beyond the scope of this article; however our results suggest that, while election violence may provide short-term gains for the incumbent, in the long run it can motivate powerful opposition movements to take to the streets and demand reform.