Implications
The objective of this study was to improve our understanding of the respective effects of milk yield and body condition on post-partum ovarian activity, oestrus and fertility in Holstein dairy cows, whereas the originality of the dataset lies in an uncoupling of these two highly correlated factors. Cyclicity and early embryo survival appeared to be mainly driven by body lipid reserves, whereas oestrus and late embryo survival appeared to be mainly driven by milk production. These different relationships should be taken into account by physiologists to improve biological knowledge of dairy cows’ reproduction and by zootechnicians to optimize breeding strategies.
Introduction
Reproductive performance has decreased over the last 5 decades in dairy cows as milk production increased (Rodriguez-Martinez et al., Reference Rodriguez-Martinez, Hultgren, Båge, Bergqvist, Svensson, Bergsten, Lidfors, Gunnarsson, Algers, Emanuelson, Berglund, Andersson, Håård, Lindhé, Stålhammar and Gustafsson2008). All the stages of the reproductive process have been affected, with increased ovarian abnormalities (Royal et al., Reference Royal, Darwash, Flint, Webb, Woolliams and Lamming2000), depressed oestrus duration and intensity (Van Eerdenburg et al., Reference Van Eerdenburg, Loeffler and Van Vliet1996; Kerbrat and Disenhaus, Reference Kerbrat and Disenhaus2004), depressed AI success (Barbat et al., Reference Barbat, Druet, Bonaiti, Guillaume, Colleau and Boichard2005) and an increase in both early and late embryonic death (Diskin et al., Reference Diskin, Murphy and Sreenan2006; Humblot et al., Reference Humblot, Fréret and Ponsart2009).
Adverse effects of high milk yield (MY) were observed in many studies. High MY has been reported to delay first ovulation (Petersson et al., Reference Petersson, Strandberg, Gustafsson and Berglund2006), to increase the risk of prolonged luteal phases (PLP; Opsomer et al., Reference Opsomer, Grohn, Hertl, Coryn, Deluyker and de Kruif2000), to reduce standing oestrus duration (Lopez et al., Reference Lopez, Satter and Wiltbank2004) and to depress fertility (Mackey et al., Reference Mackey, Gordon, McCoy, Verner and Mayne2007) by increasing late embryo mortality (Grimard et al., Reference Grimard, Fréret, Chevallier, Pinto, Ponsart and Humblot2006). Some of these effects may be attributed to genetics, as genetic correlations between MY and several reproductive traits have been established (Boichard et al., Reference Boichard, Barbat and Briend2002; Royal et al., Reference Royal, Flint and Woolliams2002). More generally, body condition score (BCS) and body condition (BC) loss resulting from the negative energy balance after calving are thought to explain these adverse effects of high MY (Cutullic, Reference Cutullic2010; Friggens et al., Reference Friggens, Disenhaus and Petit2010).
However, in most studies, MY and BC loss effects are confounded. Comparison of high-fed animals (high milk, moderate BC loss) with low-fed animals (low milk, large BC loss) can help to distinguish these effects, and Cutullic et al. (Reference Cutullic, Delaby, Gallard and Disenhaus2011), using this design, observed that almost all the stages of the reproductive process appeared to be sensitive to feeding level in Holstein cows. Working on the same Holstein dataset, this study aims to quantify the respective effects of MY and BCS at each stage of the reproductive process.
Material and methods
Experimental design and dataset
From 2006 to 2008, a breed × feeding system experiment was conducted on the INRA experimental farm in Le Pin-au-Haras (Normandy, 48.44°N, 0.09°E). The results per breed and feeding system are reported in another paper (Cutullic et al., Reference Cutullic, Delaby, Gallard and Disenhaus2011). This trial is limited to Holstein dairy cows. Each year, 34 Holstein cows were equally distributed within two winter compact calving systems. At the beginning of the experiment, systems were balanced for parity, calving date, genetic indices for MY, fat and protein content, BCS, BW and previous rank of successful insemination. For each trait, the estimated genetic indices were evaluated using a Best Linear Unbiased Prediction animal model especially developed for this experiment by Larroque and Boichard (personal communication). The model included the sire and grandsire's genetic evaluation, the dam's performance over three lactations, the classical fixed environmental effects and the feeding treatment. Cows remained in their feeding group until culling (not pregnant, health problem or death). Replacement primiparous cows were balanced for genetic indices, BCS, BW and rank of successful insemination.
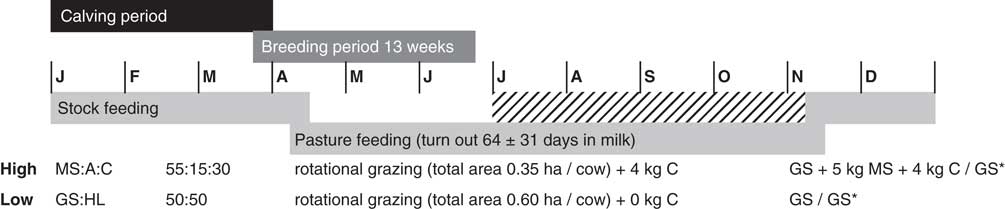
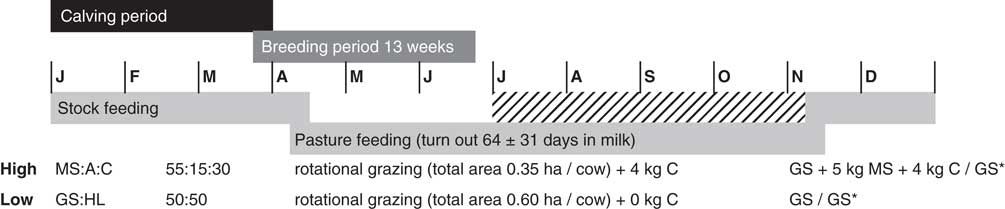
The yearly calendar experimental design is reported in Figure 1. The two feeding systems were grass-based: a high feed system (allowing high MY for a grass-based system and limiting BC loss) and a low feed system (without any concentrate, limiting MY and triggering a large BC loss).
Yearly calendar experimental design of the feeding system experiment conducted in the INRA experimental farm Le Pin-au-Haras, comparing a high feeding level system with a low feeding level system. MS, A, C, GS, HL: maize silage, dehydrated alfalfa pellets, concentrate, grass silage, haylage. Salt and mineral were included in the concentrate of high-fed cows and were additionally fed to low-fed cows. GS*: during the dry period, cows were fed ad libitum with grass silage only. Hatched period: if the grass offered was insufficient, cows received additional MS (high) or GS (low) feeding (up to 8 kg/day), mostly in the high group, which had a 1.7 smaller maximal grazing area.
The cows were milked twice daily at 0630 and 1600 h. Individual MYs were recorded by flow meters (Metatron, Westfalia, Germany). Both morning and evening milk samples were collected and analysed for fat and protein content three times a week using an infrared analyser (MilkoScan™, Foss Electric, Hillerad, Denmark). From calving to 5 weeks after the end of the breeding period, morning milk samples were additionally collected on Monday, Wednesday and Friday, stored at −18°C without preservative and assayed for progesterone (P4) using commercial ELISA kits (years 1 to 2: Ovucheck Milk, Biovet, Canada; year 3: Milk Progesterone ELISA, Ridgeway Science Ltd, England). From P4 profiles, commencement of luteal activity (C-LA), interovulatory intervals (ioi, estimate of cycle length), luteal phase lengths (lut) and interluteal intervals (ili) were determined (for details, see Cutullic et al., Reference Cutullic, Delaby, Gallard and Disenhaus2011). The first ovulation was considered to be delayed if C-LA >50 days. The luteal phase following the n-th ovulation was considered to be a PLP if lutn > 25 days. The n-th ovulation (n ⩾ 2) was considered to be delayed if ilin −1 > 12 days. The cycle following the n-th ovulation was considered to be a short cycle if ioin ⩽ 15 days. Post-partum (pp) P4 profiles were classified as normal, PLP profile (if at least one PLP was observed), delayed (if C-LA >50 days), interruption (if at least one ovulation of rank ⩾2 was delayed) or disordered (if luteal activity appeared irregular but without any of the previously indicated abnormalities).
Caudal vein blood samples were taken at 20 and 60 days in milk and at first insemination to assay non-esterified fatty acids and glucose plasma concentrations, using enzymatic colorimetry (Kone Instruments Corporation, Espoo, Finland).
BCS was evaluated monthly, always by the same two experienced assessors. It was scaled from 0 to 5, from extremely thin to extremely fat, in increments of 0.25 (Bazin et al., Reference Bazin, Augeard, Carteau, Champion, Chilliard, Cuylle, Disenhaus, Durand, Espinasse, Gascoin, Godineau, Jouanne, Ollivier and Remond1984).
During the entire breeding season and the 4 previous weeks, experienced staff observed the cows at least 5 times a day and behaviours were noted down on a standardized card. An oestrus detection aid was used in 2007 and 2008 (Kamar Heat Mount Detector, KAMAR Inc., Steamboat Springs, CO, USA). For analyses, oestri detected by standing to be mounted (specific behaviour) were distinguished from oestri detected by proceptive and general signs (mounting, sniffing, licking, chin-resting, restless, clear mucous discharge, heat mount detector only). This information was linked with P4 profiles: (i) to classify oestri as ‘true’ if corresponding to an ovulation period or ‘false’ and (ii) to determine the ovulation detection rate. For each undetected ovulation, that is, not matching with a detected oestrus, an expected date of oestrus was calculated. For each ovulation, we considered that there was another cow in oestrus at the same time if there was at least one other cow in true oestrus on the same or the previous day.
During the breeding period, artificial insemination (AI) was systematically used on spontaneous oestri after 42 days in milk. By combining progesterone assays and ultrasonography at 40 and 70 days after insemination, AI results were classified into four categories according to Humblot (Reference Humblot2001): non-fertilization or early embryo mortality (low P4 before 25 days after AI); late embryo mortality (high P4 at 25 days, low before 50 days); foetal death or abortion (ultrasonography positive twice or P4 high more than 50 days and ultrasonography positive once); and recalving. In statistical analyses, the embryo survival category included the two categories recalving and foetal death or abortion following insemination.
All the major health problems were recorded throughout lactation with a focus on reproduction problems (calving difficulties, caesarean, retained placenta, metritis, etc.). In the case of a caesarean, retained placenta or abnormal involution, prostaglandin analogue injections (cloprostenol, Intervet-Schering Plough, Beaucouzé, France) were used. Severe metritis (purulent and foul-smelling vaginal discharge) was treated with an intrauterine infusion (Intervet-Schering Plough, Beaucouzé, France) and a cloprostenol injection. Anoestrous cows received no specific treatment.
Statistical analyses
MY and BCS relationship
For 98 lactations, the effects of feeding level on MY and BCS variables were investigated using variance–covariance analysis. The models included the effects of lactation number (categorized as first, second, third or more), feeding level, year, first-order interactions with feeding level and MY index as a covariate for MY variables (Model MY-1). The relationship between BC change from calving to 120 days in milk (ΔBC120) and peak MY was investigated using variance–covariance analysis. A first model included the factors lactation number (first, second, third or more), year, BCS at calving, feeding level and peak MY, and also the interaction between these two variables (Model MY-2). A second model did not include feeding level and its interaction with peak MY (Model MY-3).
Variables influencing reproductive outcome
The effects of independent variables on reproductive outcome were assessed using a forward stepwise regression approach. Unless stated otherwise, only variables that significantly improved the model were included (P < 0.05). At each step, changes in the P-values of type III ANOVA tables were checked to detect confounding effects and we checked in the final models that significant variables remained significant regardless of which statistical unit of the population was removed. The investigated outcome variables relating to cyclicity, oestrus and fertility stages are listed in Table 1. They were analysed in a chronological manner in Model CYC-1-2-3, Model OES-1-2 and Model FER-1-2. Continuous output variables were analysed with linear models and categorical output variables with logistic regressions, either binomial (two output categories) or multinomial (three output categories). Overall, three kinds of independent variables were investigated in these models: general variables and lactation-level variables for all models, and event-level variables only for specific models (Table 2). Loge(C-LA) was also tested for the occurrence of PLP profiles (Model CYC-2), as early resumption of luteal activity is often associated with PLP (Opsomer et al., Reference Opsomer, Grohn, Hertl, Coryn, Deluyker and de Kruif2000). For ovulation detection models (Model OES-1-2), observation period (before or during the breeding period and the 4 previous weeks) was included in the model to account for possible observation biases. For insemination result models (Model FER-1-2), parity and calving–AI interval (< or ⩾50 days after calving) were also included in the model considering their known influence on fertility. Owing to the first results, we additionally tested the effects of the parameters of fitted Wood lactation curves over the first 14 weeks of lactation  on insemination results (Model FER-1). Feeding-level effect was not directly included in these models (CYC, OES, FER), as its effect is strongly correlated with the effects of BCS and MY variables. In addition, for normal, PLP and delayed profiles, MY, BCS and BC change curves were compared using variance analysis; models included parity and profile category (Model CYCBCS).
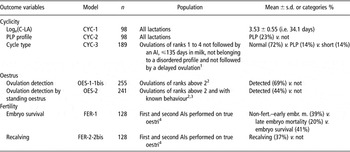
Investigated reproductive outcome variables, their related population and raw characteristics (Models CYC, OES, FER)

C-LA = commencement of luteal activity; PLP = prolonged luteal phase; AI = artificial insemination; non-fert.–early embr. m. = non-fertilization or early embryo mortality.
1Ovarian activity interruption and disordered profiles were too scarce (n = 3 and 1) to be specifically analysed.
2First post-partum ovulations are known to be hardly detectable (17% detected v. 69% for higher ranks in this study, P < 0.001) and were not included in ovulation detection analyses.
314 detected ovulations with unknown behaviour were excluded.
417 inseminations performed on false oestri were excluded.
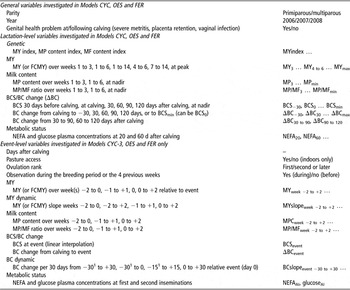
Independent variables included in statistical analyses to study their effectiveness to predict reproductive outcome variables (Models CYC, OES, FER)

MY = milk yield (kg/day); MP = milk protein content (g/kg); MF = milk fat content (g/kg); FCMY = fat corrected milk yield (kg/day, milk fat content = 40 g/kg); BCS = body condition score (0 to 5 scale); BC = body condition; NEFA = non-esterified fatty acids.
1Left censored at calving to avoid a smoothing of the BC loss that occurs just after calving: for −a to +b case, the value for an event at time t is [BCS at t+b – BCS at max(0, t−a)]/[t+b – max(0, t−a)]×30 to have a change expressed as BCS unit per 30 days.
Linking cyclicity, oestrus and fertility
In order to test the potential additional effects of cyclicity on oestrus and of cyclicity or oestrus on fertility, the following variables were investigated by including them in the two final models predicting ovulation detection (Model OES-1) and insemination results (Model FER-2): loge(C-LA), normal v. abnormal P4 profile, normal v. PLP v. other P4 profile, previous cycle length ⩽15 v. >15 days, previous luteal phase ⩽25 v. >25 days, current ili ⩽12 v. >12 days, standing oestrus v. not. The new final models were labelled Model OES-1bis and Model FER-2bis, respectively (Table 1).
Statistical software and outputs
Analyses were performed using the R statistical software (R Development Core Team, 2009; functions lm, glm and multinom for linear models, binomial logistic regressions and multinomial logistic regressions, respectively). When predicting a continuous output variable, linear model results are expressed as least-squared means for categorical independent variables or as slopes for continuous independent variables. When predicting categorical output variables with either two or three categories, the results are expressed as odds ratios for categorical independent variables (i.e. exp(coefficient of the linear predictor)) or as transformed odds ratios for continuous independent variables. The transformed odds ratios reflect the effect of a 1 s.d. increase in the independent variable instead of the effect of a 1 unit increase (i.e. exp(coefficient of the linear predictor)s.d., with s.d. being calculated on the sample population, instead of exp(coefficient of the linear predictor)1). This transformation simplifies effect comparisons, as, for example, a 1 unit increase in peak MY is not comparable with a 1 unit increase in BCS at calving . Odds ratios interpretation remains the same: an odds ratio >1 indicates that an increase in the independent variable increases the risk of the occurrence of a specific category rather than the occurrence of the reference category, whereas an odds ratio <1 indicates that an increase in the independent variable decreases this risk. For example, in a binomial logistic regression predicting the occurrence of either category B or reference category A, an odds ratio >1 indicates an increase in the risk of occurrence of category B rather than category A. In a multinomial logistic regression predicting the occurrence of category C, category B or reference category A, an odds ratio (C v. A) >1 indicates an increase in the risk of occurrence of category C rather than category A and an odds ratio (B v. A) >1 indicates an increase in the risk of occurrence of category B rather than category A. In these multinomial models, the reference category is thus important. To improve the understanding of the results of multinomial logistic regressions, the probabilities of each category were additionally calculated and plotted along the independent variable, so that prob(A) + prob(B) + prob(C) = 1 at each given value of the independent variable.
Results and discussion
The link between MY and BC dynamic was disrupted in the entire dataset
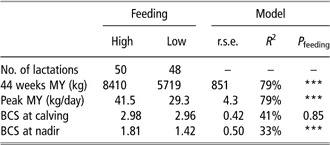
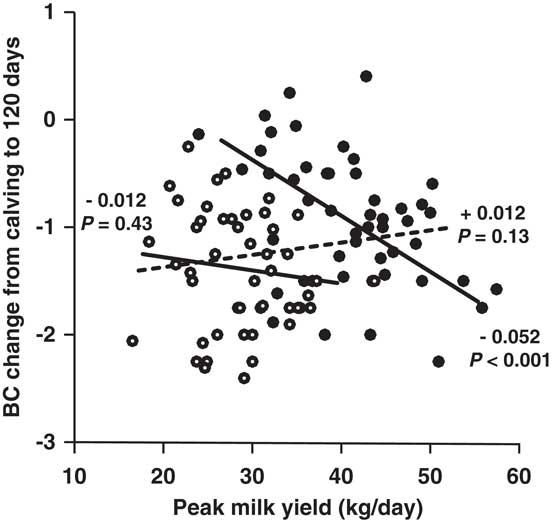
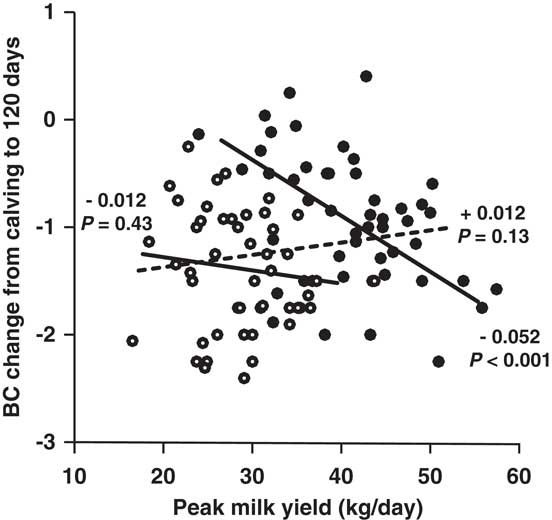
Cows in the low feed lost more BC, faster and for a longer period than those in high feed although they produced much less milk (Table 3; MY and BCS curves are reported by Cutullic et al., Reference Cutullic, Delaby, Gallard and Disenhaus2011). The negative relationship between MY and BC change was observed within high feed (Figure 2). In low feed, BC loss was important irrespective of the MY. When the feeding level and the interaction between feeding level and MY are not included in the model, MY has no significant effect on BC loss: in the entire population, the link between MY and BC change was disrupted. In studies investigating the relationships between reproduction and MY or BC loss, these two factors are often confounded. Our design partially disrupted the relationship between these two factors and, therefore, provided an opportunity to disentangle the respective effects of MY and BC at each reproductive step in Holstein dairy cows. Owing to the well-documented relationships between reproduction and both MY and BCS (Roche et al., Reference Roche, Friggens, Kay, Fisher, Stafford and Berry2009; Friggens et al., Reference Friggens, Disenhaus and Petit2010), we have assumed in our study that reproductive performance is mainly explained by the expressed MY and BCS level or change, although we cannot exclude any direct feeding treatment or genetic effect.
Adjusted MY and BCS (0 to 5 scale) for Holstein cows subject to a either high or low feeding level during lactation (Model MY-1)

MY = milk yield; BCS = body condition score; r.s.e. = residual standard error.
***, **, *, †P < 0.001, 0.01, 0.05, 0.10.
Body condition (BC) change from calving to 120 days post partum (body condition score (BCS) on 0 to 5 scale) according to the peak milk yield (MY) for Holstein cows of the high (●, n = 50) and low (○, n = 48) feeding level groups. The solid lines represent the predicted regressions within feeding level when accounting for lactation number, year, BCS at calving, feeding level and peak MY, and the interaction between these two variables (R 2 = 51%, r.s.e. = 0.46). The dashed line represents the predicted regression when not accounting for feeding level and its interaction with peak MY (R 2 = 29%, r.s.e. = 0.55). Regression slopes and corresponding P-values are given on the plot.
Pp cyclicity was linked to BCS and BC change variables
C-LA was mainly related to BCS in early lactation
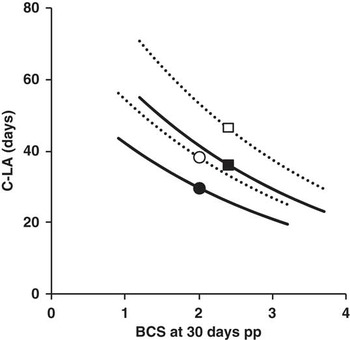
C-LA has been extensively studied in dairy cows, as a far too late first ovulation delays breeding time. The relationship between C-LA and parity, genital health problem and BCS pp is consistently observed in the literature (Opsomer et al., Reference Opsomer, Grohn, Hertl, Coryn, Deluyker and de Kruif2000; Roche et al., Reference Roche, Friggens, Kay, Fisher, Stafford and Berry2009), whereas Figure 3 illustrates that a higher BCS30 is associated with a shorter interval to C-LA (Model CYC-1, slope −0.35, i.e. −0.22 loge days per 0.63 unit BCS increase (1 s.d.), P < 0.001). Our analysis revealed that the protein content at nadir could also be included in the model as a higher protein content at nadir was associated with a shorter C-LA (slope −0.054, i.e. −0.10 loge days per 1.9 g/kg increase (1 s.d., mean 26.5 g/kg), P = 0.043), whereas MY variables did not affect the model at all (P > 0.5). All pp BCS variables had a greater effect than BC change variables. Among those variables, ΔBC30 was the most predictive one when BCS30 was not included in the model. A shorter C-LA was associated with reduced BC loss (slope −0.44, i.e. −0.18 loge days per 0.40 unit BC change increase (1 s.d., mean −0.81 unit), P < 0.001, R 2 = 21%). In this model, the parity effect was no longer significant (P = 0.17), as primiparous cows had both a longer C-LA and greater BC loss than multiparous cows. Among the metabolic variables, only the plasma glucose concentration at 20 days in milk had a significant effect when BCS30 was not included in the model (slope −0.019, i.e. −0.12 loge days per 6.2 mg/dl glucose concentration increase (1 s.d., mean 58.2 mg/dl), P = 0.044, R 2 = 17%). Therefore, although pp BCS variables were more predictive than BC change variables, the influence of a negative energy balance (Butler et al., Reference Butler, Everett and Coppock1981) was observed once more, as a large BC change within 30 days pp, low milk protein content at nadir and low plasma glucose concentration at 20 days pp also delay the resumption of luteal activity. The combined effects of both the level and the change of body lipid reserves may be expected, as reported in beef cows by Wright et al. (Reference Wright, Rind, Whyte and Smith1992). A large BC loss may not prevent the cow from ovulating if the current BCS is still high, namely if the ante-partum BCS was high enough, and is consistent with the concept of an ‘endocrine memory’ (Chagas et al., Reference Chagas, Bass, Blache, Burke, Kay, Lindsay, Lucy, Martin, Meier, Rhodes, Roche, Thatcher and Webb2007). However, in our dataset, including an interaction between BC change from calving to 30 days pp and categorized BCS at calving (> v.<mean within parity) did not improve the prediction of C-LA (results are not reported). Moreover, BCS at 30 days pp does not explain the delayed resumption of luteal activity for primiparous cows whereas BC change does. In comparison with multiparous cows, BCS may not represent the same amount of body lipid reserves for primiparous cows where prolonged uterine involution and the requirements to grow could also affect luteal activity independent of BCS status. In conclusion, the respective influences of the level and dynamic of body lipid reserves on C-LA remain to be quantified.
Predicted commencement of luteal activity (C-LA) according to the body condition score (BCS) at 30 days post partum for Holstein primiparous (▪□) and multiparous (●○) cows with (- - -) or without (—) genital health problem at or following calving (n = 98). The corresponding equations are loge(C-LA) = 4.39 ± 0.17 if primiparous/multiparous ± 0.13 if genital health problem/no problem – 0.352×BCS30 (P = 0.002, P = 0.027, P < 0.001, r.s.e. = 0.49, R 2 = 25%; variable definitions are in Table 2).

PLP profiles were mainly related to C-LA and BC change
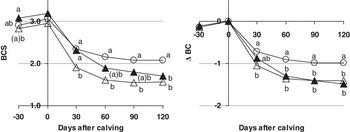
PLP, which delay breeding by preventing the occurrence of ovulation and also by complicating the understanding of cows’ cycles for the farmer, has become a major abnormality in Holstein cows (Royal et al., Reference Royal, Darwash, Flint, Webb, Woolliams and Lamming2000). Once accounted for loge(C-LA) in logistic regression Model CYC-2, the best predictive variables for these abnormal profiles were ΔBC60, ΔBC90 and ΔBC120 (P = 0.002, 0.007 and 0.002, respectively). The sooner luteal activity commenced and the deeper the ΔBC60, the greater the probability of having at least one PLP pp (Table 4). Whatever the model, neither MY variables, nor parity or genital health problem at/following calving had a significant effect (P > 0.2). In other words, cows resuming luteal activity early and mobilizing reserves for a long time had PLP (lasting more than 25 days). According to the previously discussed predictors of C-LA, both high BCS at calving and intermediate BC change from calving to 30 days pp are probably required to maintain BCS at 30 days pp and to ovulate early. This result is supported by the different BCS curves observed for delayed-, normal- and PLP-classified cows (Figure 4). Delayed cows were thinner than normal cows after calving. PLP cows tended to have higher BCS before calving than delayed cows, but reached a similar low BC by 60 days in milk, owing to large and prolonged BC loss. Conversely, MY curves did not differ between the P4 profile categories. A higher BCS at calving for PLP cows is often observed (Pushpakumara et al., Reference Pushpakumara, Gardner, Reynolds, Beever and Wathes2003; Taylor et al., Reference Taylor, Beever, Bryant and Wathes2003; Shrestha et al., Reference Shrestha, Nakao, Suzuki, Akita and Higaki2005) but is more rarely significant (Disenhaus et al., Reference Disenhaus, Kerbrat and Philipot2002). This suggests a narrow optimum for BCS at calving: too thin and too fat are known to delay ovulation, whereas slightly over-conditioned animals are also susceptible to an increased risk of PLP.
ORs and 95% CIs for the binomial logistic regression model used to predict the occurrence of a PLP profile in 98 progesterone profiles of Holstein cows (decrease in the residual deviance, P = 5.8E−5; Model CYC-2)

OR = odds ratio; CI = confidence interval; PLP = prolonged luteal phase; C-LA = commencement of luteal activity; pp = post-partum.
The intercept of the model is 5.01.
***, **, *, †OR is significantly or tends to be different from 1 (P < 0.001, 0.01, 0.05, 0.10).
1For continuous variables, ORs are expressed as an increase in 1 s.d. instead of 1 unit (i.e. exp(coefficient of the linear predictor)s.d.).
Curves of the fitted body condition score (BCS, 0 to 5 scale) and body condition change from calving (ΔBC) of Holstein cows according to the post-partum (pp) progesterone profile category (○, normal; ▴, prolonged luteal phase; ▵, delayed; n = 53, 23 and 18, respectively). Models also accounted for parity. At the same pp interval, values with a common letter are not significantly different (P > 0.05) and values with a common letter in brackets tend to be different (P < 0.10).

Metritis is often considered to be a major risk factor of PLP (Opsomer et al., Reference Opsomer, Grohn, Hertl, Coryn, Deluyker and de Kruif2000); however, the inclusion of genital health problems at calving did not improve models, even when distinguishing metritis from other events. Interestingly, all of the 15 cows that encountered severe metritis were well classified using a 0.25 cut-off probability (>0.25 is PLP predicted) in the final model predicting the PLP profile with regard to loge(C-LA) and ΔBC60: nine normal and four PLP profiles. Metritis and PLP may have similar risk factors, but the elongation of the luteal phase can probably occur without any uterine disorder. In a 2 × 2 nutritional experimental design, Villa-Godoy et al. (Reference Villa-Godoy, Hughes, Emery, Stanisiewski and Fogwell1990) induced over-fattening or normal BC in dairy heifers and then restricted their feeding or not. The first and second luteal phases were lengthened by 3 and 5 days only for fat-restricted heifers. Thus, a combination of large body lipid reserves at calving and a strong energy deficit in early lactation may lengthen luteal phases.
More precisely, the ongoing cycle type was related to the BC dynamic at the time of ovulation
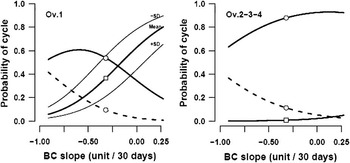
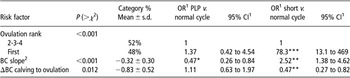
The final model used to predict the occurrence of a PLP cycle, a short cycle (⩽15 days) or a normal cycle following ovulation (Model CYC-3) included ovulation rank (first or later), BC slope at ovulation and BC change from calving to ovulation. Irrespective of the ovulation rank, severely declining BC around ovulation increased the probability of a PLP (Figure 5, Table 5). Conversely, a slightly declining or an increasing BC around ovulation increased the probability of a short cycle, but at first ovulation only, as short cycles are scarce anyway at subsequent ovulations (only 2% of ovulations of ranks 2-3-4 were followed by a short cycle). The probability of a short cycle was all the more high as BC change from calving to first ovulation was negative. Of the PLP events, half occur at first ovulation, but can occur up to the fourth ovulation. According to our results, ovulations that occur while mobilization is still ongoing are more likely to be followed by a PLP. Although requiring further investigation, our results indicate that this BC change effect remains even when accounting for days after calving.
Probabilities of the occurrence of either a normal cycle (–○–), a short cycle (–□–) or a prolonged luteal phase cycle (- -○- -), predicted at first ovulation (Ov.1) and second–third–fourth ovulations (Ov.2-3-4) not followed by an insemination in 189 cycles of Holstein cows, according to the body condition (BC) slope from −30 to +30 days relative to the day of ovulation (left censored at calving), predicted for a BC change from calving to ovulation of −0.83 (Mean), −1.35 (Mean−1 s.d.) or −0.31 (Mean + 1 s.d.) for the short cycles category. Model characteristics are given in Table 5.

ORs and 95% CIs for the multinomial logistic regression model used to predict the occurrence of a normal cycle, a short cycle or a PLP cycle following ovulation in Holstein cows. Prediction relied on 189 ovulations of ranks 1 to 4, occurring before 135 days in milk, not preceding a delayed ovulation of rank above 2, not belonging to a disorder classified progesterone profile and not followed by an insemination (decrease in the residual deviance, P = 7.6E−12; Model CYC-3)

PLP = prolonged luteal phase; OR = odds ratio; CI = confidence interval; BCS = body condition score; BC = body condition.
Intercepts of the model are −2.54 for PLP and −2.78 for the short cycle; the normal cycle is the reference category.
***, **, *, †OR is significantly or tends to be different from 1 (P < 0.001, 0.01, 0.05, 0.10).
1For continuous variables, ORs are expressed as an increase in 1 s.d. instead of 1 unit (i.e. exp(coefficient of the linear predictor)s.d.).
2BC slope from −30 to +30 days relative to the day of ovulation (left censored at calving), expressed in BCS unit per 30 days.
The fact that short cycles conversely occur while the cow is gaining BC close to ovulation is of interest. To our knowledge, there is no literature investigating the relationship between BC change and the realization of short and long luteal phases at first ovulation. Butler et al. (Reference Butler, Everett and Coppock1981) considered that transitory P4 elevation may occur when the cow returns to a positive energy balance, but concluded that it was not related to luteal activity. The probability of short cycle increases as BC change from calving to ovulation widens, suggesting a possible carry-over effect of the negative energy balance period on follicular activity, but only at first ovulation. The risk of short cycles also increases as days in milk increase; however, part of this effect may relate to genetics, as C-LA and the length of the first luteal phase are negatively correlated genetically (Royal et al., Reference Royal, Flint and Woolliams2002).
Overall, these BC effects on ovarian activity are consistent with the much better ovarian activity in breeds with higher BCS throughout lactation and smoother BC change, such as the Normande breed (Cutullic et al., Reference Cutullic, Delaby, Gallard and Disenhaus2011).
Oestrus detection relied on current MY
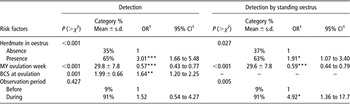
Oestrus detection is a key element of the reproductive performance, especially in compact calving systems. Theoretically, during a 12-week breeding period, cows only have one to four ovulations according to their calving date. In the final Model OES-1 used to predict ovulation detection, the odds of being detected in oestrus were multiplied by 3.0 when at least one other cow was in oestrus, were divided by 1.7 for an increase in MY by 7.8 kg/day (1 s.d.) and were multiplied by 1.6 for an increase in BCS at ovulation by 0.66 unit (1 s.d.; Table 6). Whereas all MY variables had a significant effect (P < 0.001), MY dynamic and general variables had no effect. It was similar for the probability of detecting ovulation by standing oestrus (Model OES-2), except that BCS at ovulation had no significant effect (P > 0.4; Table 6). Thus, as observed in our previous work (Cutullic et al., Reference Cutullic, Delaby, Causeur, Michel and Disenhaus2009b), an increase in MY at ovulation depresses oestrous behaviour independent of BC change. This deleterious effect of MY is consistent with descriptive studies that possibly confound MY and BC loss effects (Lopez et al., Reference Lopez, Satter and Wiltbank2004; López-Gatius et al., Reference López-Gatius, Santolaria, Mundet and Yániz2005). However, too low a BCS may also suppress oestrous behaviour, possibly by altering ovarian activity. Indeed, when we investigated the possible links between cyclicity variables and ovulation detection (Model OES-1bis), we observed that delayed ovulations were scarcely detected. Among the variables related to the previous cycle, only having a current delayed ovulation could affect the model previously reported in Table 6, as none of the six delayed ovulations were detected. When accounting for this variable in the model, the effect of BCS at ovulation narrowed (odds ratio 1.8, 95% CI 1.1 to 3.0). The results suggest that a threshold may exist, under which oestrous behaviour is compromised and above which oestrous behaviour is related to MY. Cutullic et al. (Reference Cutullic, Delaby, Causeur, Michel and Disenhaus2009b) observed a positive effect of losing more BC on oestrus signs; however, the winter total mixed ration low-feeding level was higher and cows did not reach as low a BCS as in this work. In that study, the 2 × 2 factorial design (high v. low feeding in winter × high v. low feeding at grazing, allowing cows to switch from high-to-low or low-to-high MY) suggested an instantaneous MY effect. This may help in achieving strategies to improve oestrus detection around the breeding period.
ORs and 95% CIs for the two binomial logistic regression models used to predict ovulation detection (n = 255; Model OES-1) and ovulation detection by standing oestrus (n = 241; Model OES-2) in ovulations of ranks ⩾2 of Holstein cows (decrease in residual deviance, P = 1.6E−7 and P = 2.4E−6)

OR = odds ratio; CI = confidence interval; MY = milk yield; BCS = body condition score.
Intercepts are 0.46 for the detection model and −0.15 for the detection by standing oestrus model.
***, **, *, †OR is significantly or tends to be different from 1 (P < 0.001, 0.01, 0.05, 0.10).
–, Not included in the final model.
1For continuous variables, ORs are expressed as an increase in 1 s.d. instead of 1 unit (i.e. exp(coefficient of the linear predictor)s.d.).
Physiologically, based on standing oestrus duration quantifications (i.e. ovulations without standing oestrus were excluded), Wiltbank et al. (Reference Wiltbank, Lopez, Sartori, Sangsritavong and Gumen2006) suggested that this deleterious effect of MY could be because of increased 17β-oestradiol and P4 hepatic clearance rates, owing to higher dry matter intake. However, if assumed to be the only effect, the dry matter hypothesis is inconsistent with both the similar ovulation detection rate and the similar proportion of oestri detected by standing behaviour, which we observed for Normande and Holstein cows (Cutullic et al., Reference Cutullic, Delaby, Gallard and Disenhaus2011). Indeed, Holstein cows have higher dry matter intakes than Normande cows in grass-based feeding systems (Dillon et al., Reference Dillon, Buckley, O'Connor, Hegarty and Rath2003) and should therefore have poorer oestrus expression. Such a dry matter effect should thus be considered within breed. We may also wonder whether low BC can enhance oestradiol production (Cutullic et al., Reference Cutullic, Benhaim, Barbey, Mitre, Carreau and Disenhaus2009a), possibly by reducing the inhibitory effect of leptin on steroidogenesis (Spicer, Reference Spicer2001). Direct links between the mammary gland, ovaries and brain may also exist, but they are still poorly understood.
While investigating possible links between cyclicity and oestrus (Model OES-1bis), we also observed that the odds of ovulation detection were divided by 2.6 (95% CI 1.2 to 5.5) for cows with a PLP profile compared with cows with a normal profile. Thus, PLP cows were more at risk of having undetected ovulations, regardless of whether or not these ovulations followed the PLP itself. This result is consistent with the concomitant increase in the PLP frequency (Royal et al., Reference Royal, Darwash, Flint, Webb, Woolliams and Lamming2000) and the decrease in oestrus duration and intensity (Van Eerdenburg et al., Reference Van Eerdenburg, Loeffler and Van Vliet1996) over the last decades in Holstein cows. PLP occurrence appears to be related to body lipid reserves, whereas oestrus behaviour is associated with MY. This suggests that some effects on oestrus are not accounted for by the MY level and requires further investigations.
Embryo survival was linked to both BCS and MY
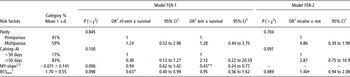
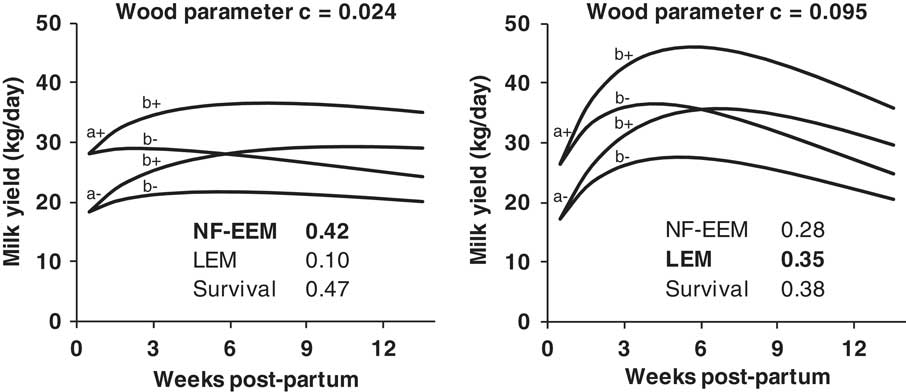
Recalving requires fertilization, early embryo survival, but also late embryo survival and foetal survival. Both early embryo mortality and late embryo mortality are thought to be the major risk factors for pregnancy failure in a temperate climate, in varying proportions according to regions, cow types and management strategies (Diskin et al., Reference Diskin, Murphy and Sreenan2006; Humblot et al., Reference Humblot, Fréret and Ponsart2009). An increase in BCSmin significantly decreased the risk of non-fertilization or early embryo mortality rather than embryo survival at first and second inseminations (Table 7, Model FER-1). However, an increase in BCSmin only tended to increase the recalving rate (Table 7, Model FER-2). In fact, in our study, late embryo mortality did not appear to be BCS related, but rather MY related. Indeed, an increase in the slope of MY around ovulation (i.e. a flatter MY slope around ovulation, as MY slopes are mostly negative) decreased the risk of late embryo mortality rather than embryo survival. Significant effects were also found for most of MY variables at the beginning of lactation (P < 0.05), suggesting a link to the shape of the lactation curve. Indeed, the Wood curve persistency parameter c had a significant effect on insemination results (P = 0.003). In order to illustrate this effect, four low-persistency curves and four high-persistency curves (within the range of our dataset) were drawn and the corresponding predicted probabilities of insemination results were calculated (Figure 6). Regardless of the MY level, cows with a low persistency after peak were more likely to encounter late embryo mortality, whereas cows with flat curves were more likely to encounter non-fertilization or early embryo mortality. In the final Model FER-1 (non-fertilization or early embryo mortality v. late embryo mortality v. embryo survival), glucose also tended to have an effect while replacing BCSmin (P = 0.065, n = 122, six missing values). An increase in glucose concentration at insemination by 5.7 mg/dl (1 s.d., mean 62.8 mg/dl) divided by 2.0 the odds of non-fertilization or early embryo mortality rather than late embryo mortality (95% CI 1.1 to 3.7).
ORs and 95% CIs for the two logistic regression models used to predict either the occurrence of nf-eem v. lem v. embryo survival (Model FER-1, multinomial) or the occurrence of recalving (Model FER-2, binomial) following 128 artificial inseminations of ranks 1 and 2 of Holstein cows (decrease in the residual deviance, P = 0.005 and 0.085)

OR = odds ratio; CI = confidence interval; nf-eem = non-fertilization–early embryo mortality; lem = late embryo mortality; MY = milk yield.
***, **, *, †OR is significantly or tends to be different from 1 (P < 0.001, 0.01, 0.05, 0.10).
–, Not included in the final model.
Intercepts of Model FER-1 are 2.00 for the nf-eem category and −2.06 for the lem category; the intercept of Model FER-2 is −2.45.
1For continuous variables, ORs are expressed as an increase in 1 s.d. instead of 1 unit (i.e. exp(coefficient of the linear predictor)s.d.).
2Milk yield slope over weeks −2 to +2 relative to the week of ovulation, expressed in kg/day.
Examples of eight Wood lactation curves (MY = a × weekb × exp−c × week), with the persistency parameter c equal to either 0.024 (i.e. population mean –1 s.d.) or 0.095 (i.e. mean +1 s.d.) and the corresponding probabilities of non-fertilization – early embryo mortality, late embryo mortality and embryo survival at first and second inseminations in Holstein cows (n = 128). These insemination result probabilities are predicted for a calving–artificial insemination (AI) interval ⩾50 days and a Wood curve parameter c equal to either 0.024 or 0.095, in a multinomial logistic model accounting for calving–AI interval (P = 0.015) and Wood curve parameter c (P = 0.003; model decrease in residual deviance, P = 2.7E−3). For Wood lactation curves, parameters a, b and c control the milk yield scale, rise and persistency, respectively. Within each graph, that is, for each fixed persistency parameter c, the four lactation curves are generated by fixing the scale parameter a to its mean either +1 s.d. (a+) or −1 s.d. (a−) and by fixing the rise parameter b to its predicted value either +1 r.s.e. (b+) or −1 r.s.e. (b−) in a multiple regression model including parameters a and c.
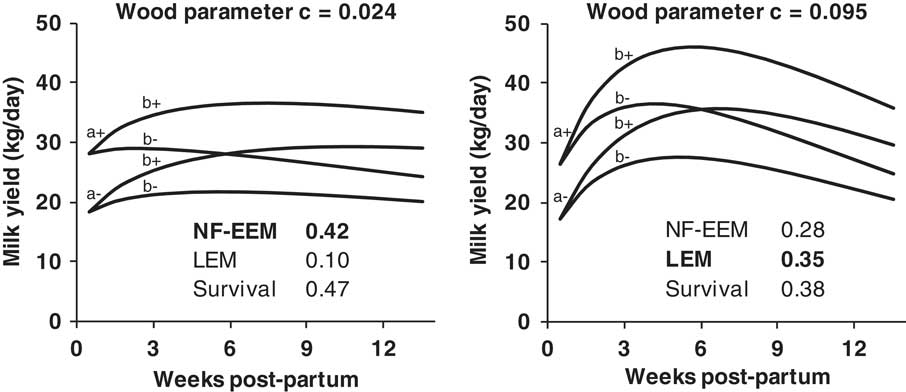
Our results suggest that low BCS increases the risk of early embryo mortality, even though MY is low, whereas the effects of peak lactation increase the risks of late embryo mortality (Figure 6) even when a correct BCS is maintained. MY and BCS may thus affect oocyte and embryo development at different stages.
A negative energy balance pp is widely considered to affect oocyte and embryo developmental competence in high-yielding dairy cows (Leroy et al., Reference Leroy, Opsomer, Van Soom, Goovaerts and Bols2008) and low BCS or large BC change are often reported as major risk factors of infertility (Roche et al., Reference Roche, Macdonald, Burke, Lee and Berry2007). Little is known about the potential direct deleterious effects of current MY or lactation curve shape on late embryo survival, which may be related to over-exposure to metabolic or galactopoietic hormones. In a field study, Grimard et al. (Reference Grimard, Fréret, Chevallier, Pinto, Ponsart and Humblot2006) previously reported a deleterious effect of high peak MY on embryo–foetal survival. This shape effect may explain the reduced late embryo mortality rates in breeds with flatter lactation curves, such as the Normande breed (Cutullic et al., Reference Cutullic, Delaby, Gallard and Disenhaus2011). However, further investigation is needed to confirm this result. Similarly, the conflicting impact of plasma glucose concentrations on early and late embryo development remains to be confirmed.
While investigating the possible links between cyclicity, oestrus and fertility (Model FER-2bis), it appeared that fertility at first and second inseminations was not considerably influenced by previous steps. The Model FER-2 already included parity, calving–AI interval <50 days,  (Table 7). Loge(C-LA) tended to have an effect when BCSmin was removed from the model (P = 0.082). An increase in Loge(C-LA) by 0.47 (1 s.d., mean 3.49) multiplied the odds of non-fertilization or early embryo mortality rather than embryo survival by 1.6 (95% CI 1.0 to 2.5). The occurrence of a previous short cycle also tended to improve the model (P = 0.098), as the 13 inseminations following short cycles resulted in only two embryo survivals. Other previous cycle characteristics including P4 profile category and standing behaviour detection did not affect the model (P > 0.4) and therefore good oestrus expression was not associated with improved fertility. This result seems logical with regard to the previously observed effects of milk production on oestrus and of BC on fertility and suggests that oestrus can be compromised without compromising fertility, whereas the converse is also true. In our previous study (Cutullic et al., Reference Cutullic, Delaby, Causeur, Michel and Disenhaus2009b), the clearer the behavioural signs were, the higher was the recalving rate. However, low-fed cows were not challenged to the same intensity as in this study (Delaby et al., Reference Delaby, Faverdin, Michel, Disenhaus and Peyraud2009), and the oestrus–fertility relationship probably did not reach uncoupling as we have observed here.
Overall, our results point to a possible uncoupling between cyclicity, oestrus and fertility and allow for compensations leading to similar final reproductive performance in many studies that compared feeding levels (Horan et al., Reference Horan, Mee, Rath, O'Connor and Dillon2004; Pedernera et al., Reference Pedernera, Garcia, Horagadoga, Barchia and Fulkerson2008; Pollott and Coffey, Reference Pollott and Coffey2008; Delaby et al., Reference Delaby, Faverdin, Michel, Disenhaus and Peyraud2009).
Conclusion
This study provides new information on the respective effects of MY and of body lipid reserve level and change on the overall reproductive process. The results indicate that these effects may be different at different stages, with some reproductive steps related to body lipid, whereas others may relate to MY. Cyclicity and early embryo survival were associated with BCS level and change with deleterious consequences arising from excessively low BCS or high BC change. Conversely, oestrous behaviour and late embryo mortality were mainly associated with MY, level and change, respectively. These results also point to a possible uncoupling between cyclicity, oestrus and fertility and suggest that there is potential for compensation along the reproductive process. In compact calving systems requiring high and compact pregnancy rates, high MY strategies appear to be unsuitable even if BCS is maintained, owing to depressed oestrous behaviour and probably increased late embryo mortality that delays rebreeding. Similarly, strategies that compromise cyclicity and fertility by excessively low BCS are unsuitable. The results of this study also indicate that the thresholds wherein reproductive processes become compromised remain to be determined in order to optimize reproductive performance.
Acknowledgements
The authors thank the staff of the INRA experimental farm Le Pin-au-Haras, especially Yves Carbonnier, Loïc Leloup, René Dernaucourt, Nicolas Desramé, Guillaume Michel, Ségolène Leurent and Marion Pavec for the time spent sampling, observing animals, recording and organizing data. Jacques Portanguen and Clara Lambard are also acknowledged for their large implication in P4 assays. The authors also thank Brendan Horan for improving the English and for his scientific suggestions. This work received financial support from the Basse-Normandie regional council.