INTRODUCTION
Tropical and subtropical coastal areas are characterized by the highest species richness in the shallow marine realm (Crame, Reference Crame2000a, Reference Crameb; Rex et al., Reference Rex, Crame, Stuart and Clarke2005). However, there are still gaps in our understanding of the regional controls of diversity after a long history of biodiversity studies, primarily because of the lack of research in some specific geographic areas of the tropics. The most severe knowledge gaps in biodiversity from shallow marine environments exist from the Indian Ocean (Crame, Reference Crame2000a). For molluscan diversity, these major gaps include the African coast, the Indian coast and the oceanic islands (Stehli et al., Reference Stehli, Mcalester and Helsley1967; Crame, Reference Crame2000a, Reference Crameb; Gray, Reference Gray2001). Although efforts have been made to close the gap for other areas (Oliver, Reference Oliver2000; Oliver & Zuschin, Reference Oliver and Zuschin2001; Ashton et al., Reference Ashton, Macintosh and Hogarth2003; Zuschin & Oliver, Reference Zuschin and Oliver2003, Reference Zuschin and Oliver2005; Zuschin Zauner & Zuschin, Reference Zauner and Zuschin2016; Steger et al., Reference Steger, Jambura, Mähnert and Zuschin2017), limited efforts have been directed to study molluscan diversity of the Indian coast (Satyamurti, Reference Satyamurti1952, Reference Satyamurti1956; Venkataranman & Wafar, Reference Venkataranman and Wafar2005; Ramakrishna & Dey, Reference Ramakrishna and Dey2010). There is a plethora of studies on species that are important for aquaculture (Rao, Reference Rao1969; Appukuttan, Reference Appukuttan1972; Reference Appukuttan1996; Alagarswami, Reference Alagarswami1974a; Reference Alagarswamib; Reference Alagarswami1975, Reference Alagarswami1983; Mahadevan & Nayar, Reference Mahadevan and Nayar1976; Dharmaraj & Nair, Reference Dharmaraj and Nair1980; Mahadevan et al., Reference Mahadevan, Nayar and Muthiah1980; Nair & Dharmaraj, Reference Nair and Dharmaraj1980; George et al., Reference George, Thomas, Appukuttan and Gopakumar1986; Alagarswami et al., Reference Alagarswami, Chellam, Victor, Dharmaraj, Velayudhan and Gandhi1987; Tanabe et al., Reference Tanabe, Prudente, Kan-Atireklap and Subramanian2000; Kripa & Appukuttan, Reference Kripa, Appukuttan, Joseph and Jayaprakash2003; Kripa et al., Reference Kripa, Mohamed and Velayudhan2012) at a local scale from various sites along the Indian coast. Among marine benthos, bivalves have been taxonomically standardized, and their global diversity trends are representative of standing benthic invertebrate diversity trends reported for shelf faunas in general (Valentine & Jablonski, Reference Valentine and Jablonski2015). Moreover, they are often reported exhaustively due to their economic importance and are known to respond to oceanographic variables (Fernández et al., Reference Fernández, Astorga, Navarrete, Valdovinos and Marquet2009; Miller et al., Reference Miller, Versace, Matthews, Montgomery and Bowie2013). Despite these advantages that make bivalves an ideal group to study regional biodiversity, there has not been a single detailed study focusing on marine bivalves that evaluated the regional control on latitudinal and coastal variation in diversity along the Indian coast.
The Indian coastal region presents a unique scenario to evaluate the contribution of a regional environment on diversity profile of marine organisms, especially the marine benthos such as bivalves. Two of the coastlines of the Indian subcontinent have similar latitudinal spread of 15° (8–23°N). Such a wide latitudinal range is likely to demonstrate a biodiversity gradient conforming to global patterns such as the Latitudinal Biodiversity Gradient (LBG). However, the physiographic characters of the two coasts (east vs west) are strikingly different. Differences between the coasts primarily come from the distinct physical and chemical regimes of the Arabian Sea (west coast) and Bay of Bengal (east coast). These two enclosed basins differ primarily because of the differing amounts of freshwater and sediment influx. The Bay of Bengal receives large quantities of fresh water from hinterland rivers (an imposing 1.6 × 10¹² m3 year−1 compared with 0.3 × 10¹² m3 year−1 in the Arabian Sea (Subramanian, Reference Subramanian1993)) as well as oceanic precipitation making its upper layers less saline (Shetye et al., Reference Shetye, Shenoi, Gouveia, Michael, Sundar and Nampoothiri1991; Shankar & Shetye, Reference Shankar and Shetye2001). It also receives a substantial amount of siliciclastic input through the Ganga-Brahmaputra River system (Sangode et al., Reference Sangode, Suresh and Bagati2001) and other major rivers such as the Mahanadi, Godavari, Krishna, Cauvery, Subarnarekha and Baitarani (Subramanian, Reference Subramanian1996). The west coast, on the contrary, is dominated by the Indus river system with minor siliciclastic input from the Narmada and Tapi rivers (Chamyal et al., Reference Chamyal, Khadkikar and Maurya1997; Inam et al., Reference Inam, Clift, Giosan, Tabrez, Tahir, Rabbani and Danish2007; Marathe et al., Reference Marathe, Marathe and Sawant2011). The associated suspended sediment discharge into the Bay of Bengal is estimated to be as high as 14 × 108 tonnes compared with ~2 × 10⁸ tonnes in the Arabian Sea (Madhupratap et al., Reference Madhupratap, Mangesh, Ramaiah, Kumar, Muraleedharan, De Sousa, Sardessai and Muraleedharan2003).
The physiographic characters that separate the east from west coast of India may have an important influence on marine biodiversity. Rivers are important factors in controlling productivity; the presence of larger rivers in a region leads to higher productivity, which in turn may affect marine species diversity and composition (Eadie et al., Reference Eadie, McKee, Lansing, Robbins, Metz and Trefry1994; Gallmetzer et al., Reference Gallmetzer, Haselmair, Tomašových, Stachowitsch and Zuschin2017). Suspension-feeding molluscs depend on primary productivity in the water column for food, which is also affected by nutrients carried in freshwater inflow of the rivers. Salinity, a functional parameter for biological diversity, is also controlled by river input. Although studies have suggested strong ties between salinity and biological diversity in marine ecosystems, they fail to come to a consensus about the exact nature (positive or negative) of the effect (Drouin et al., Reference Drouin, Himmelman and Béland1985; Casamayor et al., Reference Casamayor, Calderon and Pedros2000). Apart from salinity and productivity, the suspended siliciclastic input from rivers often hinders bivalve growth and can dictate the population size of molluscan assemblages in a specific environment (Ellis et al., Reference Ellis, Cummings, Hewitt, Thrush and Norkko2002; Coco et al., Reference Coco, Thrush, Green and Hewitt2006).
Previous studies evaluating the effect of the physical environment on regional marine biodiversity have primarily been conducted in the temperate region and geographically concentrated in the coastal areas around the Mediterranean Sea (Astraldi et al., Reference Astraldi, Bianchi, Gasparini and Morri1995; Sabatés et al., Reference Sabatés, Olivar, Salat, Palomera and Alemany2007) and Pacific (Bergen et al., Reference Bergen, Weisberg, Smith, Cadien, Dalkey, Montagne, Stull, Velarde and Ranasinghe2001) and Atlantic Oceans (Sanders, Reference Sanders1968; Boesch, Reference Boesch1979). Although many of these studies found a strong influence of various regional factors (such as sedimentation, coastal character, latitude) on marine diversity, the relationships were highly region specific, and thus cannot be used as generalized predictors for unexplored areas (Sanders, Reference Sanders1968). The Indian coastline, with its great variation in physical character and without exhaustive documentation of marine species, has rarely been explored for assessing the effect of regional environment on diversity. In a limited area of the north-western shelf of India, Jayaraj et al. (Reference Jayaraj, Jayalakshmi and Saraladevi2007) evaluated environmental influences on macrobenthos and found a combination of factors (such as temperature, salinity, dissolved oxygen, sand and organic matter) explaining macrobenthos diversity. In their comprehensive study, Sivadas & Ingole (Reference Sivadas and Ingole2016) have attempted to evaluate this effect around the entirety of India by documenting benthic communities of coastal basins of India. However, the coarse resolution of their study, fixed at basin scale, was insufficient to assess finer geographic controls on biodiversity that one expects along the Indian coastline due to its great geomorphological heterogeneity.
In this study, we attempted to evaluate the nature of diversity and species composition of marine bivalves along the coast of India in order to understand if intra-tropical marine diversity is guided by regional environmental parameters. It would also give us an opportunity to evaluate if this pattern is conformable with LBG. Using occurrence data of Recent bivalves from a database maintained by the National Institute of Oceanography, Goa, we addressed the following questions:
1. Can variation in species richness be explained by regional environmental parameters (such as productivity, salinity, temperature, coastal length and rivers)?
2. What dictates the variation in species composition along the coast?
3. Does the pattern of species richness follow the LBG?
MATERIALS AND METHODS
Diversity and ecology
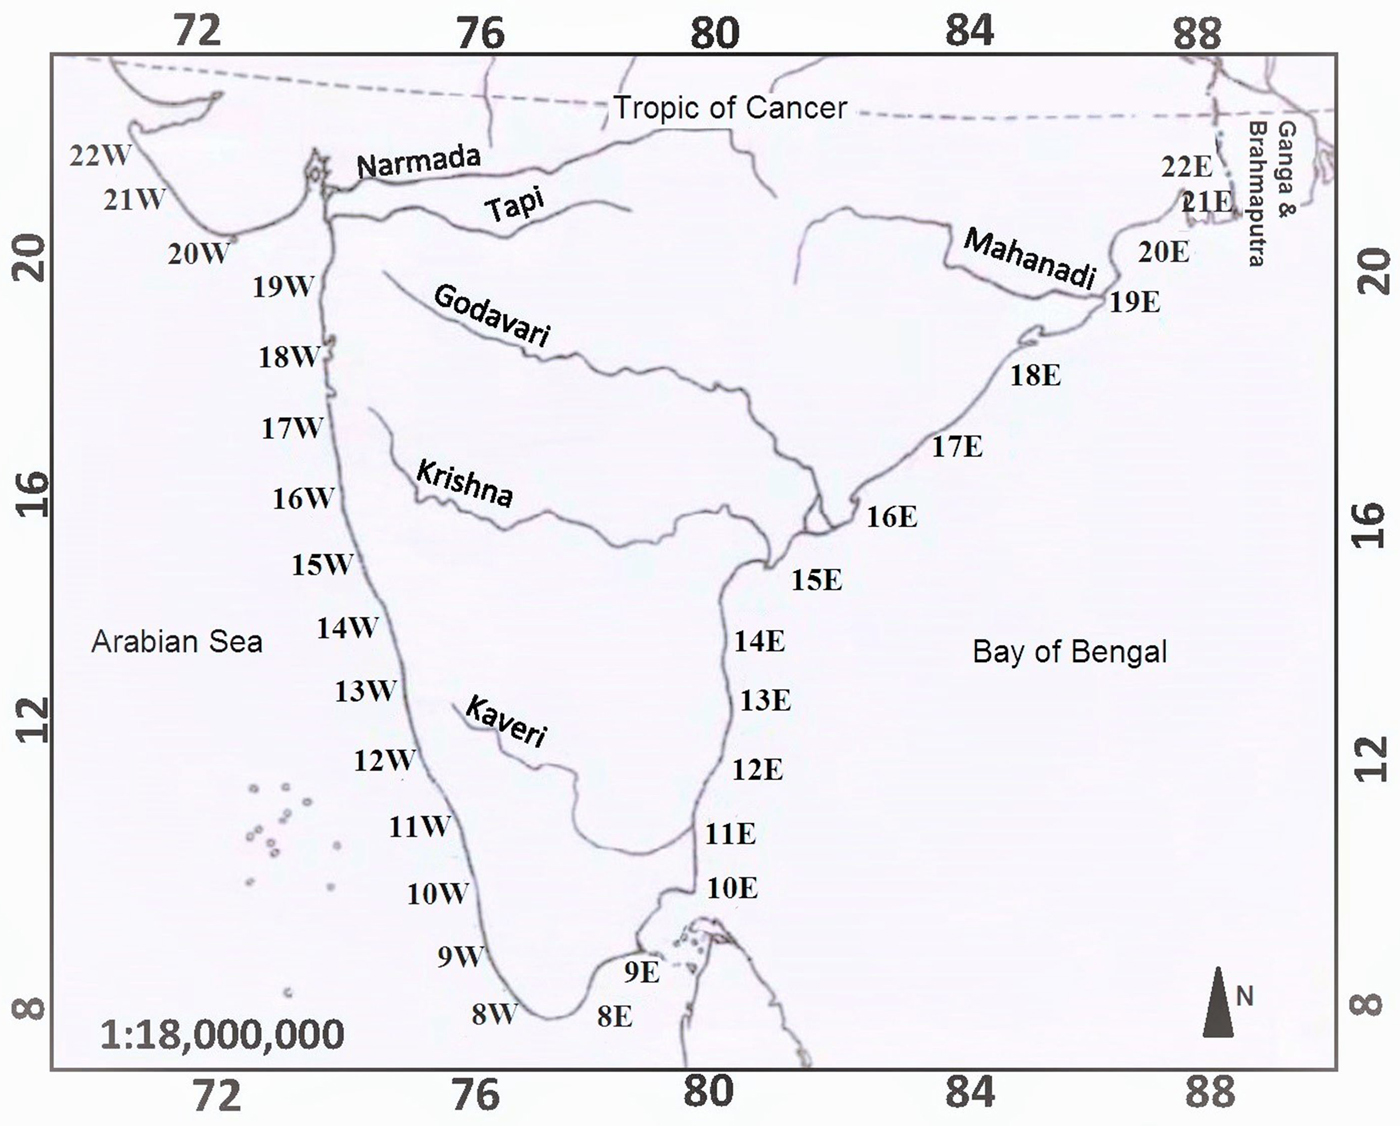
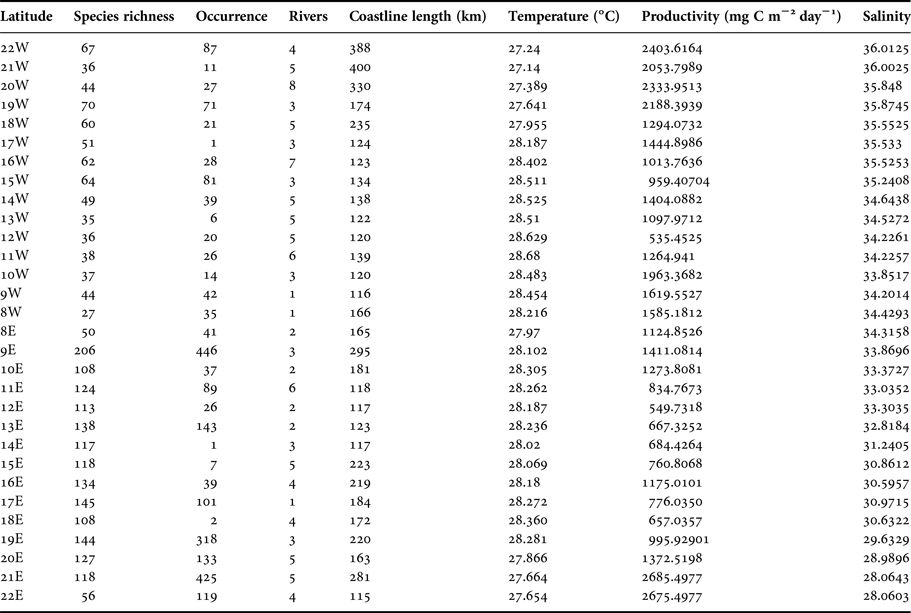
We have collected pre-existing occurrence data from bioSearch (http://www.biosearch.in); it is a marine biodiversity database of India that is developed and maintained by the Bioinformatics Centre, National Institute of Oceanography, Goa, India. It has occurrence data of various marine groups reported from scientific cruises and other published literature. Occurrence, in our study, implies the number of times a species is reported from a latitudinal bin. It does not contain any information about the number of individuals or the sampling intensity. The database provided scientific name, along with taxonomic details, feeding habit, habitat, size and location. Location data are often supplemented by Google Earth for acquiring correct latitude and longitude. To standardize the quality of the data, we excluded the occurrences where the taxon was not identified to species level or the location name was not specific. Each coast is divided into 15 equally spaced latitude bins (Figure 1, Table 1) and occurrence of species in each bin is recorded. The bathymetric information is sparse; however, the majority of the occurrence is from shallow shelf setting. Occurrence from same location with bathymetric difference are treated as single occurrence. Taxonomic information was verified later using the World Register of Marine Species (WoRMS). The ecological information was collected from various sources including bioSearch, NMita and published literature; if details were unavailable at species level, genus level data were considered.
Indian map showing the major rivers and latitudinal bins used for this study. The map is based on Survey of India Outline map (1996). Each bin is characterized by a specific name denoted by the latitude and the initials of the coast in which the bin is located.

Summary of bivalve diversity and environmental parameters in various latitudinal bins along the two coasts of India.

We recorded three ecological characteristics, namely, substrate relationship, type of attachment and feeding. All bivalves are classified in the following substrate relationship: (1) Infaunal (Infaunal siphonate, Semi-infaunal, Infaunal asiphonate), (2) Epifaunal, (3) Others (Borer on or within hard substrates, Nestler on or within hard substrates). According to style of attachment, the species are divided into the following groups: (1) Byssally attached, (2) Cemented and (3) Unattached. The bivalve species are classified into three groups based on their feeding behaviour: (1) Deposit feeders (subsurface and surface deposit feeder), (2) Suspension feeders, (3) Others (chemosymbiotic deposit feeder, predatory carnivores).
Environmental parameters
We collected environmental data from the Ocean Productivity database (http://www.science.oregonstate.edu/ocean.productivity/standard.product.php) for each latitudinal bin. The data source housed annual mean and range of net primary productivity (NPP), sea surface temperature (SST) and salinity. For counting numbers of rivers and measuring the length of the coastline, we used Google Earth images at the resolution of 1:20,500 (Table 1).
Analysis
We used species richness as a measure of species diversity in this study. Species richness is the total number of species in that particular latitudinal bin. Rarefied species richness curves are constructed from total number of occurrences and the confidence interval (calculated by bootstrap method) to evaluate the statistical distinctness of the rarefaction curves are calculated following the method proposed by Colwell et al. (Reference Colwell, Chao, Gotelli, Lin, Mao, Chazdon and Longino2012). Along with observed species richness, we also used a range-through approach to calculate species richness for assessing latitudinal gradient; in this approach, if a species appears in two or more non-adjacent bins, they are assumed to be present in all the intermediate bins in that specific coast. We estimated the effect of environmental variables with multiple generalized linear models (GLMs) that analyses predictors simultaneously and evaluates their partial contributions to total variation in diversity (Quinn & Keough, Reference Quinn and Keough2002).
Similarities among latitudinal bins were calculated from a presence/absence matrix of the species in bins using the Sørensen similarity index. The Sørensen index implicitly incorporates differences in composition attributable to diversity gradients, ignoring relative magnitude of species gains and losses (Koleff et al., Reference Koleff, Gaston and Lennon2003). The similarity matrices were clustered by unweighted pair group method using arithmetic averages (UPGMA), and visualized as a dendrogram. AU (Approximately Unbiased) P-value, which is computed by multiscale bootstrap resampling and hence is a better approximation to unbiased P-value, is used to compare groups in the dendrogram. Two-dimensional ordination assembles were created with non-metric multidimensional scaling (NMDS) using Sørensen similarity indices. To assess the relative importance of environmental parameters for distribution of all species, we used Redundancy Analysis (RDA). RDA can be thought of as the canonical extension of principal component analysis (PCA), where ordination vectors are constrained by multiple regression to be linear combinations of the original explanatory variables (Legendre & Legendre, Reference Legendre and Legendre1998). The species distribution data were Hellinger distance-transformed (Legendre & Gallagher, Reference Legendre and Gallagher2001). This transformation enables us to analyse species distribution data by Euclidean-based ordination methods like RDA, hence it is a preferable alternative to chi-square based ordination methods, such as canonical correspondence analysis (CCA, Legendre & Gallagher, Reference Legendre and Gallagher2001). Significance of the canonical models, in terms of the first canonical axis and all canonical axes, was tested using 999 permutations. For cluster, NMDS and RDA analyses, we considered only those latitudinal bins where there is a minimum of 20 occurrences.
All univariate and multivariate analyses were performed in R (R Core Team, 2012). The ecological analyses were done using the packages Vegan and BiodiversityR in R platform.
RESULTS
Species diversity
We encountered a total of 2436 occurrences representing 417 species belonging to 183 genera. Out of these, 1927 occurrences are recorded from the east coast which represent 371 species (157 genera) and 509 occurrences are from the west coast representing 177 species (89 genera). Total number of families for the east and the west coast is 53 and 37 respectively. The most common five families are Veneridae, Teredinidae, Mytilidae, Tellinidae and Arcidae. There are 125 common species shared between the east and the west coast. The most common species is Anadara antiquata for the east coast and Donax scortum for the west coast.
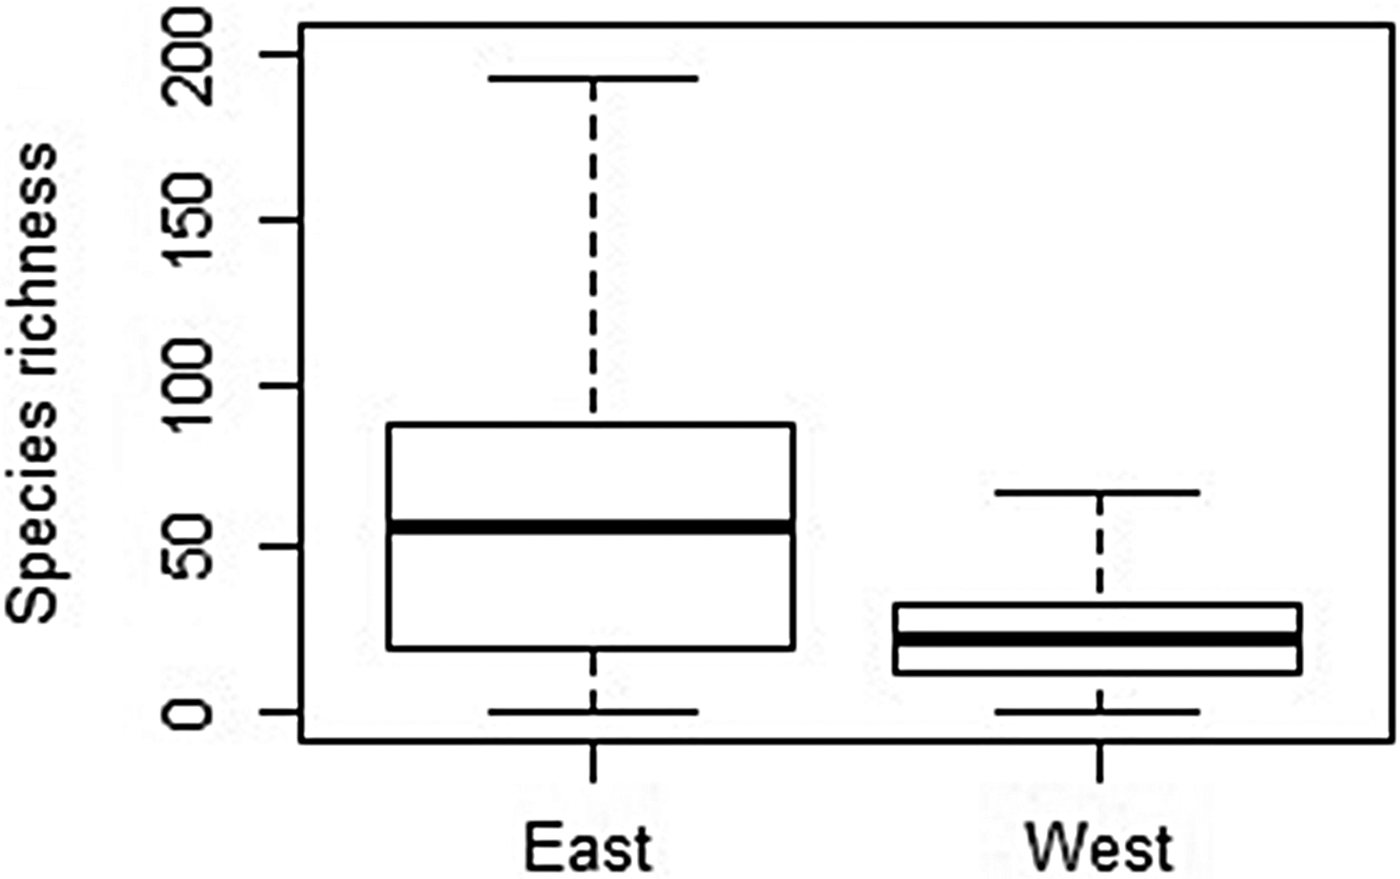
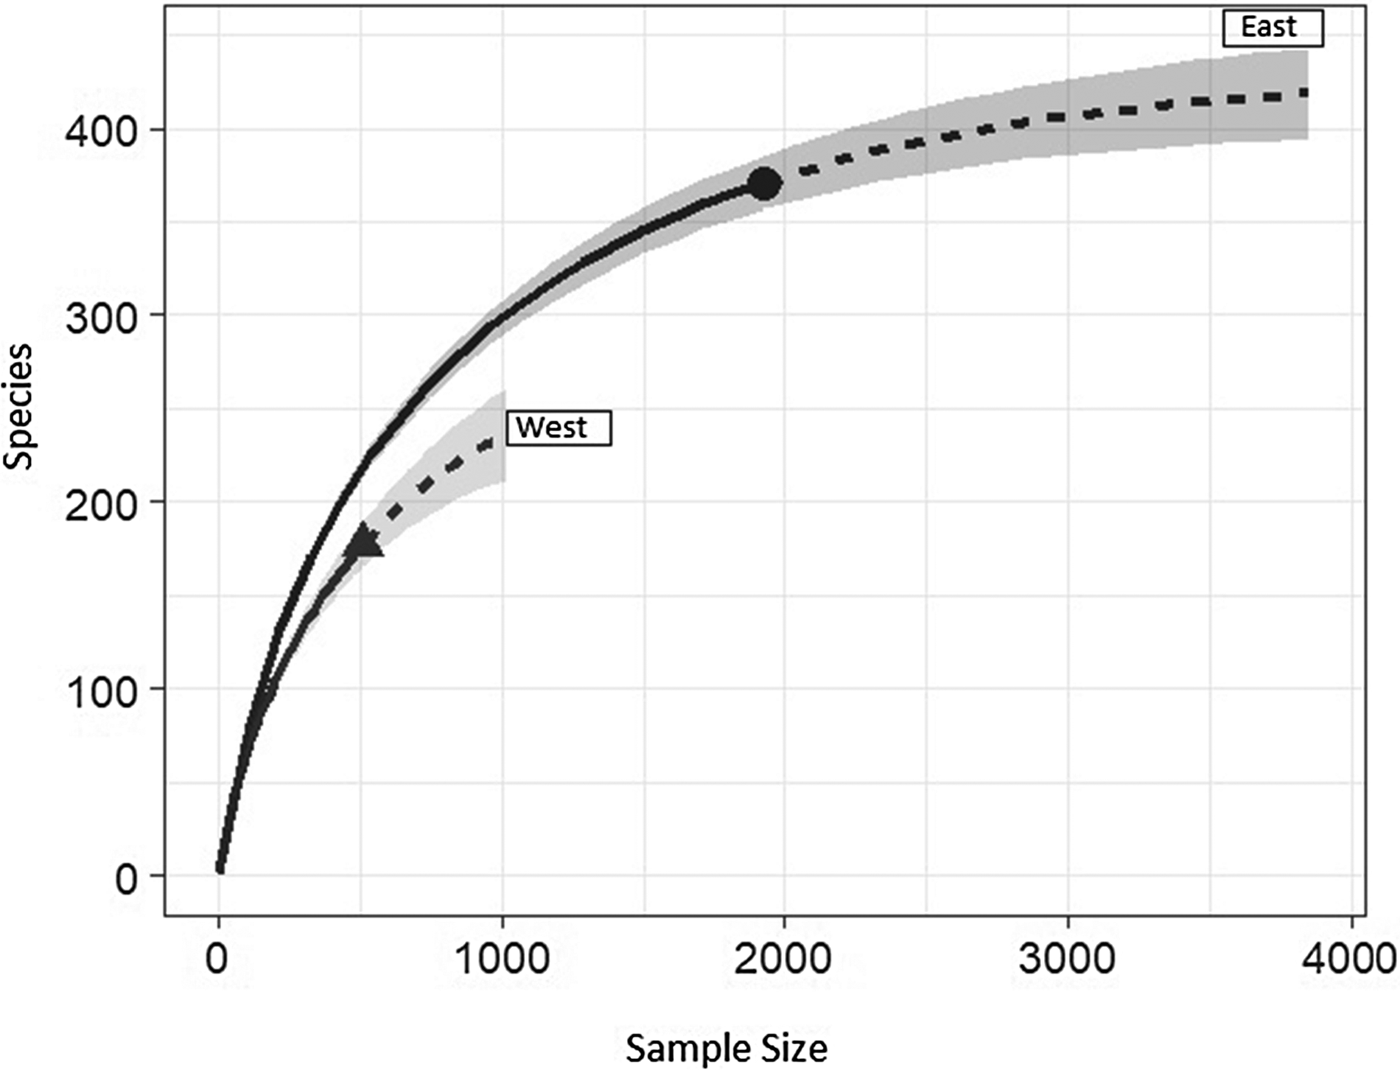
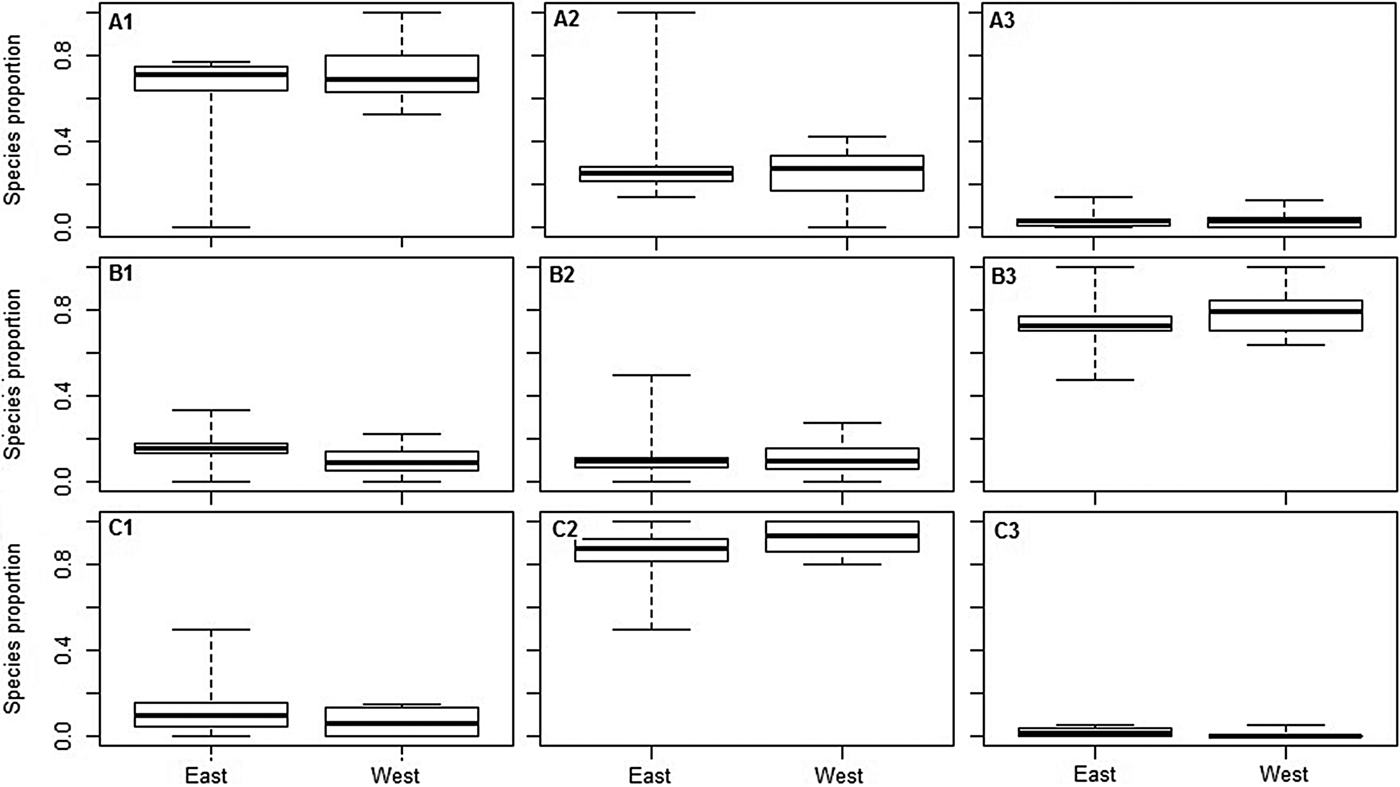
The east coast has slightly higher median species richness per bin compared with the west coast (Figure 2; Wilcoxon rank sum test W = 157.5 and P = 0.06). To account for unequal occurrences between two coasts, we compared the rarefied species richness of the two coasts (Figure 3). The rarefied richness shows a significant difference between the east and the west coast. The difference is not significant in terms of relative abundance of various life modes (Figure 4).
Relationship between species richness (per latitudinal grid) and coast. The boxes are defined by 25th and 75th quantiles; thick line represents median value.

Rarefied species richness for east and west coast with confidence intervals. The solid and dashed lines represent interpolated and extrapolated values respectively.

Relative proportion of various ecological groups in two coasts. (A) Lifemode (1. Infauna, 2. Epifauna, 3. Others). (B) Attachment type (1. Byssally attached, 2. Cemented, 3. Unattached). (C) Feeding type (1. Deposit feeder, 2. Suspension feeder, 3. Others). The boxes are defined by 25th and 75th quantiles; thick line represents median value.

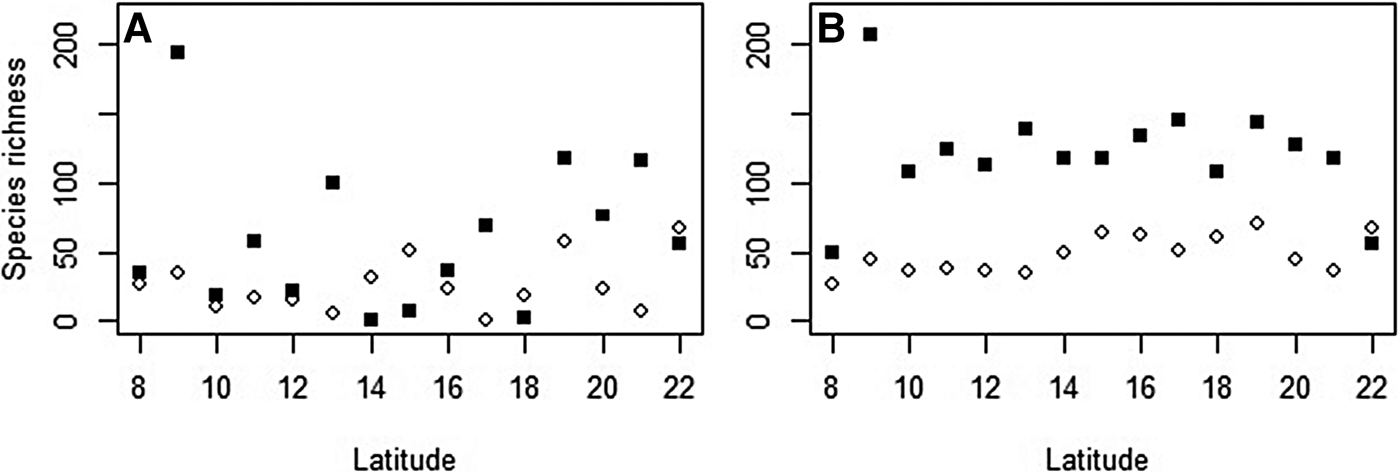
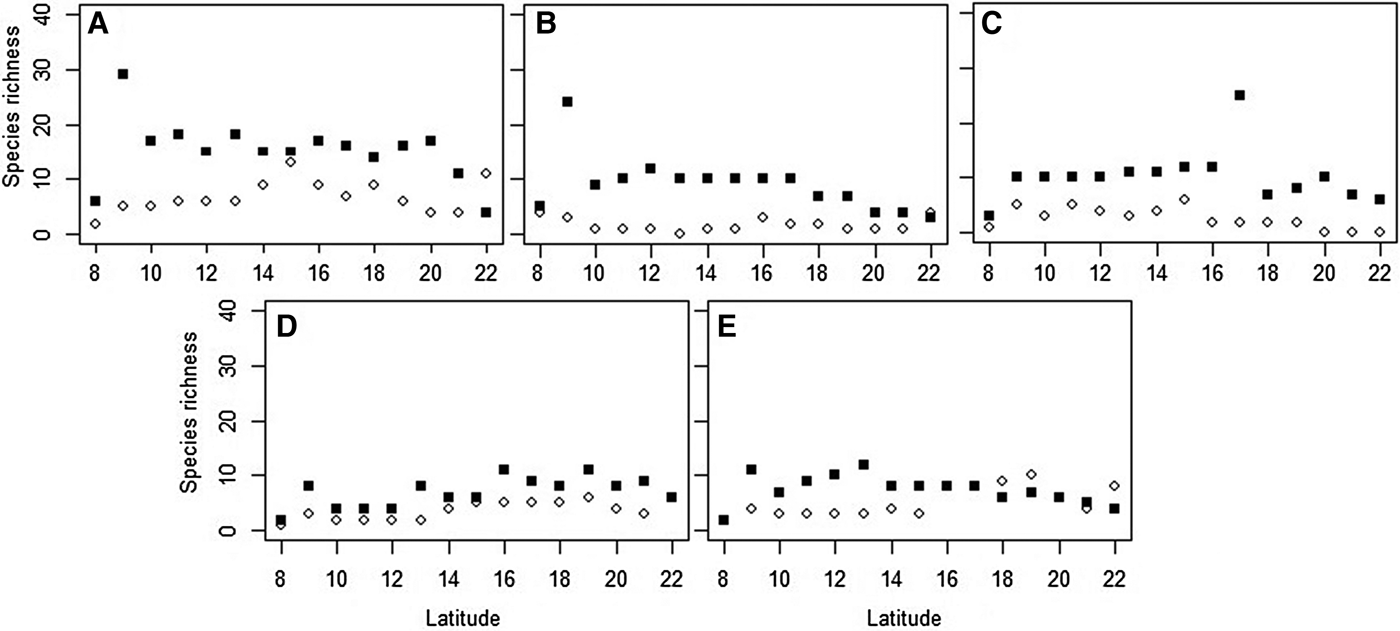
There is no correlation between species richness and latitude for the east coast (Spearman's rho = 0.05 and P = 0.84); however, the west coast shows a significant positive correlation (Spearman's rho = 0.56 and P = 0.03) (Figure 5). When we run the analysis for the five most common families, Teredinidae (Spearman's rho = −0.670 and P = 0.006), Tellinidae (Spearman's rho = 0.748, P = 0.0013) and Arcidae (Spearman's rho = 0.7365, P = 0.0017) show a significant positive correlation for the west coast (Figure 6).
Relationship between species richness and latitude from (A) actual occurrence, (B) range-through occurrence. West coast is represented by open diamonds and east coast is represented by solid squares.

Relationship between species richness (range through) and latitude for most common families. (A) Veneridae, (B) Teredinidae, (C) Tellinidae, (D) Mytilidae, (E) Arcidae. West coast is represented by open diamonds and east coast is represented by solid squares.

Life modes
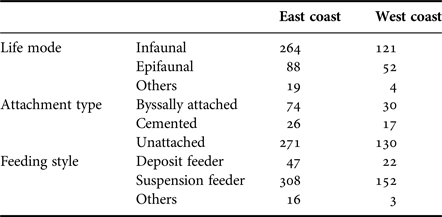
The species represent a variety of life modes, attachment types and feeding styles (Table 2). Infaunal emerges to be the most common life mode. Comparison between the coasts shows that the east coast consists of a slightly higher proportion of infaunal species than the west coast (Wilcoxon rank sum test, W = 154, P = 0.08). Among the epifaunal species, the east coast has a slightly higher proportion of cemented bivalves compared with the west coast. The two coasts do not show any significant difference in proportion of various feeding styles.
Summary of distribution of bivalves of various ecological types in two coasts of India.

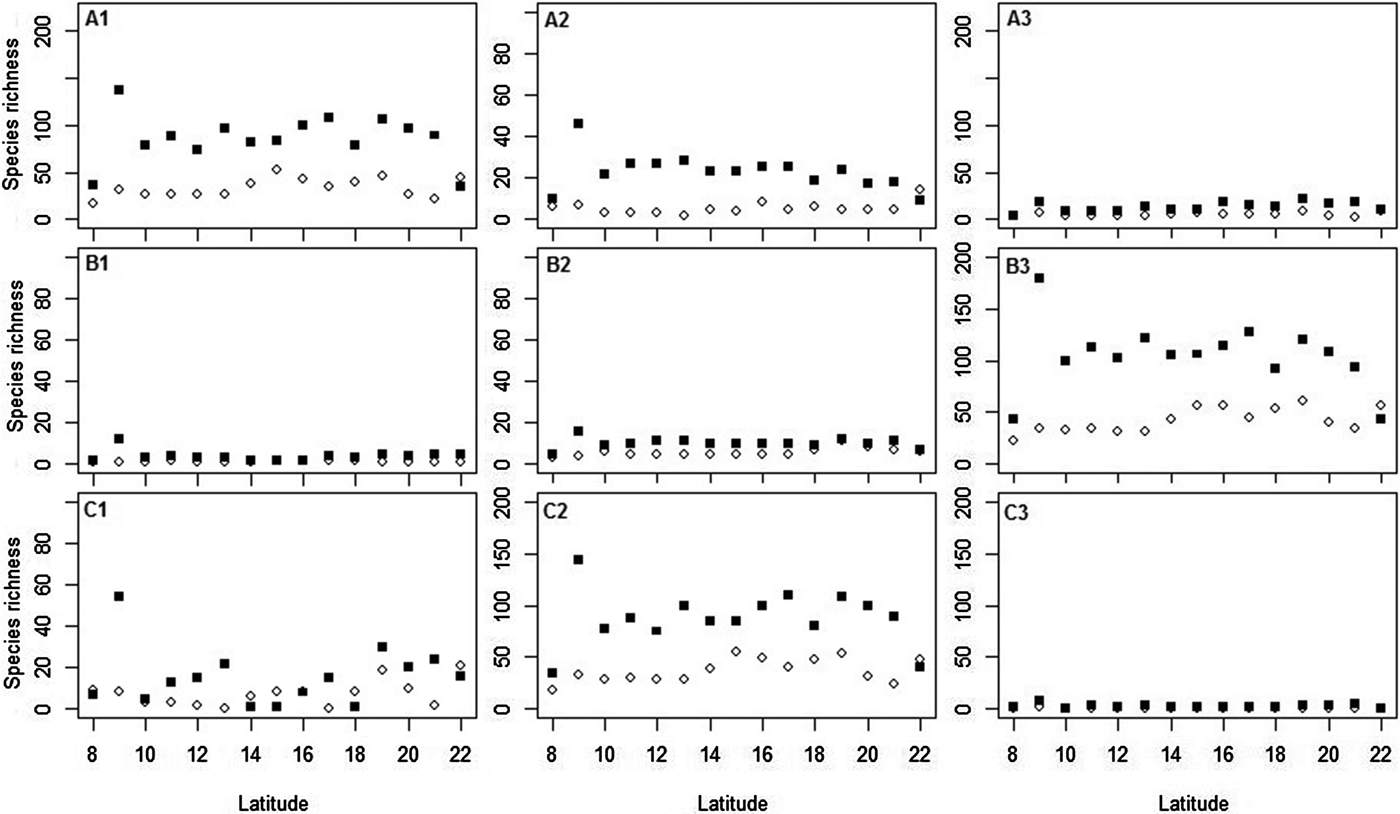
The latitudinal distribution of life modes did not show any consistent pattern for either of the coasts (Figure 7). The same is true for attachment type and feeding style. Epifauna shows a significant correlation for both east (Spearman's rho = −0.51 and P = 0.04) and west coast (Spearman's rho = 0.66 and P = 0.006) (Figure 7). Among various epifaunal groups, only cemented bivalves show a significant positive correlation for west coast (Spearman's rho = 0.76 and P = 0.0009).
Relationship between species richness (range-through) and latitude for various ecological guilds. The 1st column represents life mode (A1. Infauna, B1. Epifauna, C1. Other), the 2nd column represents attachment types (A2. Byssally attached, B2. Cemented, C2. Unattached) and the 3rd column represents feeding strategies (A3. Deposit feeders, B3. Suspension feeders, C3. Others). West coast is represented by open diamonds and east coast is represented by solid squares.

Species composition
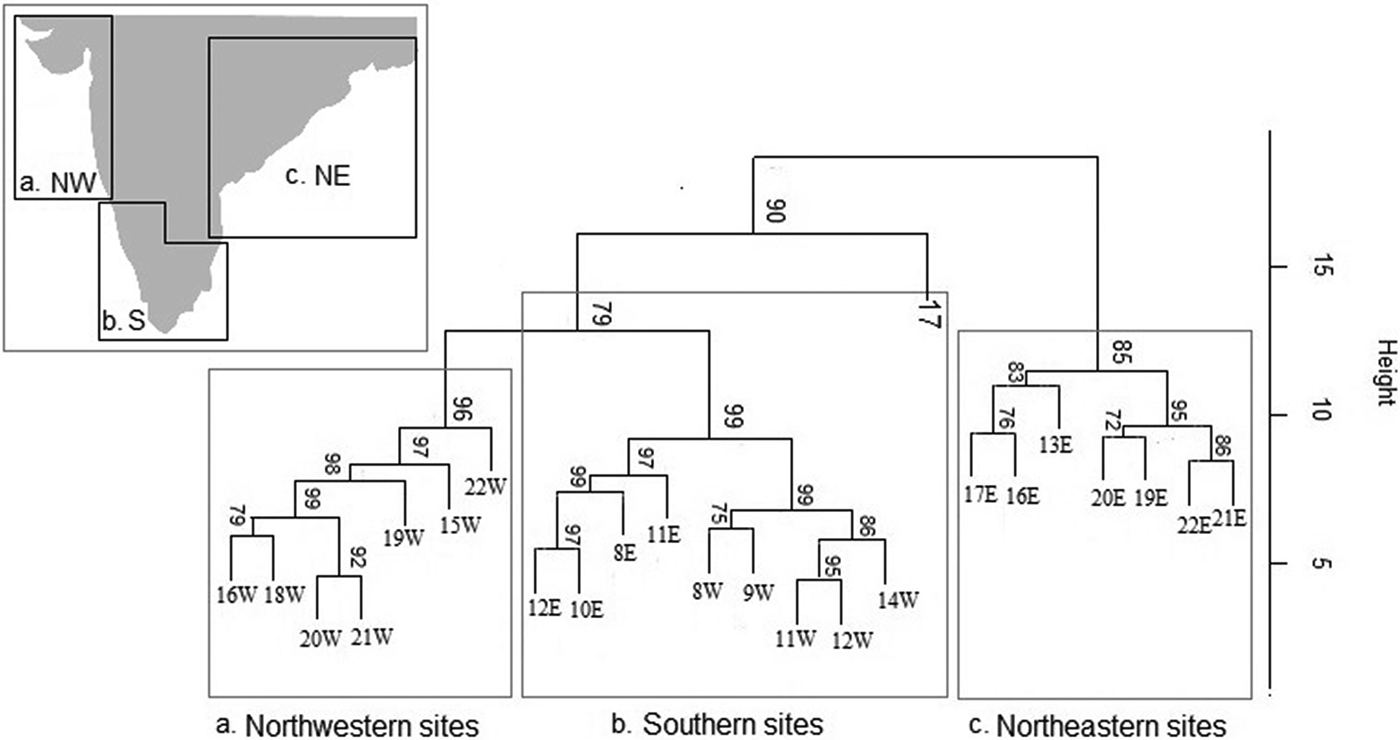
Cluster analysis separated the bins into three detectable clusters: (a) north-eastern bins (b) southern bins, and (c) north-western bins. The southern bins are closer to north-western bins; north-eastern bins appear separated from the remaining areas. There is also a clear separation between north-western and southern bins (bootstrap = 96% and 99% respectively) (Figure 8). The southern coastal bins have slightly higher species richness (~25 per bin) with dominance of species such as Aspidopholas tubigera and Anadara antiquata. The north-western bins show a high share of species such as Meretrix meretrix and Luzonia philippinensis. Some of the characteristic species in the cluster of the north-eastern bins are Donax scortum and Donax incarnatus. The clusters do not significantly differ in their share of any particular life mode, nature of attachment or feeding style.
Dendrogram constructed by UPGMA method using arithmetic averages, based on Sørensen matrices of presence/absence of 417 marine bivalve species from different coastal areas of India. The values at the base of the branches indicate the % bootstrap support (N = 10,000). The rectangles correspond to sub-regions along the Indian coast: a – north-western sites, b – southern sites, c – north-eastern sites.

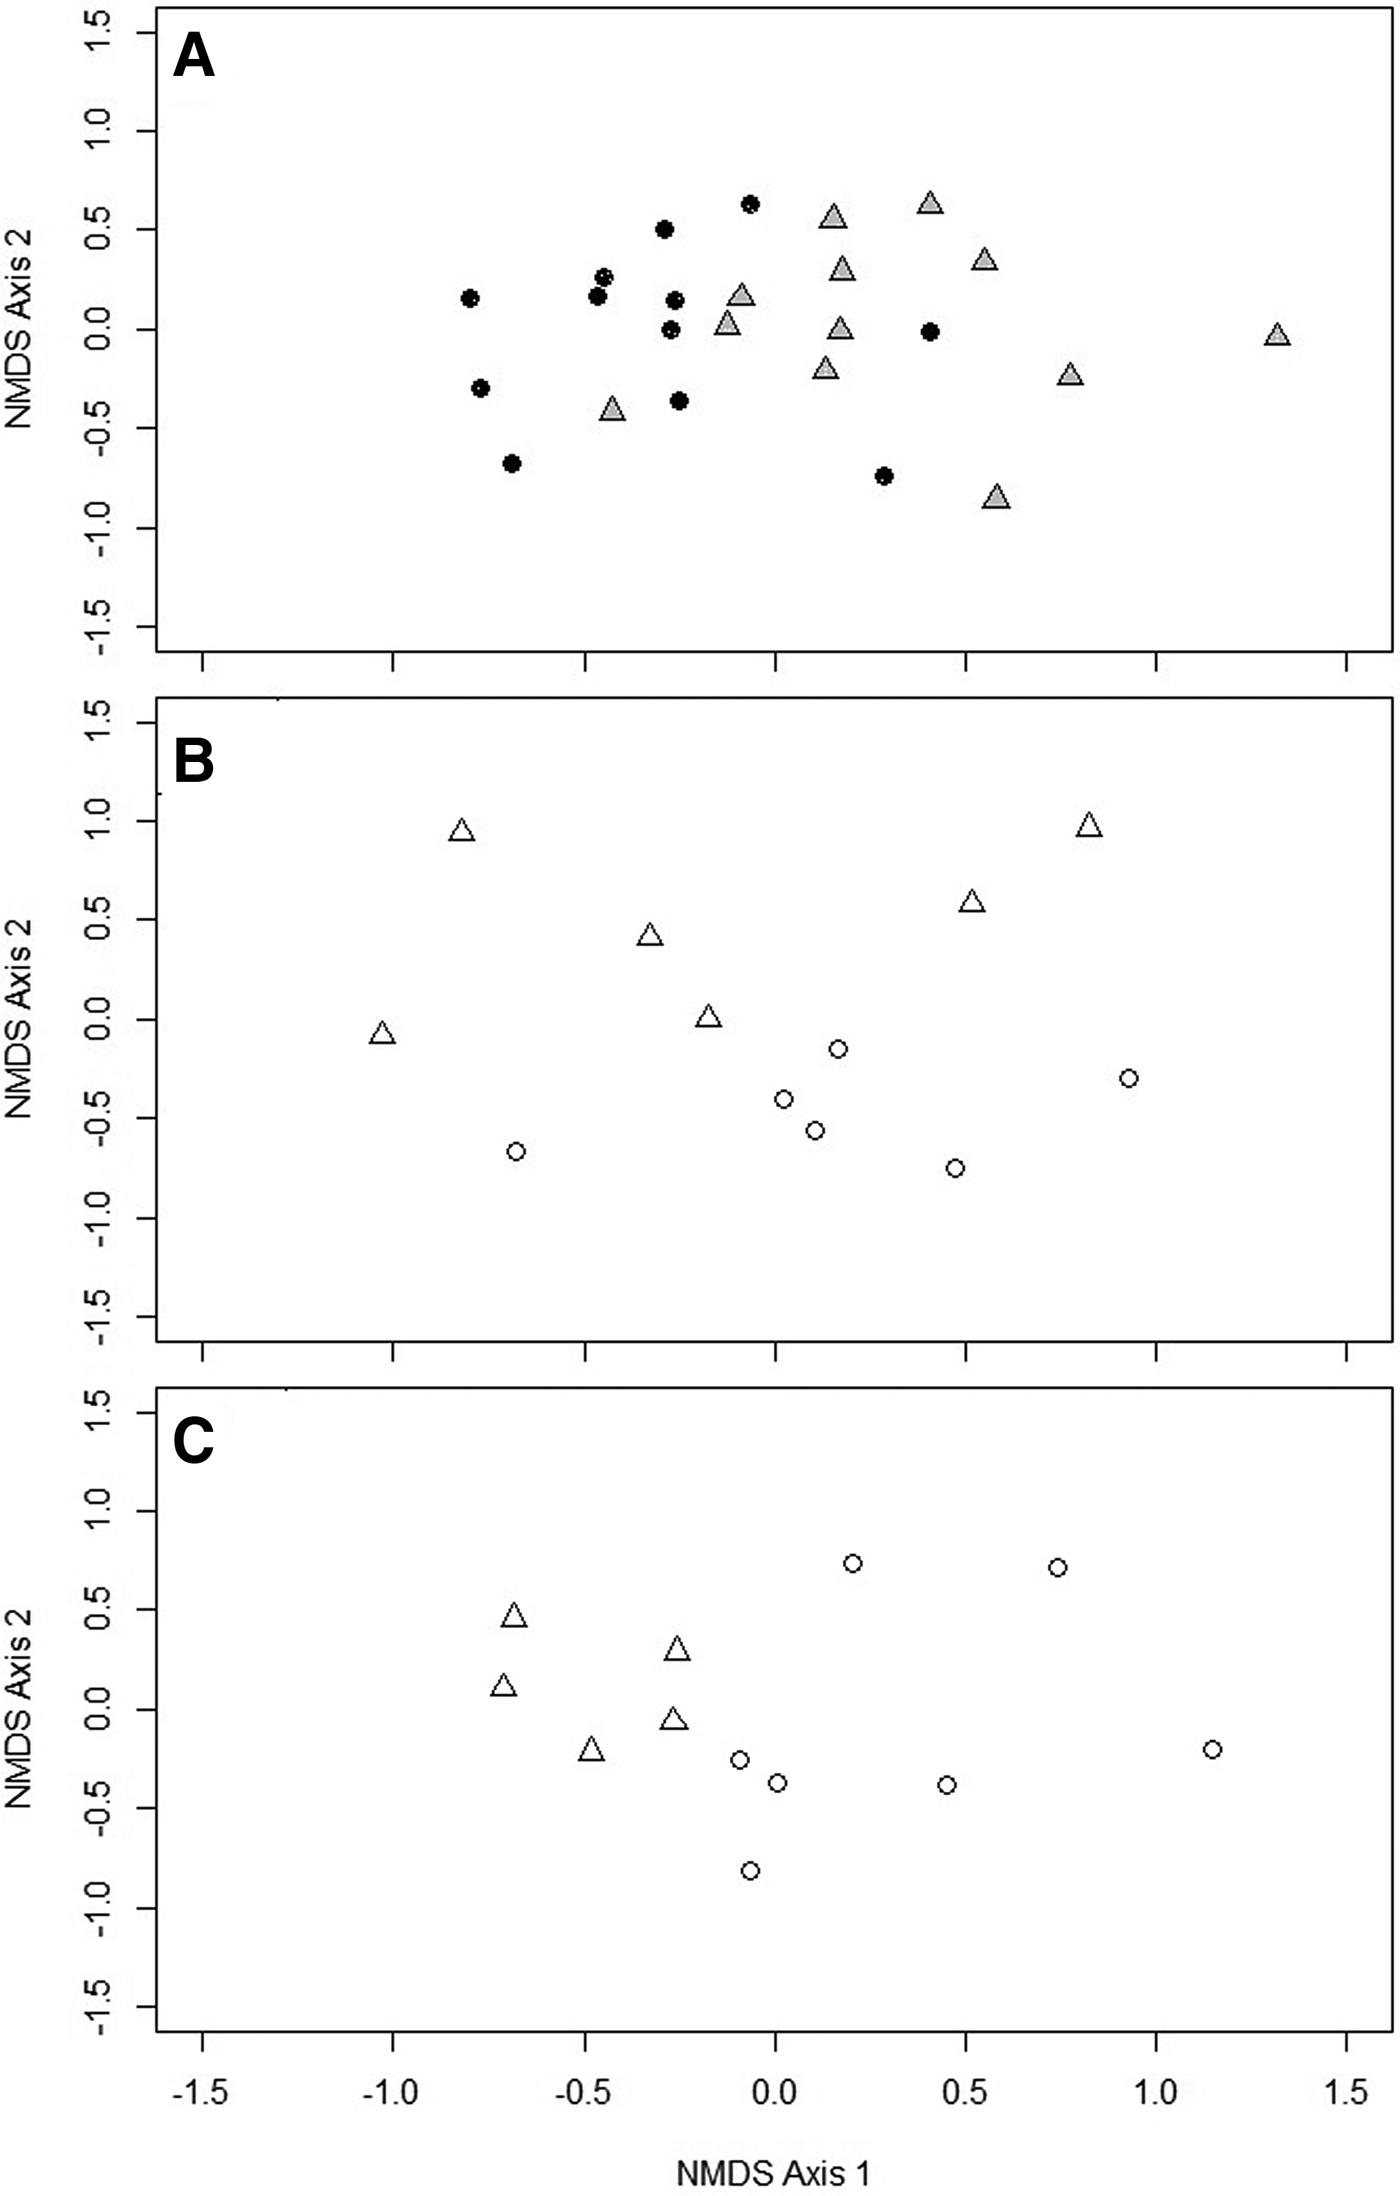
In NMDS plot (stress value = 0.19), we found a separation between east and west coastal sites with few overlaps (Figure 9A); southern sites are in the area of overlap. The NMDS plot for the west coast, however, shows a clear separation between northern sites (above 15°N) and southern sites (Figure 9C) in contrast to the east coast (Figure 9B).
Ordination in two dimensions performed using non-metric multidimensional scaling, using Sørensen similarity indices calculated from a presence/absence matrix of marine bivalve species at different latitudinal bins along the two coasts of India. (A) For all sites where the solid circles represent east coast and the solid triangles represent the west coast. (B) For east coast. (C) For west coast. The open circles represent the northern sites and the open triangles represent the southern sites.

Relationship between environment and species distribution
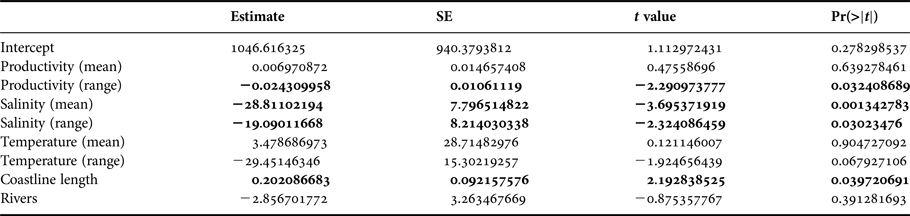
The relationship between species richness and environmental parameters as revealed by multiple GLM analysis shows salinity (mean and range), productivity (range) and coastline length to be significant predictors of species diversity (Table 3).
The results of multiple GLM on the relationship between species richness (range-through) and various environmental variables for latitudinal bins.

The significant results are in bold.
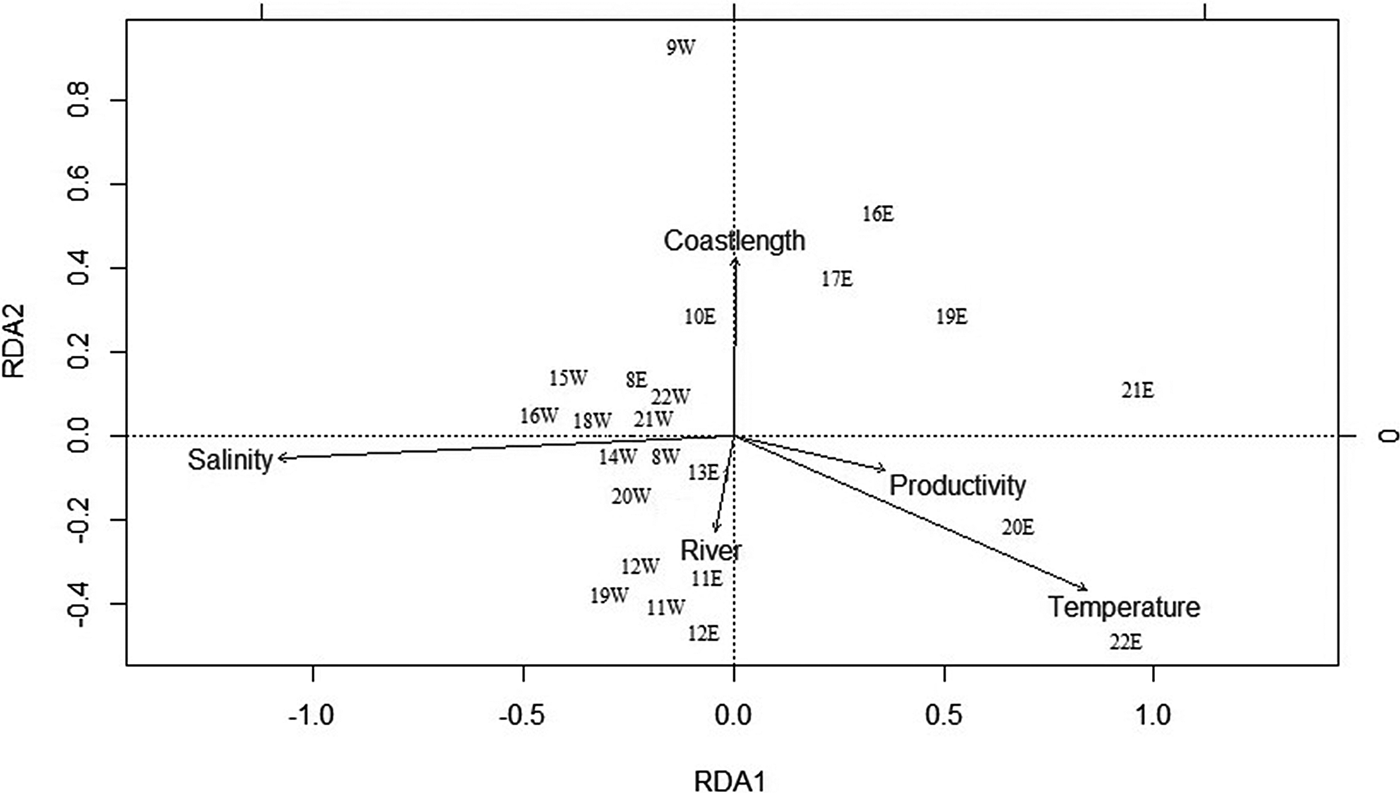
About 30% of the variation in distributions of presences and absences of bivalve species is explained by environmental variables using RDA on the Hellinger distance-transformed species data. A relatively high value of unconstrained variance (70%) is probably indicative of the limited explanatory power of the chosen environmental parameters for species composition. The first two axes are found to be significant in explaining the variation. Coastline length, salinity (mean), productivity (range), river and temperature (range) are found to be significant contributors (Adjusted R 2 = 0.11, Figure 10). With automatic forward selection, only salinity (mean) is selected as a significant predictor (Adjusted R 2 = 0.07, P = 0.02).
RDA biplot showing the relationship between environmental variables and the sites.

DISCUSSION
The diversity and composition of Indian marine bivalves have been studied previously at various local scales. Some studies reported bivalves from specific habitats such as coral reefs (Melvill, Reference Melvill1909; Hornell, Reference Hornell1922; Gravely, Reference Gravely1941; Ray, Reference Ray1949; Satyamurti, Reference Satyamurti1956; Ganapati & Nagabhushanam, Reference Ganapati and Nagabhushanam1958; Kundu, Reference Kundu1965; Appukuttan, Reference Appukuttan1972), mangroves (Morton, Reference Morton1984) and estuaries (Morton, Reference Morton1977; Appukuttan, Reference Appukuttan1996). A few studies focused on the economically important bivalve species and associated conservation efforts (Rao, Reference Rao1974; Kripa & Appukuttan, Reference Kripa, Appukuttan, Joseph and Jayaprakash2003). Various other studies reported overall diversity of organisms including bivalves from localities in the southern coast (Kurian, Reference Kurian and Costlow1971; Khan et al., Reference Khan, Manokaran, Lyla and Nazeer2010; Kundu et al., Reference Kundu, Mondal, Lyla and Khan2010; Manokaran et al., Reference Manokaran, Khan and Lyla2015), east coast (Ansari et al., Reference Ansari, Parulekar, Harkantra and Nair1977; Mahapatro et al., Reference Mahapatro, Panigrahy, Naik, Pati and Samal2011), and west coast (Parulekar, Reference Parulekar1973; Parulekar & Dwivedi, Reference Parulekar and Dwivedi1974; Parulekar & Wagh, Reference Parulekar and Wagh1975; Jayaraj et al., Reference Jayaraj, Jayalakshmi and Saraladevi2007). Such studies conducted at a local scale, although common, may be limited in their utility in explaining larger patterns. Witman et al. (Reference Witman, Etter and Smith2004) emphasized that diversity of local scale (spatial scale of metres to hundreds of metres) must be affected by regional-scale processes (spatial scale of 200 to thousands of kilometres) because local communities are an integral part of larger biogeographic regions and hence affected by mechanisms operating at a regional scale. Our study attempts to understand the regional pattern of bivalve diversity of the Indian coast instead of trends observed only locally or globally (LBG) and to evaluate the role of the regional environment as a predictor in shaping this pattern.
Regional controls of species richness
The two coasts of India, despite being located in the same latitudinal range, show a significant difference in species richness as demonstrated by our study. We recorded a high average regional diversity of bivalves in this region that is comparable to other tropical hotspots such as the Red Sea (Zuschin & Oliver, Reference Zuschin and Oliver2005); the richness in the east coast is higher than Red Sea richness whereas the west coast has a lower diversity. A similar pattern of coastal difference in diversity around India has been observed in a global compilation (Valentine & Jablonski, Reference Valentine and Jablonski2015) although slightly different values of species richness were reported. The average inter-coastal variation in species richness is twice the magnitude of intra-coastal variation (Figure 5). Such coastal differences in richness appear to relate well with the physiographic difference between these two Indian coasts. However, it is important to assess the underlying mechanism for generating coastal differences in species richness.
Productivity has often been used to explain the diversity of shallow marine fauna. Many suspension-feeding organisms are known to thrive under high productivity, and there is a strong positive correlation between eutrophication and bivalve diversity throughout the Indo-West Pacific tropical province (Vermeij, Reference Vermeij1990; Taylor, Reference Taylor, Ormond, Gage and Angel1997). It is also observed that a highly diverse benthic community is more likely to be supported by a stable primary production than a fluctuating production summing up to a higher value of annual productivity (Valentine & Jablonski, Reference Valentine and Jablonski2015). Hence seasonal fluctuation in productivity plays an important role in shaping the diversity profile. The inverse relationship between productivity and richness as shown by our GLM points to the fact that the highly productive Arabian sea borders the species-poor west coast; this inverse relationship probably indicates a strong seasonal influence along the Indian coast. Although the west coast has relatively low productivity during 5 months of the year (March to May, September to October), the productivity changes drastically with the onset of the summer monsoon (June–September). Influenced by the south-westerly winds, the surface waters move away from the coast and are replaced by colder, nutrient-rich and often oxygen-poor waters from the subsurface. This leads to a rapid increase in productivity (Madhupratap et al., Reference Madhupratap, Gopalakrishnan, Haridas and Nair2001). During winter (November–February), the cold continental air blowing towards the northern Arabian Sea causes cooling and hence the dense surface water sinks. This leads to a convective mixing resulting in a rise in productivity in the surface layer (Kumar & Prasad, Reference Kumar and Prasad1996; Madhupratap et al., Reference Madhupratap, Kumar, Bhattathiri, Kumar, Raghukumar, Nair and Ramaiah1996). The species-rich east coast bordered by the Bay of Bengal, on the contrary, is characterized by low but stable productivity. Although the riverine flux contributes nutrients to the Bay of Bengal, they are thought to be lost to the deep because of its narrow shelf (Qasim, Reference Qasim1977; Sengupta et al., Reference Sengupta, De Sousa and Joseph1977; Radhakrishna et al., Reference Radhakrishna, Bhattathiri and Devassy1978). Moreover, dominant cold core eddies and thermocline oscillations are observed during the summer monsoon in the Bay of Bengal and coastal region (Madhupratap et al., Reference Madhupratap, Mangesh, Ramaiah, Kumar, Muraleedharan, De Sousa, Sardessai and Muraleedharan2003). These oscillations are capped by a prevalent low saline upper regime which prevented nutrients from surfacing in spite of the river plumes. Consequently, the primary productivity range (3.0–8.7 g C m−2 day−1) from the inshore waters of the east coast during monsoon (Nair et al., Reference Nair, Samuel, Joseph and Balachandran1973) is significantly lower than the productivity range (44–280 g C m−2 day−1) reported from the west coast (Bhattathiri et al., Reference Bhattathiri, Pant, Sawant, Gauns, Matondkar and Mohanraju1996); this also points to a more stable productivity profile of the east coast that can support high benthic diversity in comparison to highly fluctuating values of west coast productivity.
The influence of a river, although intuitive, is difficult to evaluate in our study since we could not distinguish between rivers with different sediment output. This could explain the apparent insignificant contribution of rivers in explaining species richness. River input, however, could be estimated from salinity which is heavily influenced by the large rivers. The east coast is characterized by an extremely high river input, hence low salinity; this influenced our GLM result, which demonstrated a negative correlation between salinity and species richness. Several studies have shown that an increase in salinity causes a decrease in trend of biological diversity for microbial organisms (Casamayor et al., Reference Casamayor, Calderon and Pedros2000; Jungblut et al., Reference Jungblut, Hawes, Mountfort, Hitzfeld, Dietrich, Burns and Neilan2005; Rothrock & Garcia-Pichel, Reference Rothrock and Garcia-Pichel2005; Abed et al., Reference Abed, Kohls and Beer2007). This is also true for molluscs who have well-defined relationships between species distributions and physicochemical variables such as salinity (Montagna & Kalke, Reference Montagna and Kalke1995). A similar pattern of inverse relationship between species richness and salinity (and productivity) range has been observed for global distribution and has been linked to low seasonality and species richness (Valentine & Jablonski, Reference Valentine and Jablonski2015).
The positive correlation between species richness and coastline length, as supported by our GLM result, is a trend that has also been universally observed in space and time. Such a positive relationship is used to explain global marine biodiversity increases during geological times of continental breakup (Peters, Reference Peters2005). Coastline length has also been found to be an important predictor for Recent biodiversity of diverse marine groups globally (Tittensor et al., 2010). Such dependence is attributed to the higher availability of important habitat features in a longer coastline that is expected to influence positively both abundance and richness of coastal species (Rosenzweig, Reference Rosenzweig1995). Recent studies on marine diversity, including the present one, demonstrate that the same is operational even at a regional scale (Sivadas & Ingole, Reference Sivadas and Ingole2016).
Another important regional parameter, imparting a probable control over the species richness, might be the location of the nearest biodiversity hotspot. Crame (Reference Crame2000a, Reference Crameb) has documented the presence of a bivalve biodiversity hotspot near the Indonesian archipelago and claimed that species are radiating from there. He put this as a mechanism to explain the clines of species richness decreasing radially from this area in a north-south latitudinal pattern and east-west longitudinal pattern. The east coast is more likely to be influenced by this hotspot due to geographic proximity. The west coast, on the other hand, is relatively near to high diversity areas such as the Red Sea but is not expected to show as high an influence as the east coast due to two factors. The first one is the fact that the Bay of Bengal is partially connected to the Pacific Ocean through Australasian seaways and hence contributes to physical, chemical and biological exchanges (Madhupratap et al., Reference Madhupratap, Mangesh, Ramaiah, Kumar, Muraleedharan, De Sousa, Sardessai and Muraleedharan2003). The Arabian Sea has a relatively closed circulation with limited exchange. The second reason is the difference between the size of species pool that each hotspot is hosting. The West Pacific is a much larger species pool compared with the western Indian Ocean (Jablonski et al., Reference Jablonski, Huang, Roy and Valentine2017). A greater biological exchange of the Bay of Bengal with one of the largest species pools of the West Pacific is expected to result in a non-uniform increase in species richness of the east coast compared with the west coast. Another factor that may have contributed to the low species-richness of the west coast is the influence of an oxygen minimum zone (OMZ) in the Arabian Sea (Naqvi, Reference Naqvi1987; Cook et al., Reference Cook, Lambshead, Hawkins, Mitchell and Levin2000; Levin et al., Reference Levin, Gage, Martin and Lamont2000; Stramma et al., Reference Stramma, Johnson, Sprintall and Mohrholz2008). In explaining a relatively low marine benthic diversity (primarily polychaete-bivalve assemblage) of coastal locations from the Arabian Sea in comparison to those from Bay of Bengal, Sanders (Reference Sanders1968) identified the low-oxygen minimum layer that exists throughout the northern Arabian Sea at 100 to 200-m depth as the causal factor. This oxygen-depleted water is pushed towards the continental shelf in the west of India and may create a severely stressed condition for the bottom fauna (Nigam et al., Reference Nigam, Mazumdar, Henriques and Saraswat2007). It is important to note that an OMZ is less likely to affect benthos of very shallow depth (<100 m) such as the one of the present study and hence probably is not appropriate to explain intra-coast variation in species richness. This might probably explain why do we see higher species richness in the northern west coast where the intensity of the OMZ is high (Slater & Kroopnick, Reference Slater, Kroopnick, Haq and Milliman1984). However, the overall influence of a shallow OMZ is quite strong on west coast fauna (Levin, Reference Levin2003). Both of these factors, a positive influence of South Asian biodiversity hotspot on east coast species richness and a negative impact of oxygen-depleted conditions of the Arabian Sea on west coast fauna, may have significant contribution in developing the coastal variation in species richness.
Controls of compositional variation
Regional environmental parameters cannot explain the species association satisfactorily. The major canonical axes of species variation from the RDA correlated with salinity primarily in our data set. However, because of the high contribution of unconstrained variance, the model has limited exploratory power.
The species composition within each coast tends to vary and they do not follow any gradient. We identified three distinct eco-regions along the Indian coast with characteristic species composition corresponding to unique physiography and productivity mechanism of the regions, namely the north-western, southern and north-eastern eco-regions. These eco-regions based on bivalve composition have not been established before and differ from globally established ecoregions (Spalding et al., Reference Spalding, Fox, Gerald, Davidson, Ferdaña and Finlayson2007).
Compositionally the north-eastern and north-western regions are different from the southern region as revealed by the cluster analysis. The southern eco-region shows a characteristic fauna dominated by borers such as Aspidopholas tubigera while north-western and north-eastern regions are dominated by species such as Meretrix meretrix and various species of Donax respectively. Such compositional difference is most likely to be developed because of the distinct physiographic characters of these three regions. The north-eastern region is characterized by high siliciclastic input from large rivers and variable salinity while the north-western region is characterized by low siliciclastic input, high salinity and large shelf area. The average sediment input in the north-eastern region is in the order of 1.4 × 10⁹ t and has a significant proportion of suspended sediment load (Subramanian, Reference Subramanian1996; Ganesh & Raman, Reference Ganesh and Raman2007). The north-western region receives an order of magnitude less than that of the east coast and has a latitudinal variation in sediment grain size (Jayaraj et al., Reference Jayaraj, Jayalakshmi and Saraladevi2007). The separation between northern and southern bins could also be an indirect result of distinct oceanographic features. It has already been established that the southern area is distinctly different from the northern Arabian Sea and Bay of Bengal in terms of chlorophyll concentration, productivity and shelf area (Calvert et al., Reference Calvert, Pedersen, Naidu and Von Stackelberg1995; Dey & Singh, Reference Dey and Singh2003; Ganesh & Raman, Reference Ganesh and Raman2007). Moreover, the global distribution of coral reefs clearly shows a continuous presence of reef build up in the southern region from Kollam (8°N) extending up to Rameshwaram (9°N) (UNEP-WCMC, 2010). Reefs are known to facilitate diversity of a region and hence this explains the higher average species richness in the southern eco-region. The reefs also explain the dominance of borers in this region that thrive on hard substrate provided by the reef structure.
The separation in species associations along the west coast as revealed by NMDS, coincides with the 15°N latitude. Such compositional difference is also observed for fishes where planktivores dominate below 15°N and carnivores are more abundant above it (Madhupratap et al., Reference Madhupratap, Gopalakrishnan, Haridas and Nair2001). The 15°N barrier separates the productivity mechanism of the Arabian Sea. Seasonally higher productivity in the eastern Arabian Sea is mainly through upwelling during summer and cooling during winter. The summer upwelling has impact up to about 15°N along the southern coast, whereas the winter cooling is restricted to north of 15°N (Madhupratap et al., Reference Madhupratap, Gopalakrishnan, Haridas and Nair2001).
Latitudinal variation
One of the most important biodiversity patterns recognized globally is the latitudinal biodiversity gradient (LBG) (Roy et al., Reference Roy, Jablonski, Valentine and Rosenberg1998; Reference Roy, Jablonski and Valentine2000; Jablonski et al., Reference Jablonski, Roy and Valentine2006; Roy & Goldberg Reference Roy and Goldberg2007). The LBG is the observed monotonic decrease in species richness from equator to pole for terrestrial (Lawton et al., Reference Lawton, Bignell, Bolton, Bloemers, Eggleton, Hammond, Hodda, Holt, Larsenk, Mawdsley, Stork, Srivastava and Watt1998; Gaston, Reference Gaston2000; Weir & Schluter, Reference Weir and Schluter2007) as well as marine organisms (Roy et al., Reference Roy, Jablonski and Valentine1994, Reference Roy, Jablonski, Valentine and Rosenberg1998). However, the extent of such a gradient within a limited regional scale, especially in the species-rich tropics, remains unknown (Jablonski, Reference Jablonski1993; Roy et al., Reference Roy, Jablonski and Valentine1994, Reference Roy, Jablonski, Valentine and Rosenberg1998; Coates, Reference Coates1998; Kendall & Aschan, Reference Kendall and Aschan1993; Roy & Goldberg Reference Roy and Goldberg2007). In a detailed review on issues of Recent marine diversity, Gray (Reference Gray2001) cautioned against accepting the established trend based on data from North America as other continents with different geological history may result in a different trend. Therefore, it is pertinent to assess the nature of an established biogeographic pattern in an intra-tropical setting outside North America.
Our study of the variation in bivalve biodiversity did not find any consistent pattern of latitudinal variation within the 15° latitudinal span; while the east coast did not show any gradient, the gradient observed in the west coast is opposite to that of the predicted pattern by LBG. Such a non-conformity with LBG is not unusual (Kendall & Aschan, Reference Kendall and Aschan1993; Poore & Wilson, Reference Poore and Wilson1993; Valdovinos et al., Reference Valdovinos, Navarrete and Marquet2003). Often specific taxa show a deviation from the standard LBG (Hillebrand, Reference Hillebrand2004; Stevens, Reference Stevens2006). Krug et al. (Reference Krug, Jablonski and Valentine2007) emphasized the importance of specific families in providing insights into the general pattern of diversity dynamics. However, none of the dominant families in our data set showed any clear pattern for either of the coasts that supports or refutes the LBG. In order to rule out any bias introduced by a specific ecological group, we evaluated the gradient for individual ecological groups; this does not show any significant gradient either. It is clear, therefore, that the variation in species richness along Indian coast does not follow a global pattern such as the LBG. The consistent latitudinal decline in species richness along the west coast, however, is a unique feature of this area. The distinction from west to east is difficult to explain but could be attributed to couple of factors such as homogeneity of the coastal environment along the west coast in contrast to the east coast that is fragmented by multiple rivers creating habitat heterogeneity along the coast.
Issues with scale and sampling
It is important to note that global diversity patterns such as the LBG could be scale-dependent and larger-scale studies are expected to yield clearer patterns than studies on a smaller spatial scale. Hillebrand (Reference Hillebrand2004), for example, predicted that gradients on regional scales are expected to be significantly stronger and steeper than on local scales. The observed lack of clear pattern in gradient could, therefore, be due to the limited spatial scale of our study.
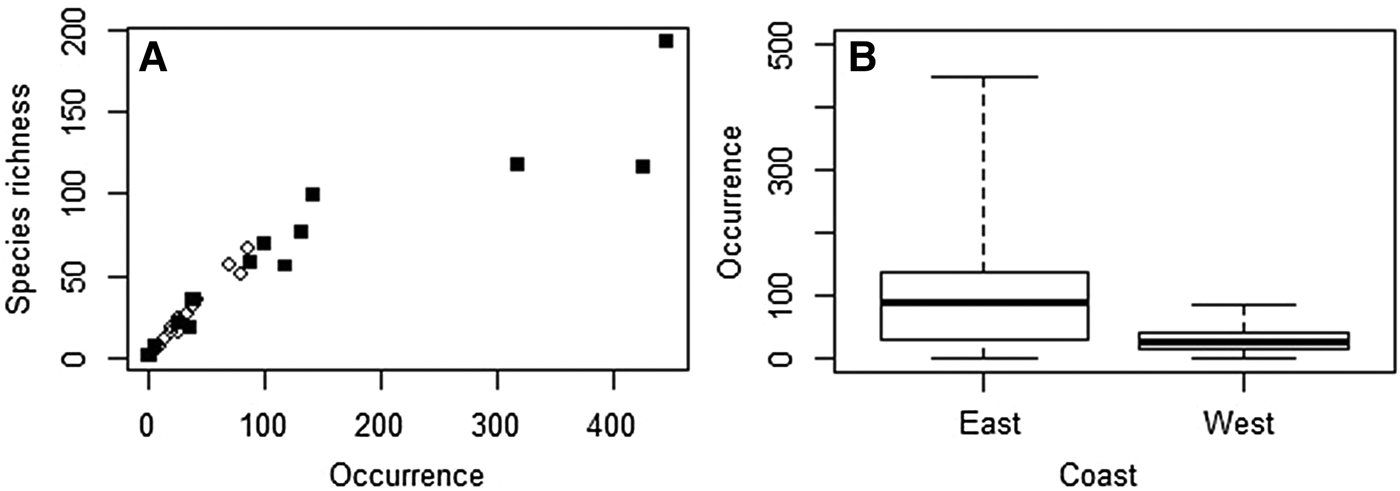
Our data might also have inherent issues regarding sampling. A strong positive correlation between occurrence vs species richness at different latitudinal bins and difference in overall occurrence between the two coasts (Figure 11) points to the existence of such issue. A significantly high species occurrence from the east coast in comparison to the west coast also makes it difficult to understand the true difference in species diversity between the two. However, corrective measures, such as rarefaction and range-through conversion, do not change the results significantly. Moreover, the difference between the diversity from observed occurrences vs range-through occurrences (Figure 5) suggests that the east coast is more unevenly sampled than the west coast. These observations lead us to believe that the data are most likely showing a true biological signal. The only way to resolve this debate calls for a controlled exhaustive physical sampling and subsequent analysis which we are planning to do in future.
(A) Relationship between species richness and occurrence from various latitudinal bins. West coast is represented by open diamonds and east coast is represented by solid squares. (B) Relationship between occurrence and coast. The boxes are defined by 25th and 75th quantiles; thick line represents median value.

CONCLUSION
Gray (Reference Gray2001) mentioned the urgent need to study biodiversity in coastal systems on local and regional scales to evaluate the validity of general ecological patterns. Such studies are particularly rare in tropical areas. The present study attempts to fill the gap.
The present study demonstrates that the species richness of Recent marine bivalves within the tropics is largely governed by regional conditions. The east coast has a significantly higher species richness compared with the west coast. A combination of factors, such as higher coastal length, stable productivity and greater degree of biological exchange with the South Asian biodiversity hotspot may have created the higher species richness in the east coast. The lower richness of the west coast may have been caused by factors such as fluctuation in productivity, a lower degree of biological exchange with the neighbouring biological hotspot and a negative impact of oxygen-depleted conditions of the Arabian Sea. Species composition, instead of showing strict coastal affinity, reveals three distinct (north-eastern, north-western and southern) eco-regions. These regions largely correspond to regional character (such as river activity, salinity, presence of reef, circulation patterns). The details of the pattern may still be difficult to capture from these data with dissimilar occurrence; a detailed abundance data from controlled sampling and of higher resolution is needed to understand the finer pattern.
ACKNOWLEDGEMENTS
D.C. would like to thank Dr S. Prasanna Kumar, NIO for discussion on oceanographic aspects. Comments from Martin Zuschin and Adam Tomašových on an earlier version of the draft greatly improved the manuscript. We are grateful to two anonymous reviewers for their in-depth review and suggestions.
FINANCIAL SUPPORT
This project was funded by Academic Research Fund of IISER Kolkata (ARF 2013-14). D.S. and M.B. are supported by the doctoral fellowship and PBIP fellowship of IISER Kolkata, respectively.