INTRODUCTION AND BACKGROUND
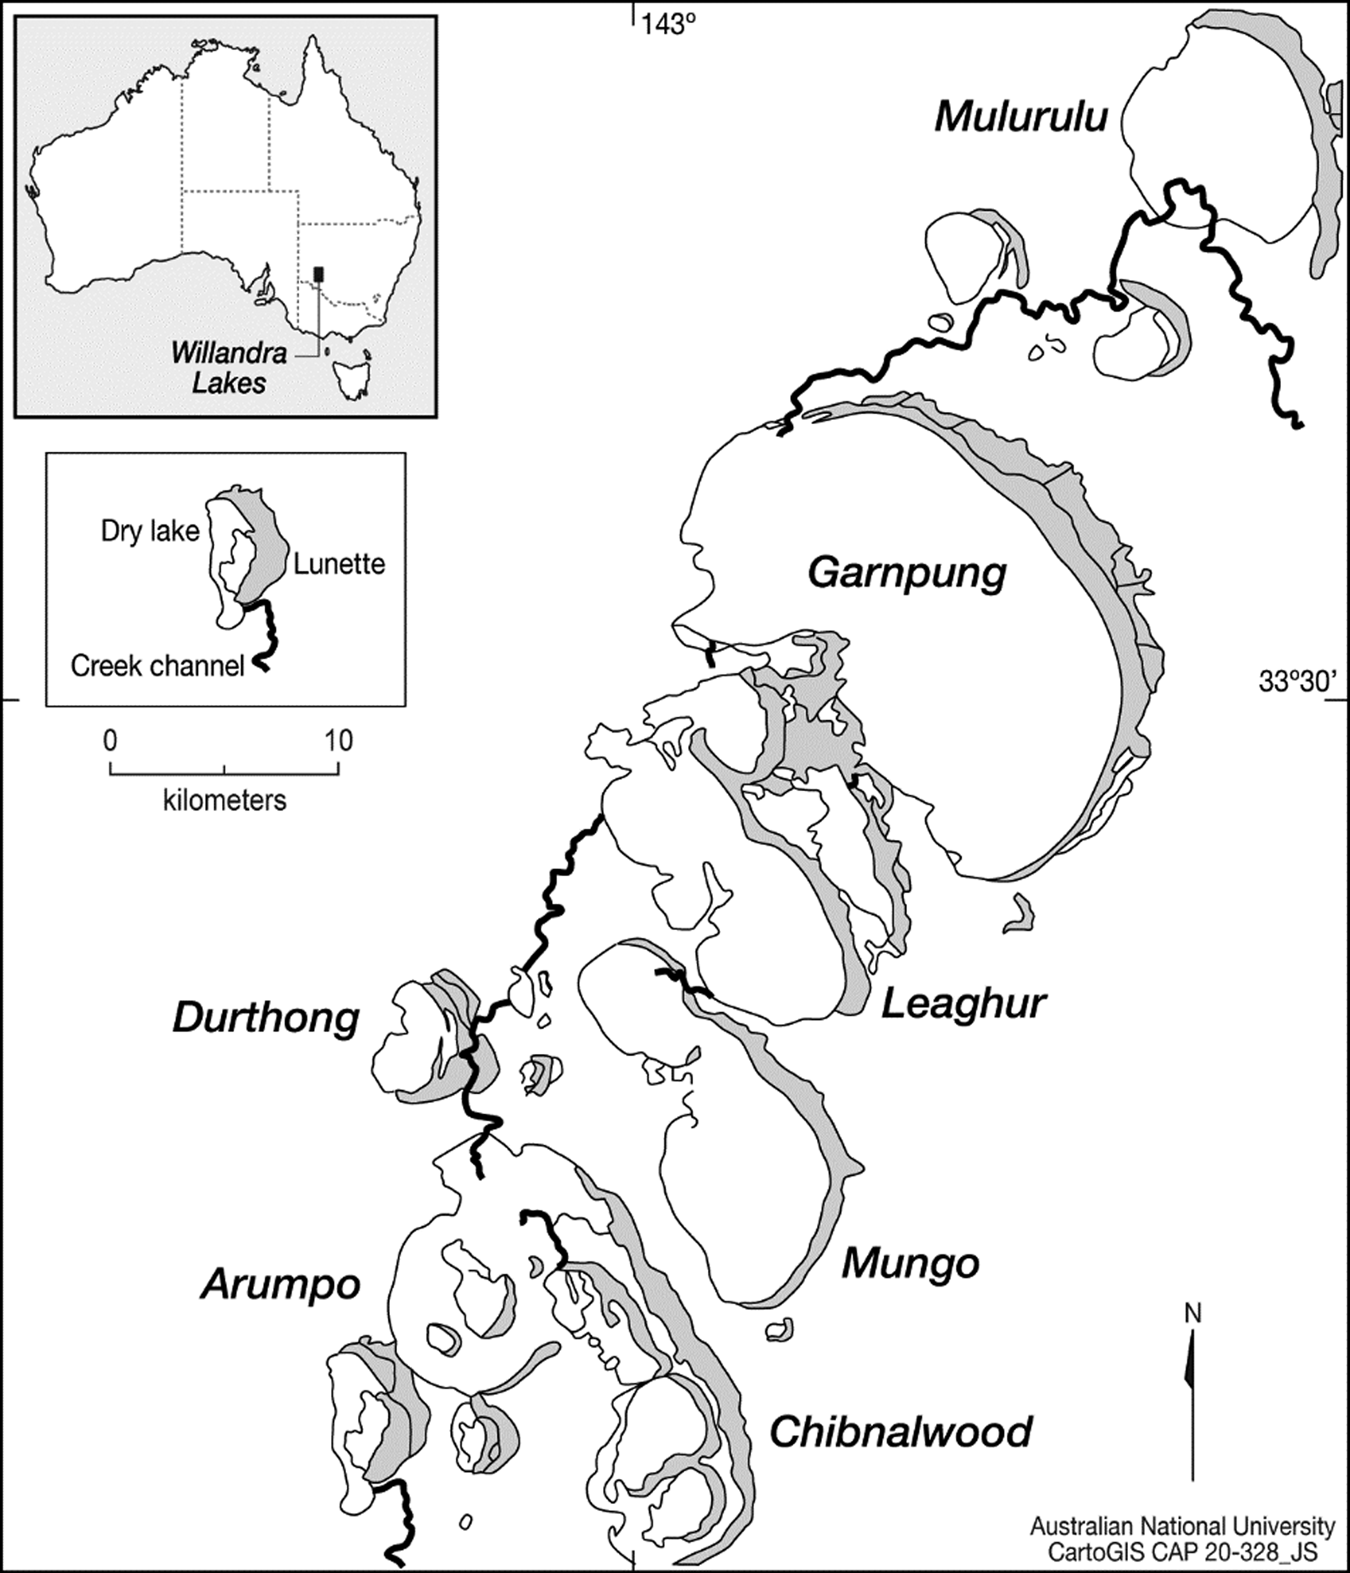
Lake Mungo is one of a series of now-dry lake basins that make up the Willandra Lakes UNESCO World Heritage Site in arid southeastern Australia (Fig. 1). It is one of the earliest archaeological sites in the country and has the oldest human cremation and ritual ochre burial in the world (Mungo I and III), dated to 41 ± 4 ka (Bowler et al., Reference Bowler, Johnston, Olley, Prescott, Roberts, Shawcross and Spooner2003; Olley et al., Reference Olley, Roberts, Yoshida and Bowler2006). A key feature of Lake Mungo is the lakeside sand and clay dunes (lunettes), which preserve a sedimentary record of alternating wet and dry conditions over the past 100 ka (Bowler, Reference Bowler1998; Bowler et al., Reference Bowler, Gillespie, Johnston, Boljkovac, Bolijkovac, Haberle and David2012; Fitzsimmons et al., Reference Fitzsimmons, Stern and Murray-Wallace2014; Jankowski et al., Reference Jankowski, Stern, Lachlan and Jacobs2020). As these lunettes formed, they covered archaeological material, preserving a record of past life and environments. The relationship between periods of human occupation and palaeoenvironmental changes has been a major research theme in the area, with initial studies predominantly concentrating on the stratigraphy and archaeology preserved at the southern tip of the Mungo lunette (Bowler et al., Reference Bowler, Jones, Allen and Thorne1970; Bowler, Reference Bowler1998). More recent work, conducted as part of the ongoing Mungo Archaeology Project (MAP), has focused on the central lunette area, where widespread erosion has uncovered an array of stratigraphic units and archaeological features (Fitzsimmons et al., Reference Fitzsimmons, Stern and Murray-Wallace2014; Stern, Reference Stern, McGrath and Jebb2015; Barrows et al., Reference Barrows, Fitzsimmons, Mills, Tumney, Pappin and Stern2020; Jankowski et al., Reference Jankowski, Stern, Lachlan and Jacobs2020). Among these archaeological traces are thousands of fish otoliths that, when found in hearth sites (cooking fireplaces), provide an opportunity to link conditions in the lake directly with an Aboriginal presence on the lakeshore.
Map of the northern part of the Willandra Lakes system showing, among others, Mulurulu, Garnpung, Leaghur, and Mungo, which are the main lakes used in the model (adapted from Bowler Reference Bowler1998).

Otoliths grow in the inner ears of bony fish through the incremental deposition of calcium carbonate (aragonite) in periodic, usually annual, rings (Campana, Reference Campana1999). The oxygen isotope (δ18O) composition of fish otoliths is controlled by the temperature and δ18O of the water in which the fish lived. The δ notation used here represents the ratio of 18O to 16O relative to that in a standard material, Vienna Pee Dee Belemnite for carbonates (otoliths) and Vienna Standard Mean Ocean Water for water. If the ambient water δ18O remains constant, a change of 1‰ in otolith δ18O values would reflect a ~4°C change in water temperature (Kalish, Reference Kalish1991). In marine settings, where water oxygen isotopes are fairly stable over time, seasonal temperature changes can be detected in the otolith and other biogenic carbonate oxygen isotopes (Weidman and Millner, Reference Weidman and Millner2000; Andrus et al., Reference Andrus, Crowe, Sandweiss, Reitz and Romanek2002; Mannino et al., Reference Mannino, Thomas, Leng and Sloane2008; Geffen et al., Reference Geffen, Høie, Folkvord, Hufthammer, Andersson, Ninnemann, Pedersen and Nedreaas2011). At freshwater sites, the δ18O of ambient water is variable, changing with precipitation, flooding, and evaporation. These water composition changes tend to dominate the δ18O record of otoliths and other carbonate remains in these environments (Leng and Marshall, Reference Leng and Marshall2004; Leng and Lewis, Reference Leng and Lewis2014; Dufour et al., Reference Dufour, Van Neer, Vermeersch and Patterson2018; Long et al., Reference Long, Wood, Williams, Kalish, Shawcross, Stern and Grün2018). Therefore, consideration of the hydrological controls inherent within the system as a whole is crucial for the correct interpretation of the geochemical traces preserved in otoliths.
Some have described the Willandra Lakes region as so lacking in surface water and so windy and dusty that it was uninhabited during the last glacial maximum (LGM), which spanned roughly 24,000–19,000 cal yr BP (e.g., Allen and Holdaway, Reference Allen and Holdaway2009). However, the alternating sands and clays of the Lake Mungo lunette that formed during the LGM suggest that lake levels varied between wet periods following floods and periods of drying that exposed at least part of the lake floor (Bowler et al., Reference Bowler, Gillespie, Johnston, Boljkovac, Bolijkovac, Haberle and David2012; Fitzsimmons et al., Reference Fitzsimmons, Stern and Murray-Wallace2014; Stern, Reference Stern, McGrath and Jebb2015). Likewise, the abundance of stone tools, hearth sites, and other archaeological materials found in the LGM-aged dunes indicate at least periodic human presence (Stern et al., Reference Stern, Tumney, Kajewski, Frankel, Webb and Lawrence2013; Fitzsimmons et al., Reference Fitzsimmons, Stern and Murray-Wallace2014; Stern, Reference Stern, McGrath and Jebb2015). The question is whether human occupation on the lakeshore coincided with periods of low lake level, wetter phases, or both? Was the lake stable or periodically drying out completely and then refilled by floodwater, and how do these changes track with an Aboriginal presence on the lakeshore? Interactions between climate change, lake hydrology, and Aboriginal peoples remain difficult to disentangle from current evidence. The issue is complicated by the mismatch between the millennial time spans represented by the sedimentary hydrological record and the subdecadal evidence represented by each archaeological site, some of which are the remains of a single meal. MAP is continuing to conduct rigorous and systematic recording, dating, and assessing of archaeological remains and their associated sediments in partnership with the three traditional tribal groups of the Willandra Lakes region: Paakantyi/Barkandji, Ngiyampaa, and Mutthi Mutthi. As part of MAP, otoliths recovered from Aboriginal hearth sites offer an opportunity to examine water conditions at Lake Mungo during the LGM in greater detail and on timescales commensurate with human lives.
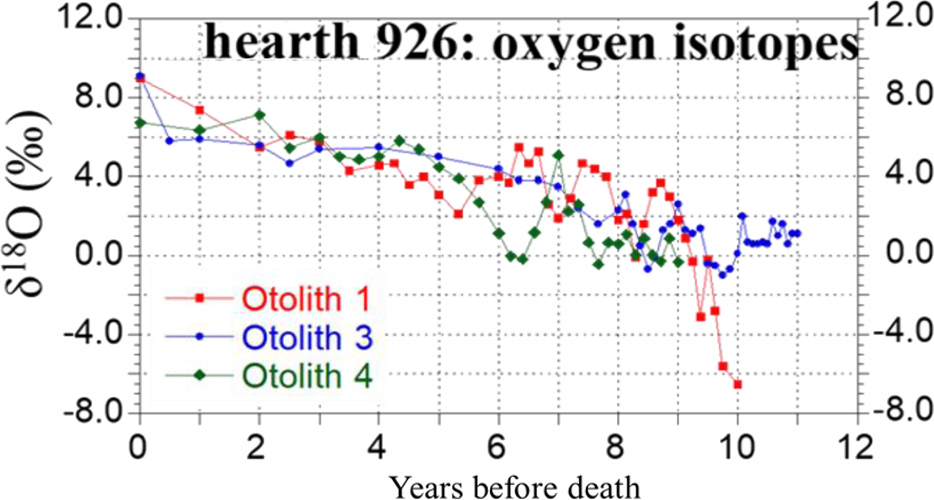
In a previous study (Long et al., Reference Long, Stern, Williams, Kinsley, Wood, Sporcic and Smith2014), oxygen isotopes and trace elements were analysed across the age increments of fish otoliths recovered from a series of Aboriginal hearth sites at Lake Mungo dating to the LGM (19,490–19,330 and 19,420–19,220 cal yr BP at 95.4% probability). The hearth otoliths all showed an increasing trend in both Sr/Ca ratios and oxygen isotopes (Fig. 2). Increases in Sr/Ca ratios are typically linked with fish movements to regions of high salinity (Zimmerman, Reference Zimmerman2005; Kerr et al., Reference Kerr, Secor and Kraus2007; Macdonald and Crook, Reference Macdonald and Crook2010). Moreover, preferential 16O removal during evaporation causes water δ18O to increase (Washburn and Urey, Reference Washburn and Urey1932; Craig et al., Reference Craig, Gordon and Horibe1963), which would be recorded in the fish otoliths. The results, therefore, seemed to support the “easy prey” hypothesis proposed by Bowler (Reference Bowler1998), whereby the fish entered into Lake Mungo with, or after, a flood and subsequently became trapped by evaporative conditions that cut off the lake from the rest of the Willandra system. It was then hypothesized that the trapped fish were targeted by human occupants, who took advantage of an assumed high-salinity-induced supine state of the fish, to “scoop [them] up in shallow waters” (Bowler, Reference Bowler1998, p. 148). Other LGM records also suggest that it was a cooler, drier, and dustier period in Australia (McTainsh and Lynch, Reference McTainsh and Lynch1996; Hesse et al., Reference Hesse, Magee and van der Kaars2004; Barrows et al., Reference Barrows, Juggins, De Deckker, Calvo and Pelejero2007; Reeves et al., Reference Reeves, Barrows, Cohen, Kiem, Bostock, Fitzsimmons and Jansen2013). In combination, these factors and the otolith records were interpreted as evidence for strong evaporation, increasing salinity, and a drop in water levels at Lake Mungo (Long et al., Reference Long, Stern, Williams, Kinsley, Wood, Sporcic and Smith2014). However, this interpretation did not take into account mass balance effects, which could shed light on the relative roles of water inflow and evaporation on changes in the isotopic composition of the water and hence the otoliths.
(color online) The oxygen isotope values plotted against otolith age lines as years before death for each of the otoliths collected from hearth 926 (adapted from Long et al., Reference Long, Stern, Williams, Kinsley, Wood, Sporcic and Smith2014). Adult life is on the left side of the x-axis and juvenile stage is on the right side of the x-axis.

Isotopic mass balance models provide a theoretical framework to simulate and quantitatively interpret isotopic signals in lakes (Gibson et al., Reference Gibson, Birks and Yi2016). Under constant forcing, a closed lake will eventually reach a steady state in its mass balance if the volumes of water lost via evaporation and inflowing water are equal. Yet, volumetric mass balance does not equate to isotopic mass balance because this also depends on the mean isotope (δ) values of evaporating and inflowing water fluxes (FE and Fin, respectively), following the generalised form δL = (VLδL + Finδp + FEδE) / (VL + Fin + FE), where δE is a function of δL via isotopic fractionation (e.g., Dinçer, Reference Dinçer1968; Gonfiantini, Reference Gonfiantini, Fritz and Fontes1986; Gibson et al., Reference Gibson, Edwards and Prowse1996; Gibson and Edwards, Reference Gibson and Edwards2002; Jones et al., Reference Jones, Leng, Roberts, Türkeş and Moyeed2005; Rohling, Reference Rohling2016; Lacey and Jones, Reference Lacey and Jones2018). These studies used models that combine mass balance and isotopic mass balance to quantitatively assess the relative influence of different parameters on the isotopic composition of the water and can provide updated interpretations of archaeological and sediment records. For example, coupled isotope and mass balance models for Lake Ohrid, one of the oldest and deepest lakes in Europe, suggest that precipitation was up to 26% higher during the early Holocene than in the present day and 44% lower during the LGM (Lacey and Jones, Reference Lacey and Jones2018). The application of such models was also able to show that even though rainfall was much lower during the LGM, it was still high enough over the lake to support arboreal vegetation and provide a refugium for people during this time (Lacey and Jones, Reference Lacey and Jones2018).
In another example, this time focused on drought interpretations from sediment records, Rohling (Reference Rohling2016) used mass balance models to test the assumption that if a lake isotope record suggested regional drying, it indicated a period of poor crop yields for nearby farmers. The study demonstrated that crop-growing potential could actually be improving while the lake records (usually inferred from oxygen isotope ratios) suggest that water levels were dropping. This study highlights the need to consider the different hydrological fluxes, catchments, and surface areas relevant to lakes vs. fields when inferring drought events from sedimentary lake records. Quantitative modelling of lake systems is an essential tool for revealing setting-specific relationships and controls on water δ18O and improving archaeological and environmental interpretations (Jones, Reference Jones2013; Gibson and Reid, Reference Gibson and Reid2014; Jones et al., Reference Jones, Cuthbert, Leng, McGowan, Mariethoz, Arrowsmith, Sloane, Humphrey and Cross2016; Rohling, Reference Rohling2016).
To date, no mass balance modelling of the relationship between δ18O and changes in palaeolake systems has been conducted for the Willandra Lakes region. Unlike the lakes of the modelling studies cited above (Jones et al., Reference Jones, Leng, Roberts, Türkeş and Moyeed2005; Rohling, Reference Rohling2016; Lacey and Jones, Reference Lacey and Jones2018), Lake Mungo contains no modern water to measure fluxes and properties or hydrological patterns to observe. Given that such currently dry lakes lack surface water, quantitative modelling in palaeolake systems relies on certain assumptions. While observations from nearby river systems can be used to approximate source-water δ18O for the model, humidity over the lake surface and hence the precise δ18O of evaporated vapour is unknown. Despite these limitations, simple models can be used to test proposed past hydrological scenarios for physical consistency and to estimate at least the sign and order of magnitude of past changes, using sensitivity tests to determine the dependence of the reconstructions on initial assumptions. The present study uses this approach for Lake Mungo to reveal the major controls on otolith δ18O in a quantitatively consistent manner.
In this study, we revisit the otolith oxygen isotope results from the Lake Mungo hearths (Long et al., Reference Long, Stern, Williams, Kinsley, Wood, Sporcic and Smith2014). We develop a box model for lake filling and drying based on the dimensions of the Willandra Lakes, modern evaporation rates for the region, and mass balance principles, including the Craig-Gordon model for oxygen isotope fractionation during evaporation (Craig and Gordon, Reference Craig, Gordon and Tongiorgi1965). This model is used to investigate how the oxygen isotopes of Lake Mungo would have changed, given Bowler's (Reference Bowler1998) “easy prey” hypothesis. In this hypothesis, the Willandra Lakes were episodically filled by flood events followed by evaporation-driven isolation of Lake Mungo from the other lakes in the system, which eventually culminated in the desiccation of Lake Mungo.
METHODS
Site description
Lake Mungo is one of 13 major (currently dry) palaeolakes that make up the Willandra Lakes system. These lakes existed intermittently in cycles of wet and dry conditions throughout the Quaternary until they dried out completely at ~14.5 ka (Bowler, Reference Bowler1998; Bowler et al., Reference Bowler, Gillespie, Johnston, Boljkovac, Bolijkovac, Haberle and David2012; Fitzsimmons et al., Reference Fitzsimmons, Stern and Murray-Wallace2014). This series of basins is situated in arid New South Wales, Australia. Based on data from Pooncarie (Mulurulu station), 46 km north of Mungo, the average annual rainfall is 281 mm, with the lowest annual total at 58 mm and the highest at 803 mm, based on 135 years of data from 1882 to 2017 (Australian Government Bureau of Meteorology, 2020a). The mean annual evaporation rate for the region is 2000 mm/yr, based on at least 10 years of records from 1975 to 2005, and seasonal evaporation rates range from 200 mm in the Southern Hemisphere winter (June, July, August) to 900 mm in the Southern Hemisphere summer (December, January, February) (Australian Government Bureau of Meteorology, 2020b). The region was inscribed on the UNESCO World Heritage list in 1981 as a site of national and international significance for its testament to both the cultural history of the Aboriginal people and the record of climatic and environmental changes throughout the Quaternary (Bowler et al., Reference Bowler, Jones, Allen and Thorne1970; Bowler, Reference Bowler1998; Fitzsimmons et al., Reference Fitzsimmons, Stern and Murray-Wallace2014; Stern, Reference Stern, McGrath and Jebb2015).
A key feature of the Willandra Lakes region is the sand/clay dunes (lunettes), which have built up on the windward side of each basin. Based on the topography of the lake system and the sedimentary characteristics of the lunettes, it is inferred that these lakes were once connected, forming an overflow outlet for the Lachlan River (Bowler et al., Reference Bowler, Jones, Allen and Thorne1970, Reference Bowler, Hope, Jennings, Singh and Walker1976). They were filled by large pulses of water that flowed from the Southern Tablelands of the Great Dividing Range down the Lachlan River into the Willandra Creek (Bowler et al., Reference Bowler, Hope, Jennings, Singh and Walker1976; Bowler, Reference Bowler1998; Kemp and Rhodes, Reference Kemp and Rhodes2010). This water sequentially filled Lake Mulurulu and then Lakes Garnpung and Leaghur (Fig. 1). Lake Leaghur appears to have had two outflow points. The first is an overflow into Lake Mungo, the terminal lake in the system, via a shallow sill that separates the two lake basins. The second outflow is via the Willandra Creek, which then continues past Lake Mungo to feed into the outer Arumpo and Chibnalwood Lakes before eventually reaching the Prungle and Benenong Lakes farther to the south (Magee, Reference Magee1991; Barrows et al., Reference Barrows, Fitzsimmons, Mills, Tumney, Pappin and Stern2020; Jankowski et al., Reference Jankowski, Stern, Lachlan and Jacobs2020).
Study species
The main fish species found in hearth sites at Lake Mungo is the golden perch (Macquaria ambigua [Richardson] 1845). The golden perch is a long-lived species, which is today found throughout the Murray-Darling Basin, including the Lachlan River, preferring these predominately lowland, warmer, turbid, slow-flowing rivers (Lintermans, Reference Lintermans2007). These fish can tolerate a wide range of salinities (0–33 ppt) and temperatures (4–37°C), and both juveniles and subadults can even survive in seawater (Langdon, Reference Langdon1987). In modern systems, golden perch do not naturally congregate near the shoreline of lakes. Instead, they inhabit deep pools (~3–8 m) with woody debris, undercut banks, or rocky ledges (Cadwallader, Reference Cadwallader1979; Cadwallader and Backhouse, Reference Cadwallader and Backhouse1983; Battaglene and Prokop, Reference Battaglene and Prokop1987) and are usually fished using rods from small boats. Juvenile fish feed on aquatic insect larvae and microcrustaceans, while adults eat mainly shrimp, yabbies, small fish, and benthic aquatic insect larvae (Lintermans, Reference Lintermans2007). Successful spawning and recruitment of golden perch typically require elevated water temperatures and flooding (Humphries et al., Reference Humphries, King and Koehn1999; Mallen-Cooper and Stuart, Reference Mallen-Cooper and Stuart2003; Ye et al., Reference Ye, Cheshire, Fleer and Centre2008; King et al., Reference King, Tonkin and Mahoney2009). The otoliths of golden perch, like those of many other species, grow continuously and deposit annual marks (light and dark bands)that represent fast and slow growth zones tracking seasonal environmental changes. These, when viewed in thin section, have been validated for ageing fish up to 22 years, according to release-recapture fish studies (Anderson et al., Reference Anderson, Morison and Ray1992; Stuart, Reference Stuart2006).
Constructing the steady-state model
Data sources
This study focuses on comparing model results with oxygen isotope measurements from three otoliths collected from a single hearth (926) by MAP in 2009. The fish otolith oxygen isotope analysis was previously conducted and published as part of Long et al. (Reference Long, Stern, Williams, Kinsley, Wood, Sporcic and Smith2014). The otoliths of hearth 926 recorded a δ18O increase of 7‰ over 6 years (otolith 926-4), 9‰ over 8.5 years (otolith 926-3), and 15‰ over 10 years (otolith 926-1) (Fig. 2).
A simple steady-state model was constructed to examine the influence of the hydraulic controls on lake water δ18O in the main Willandra Lakes system, with an emphasis on Lake Mungo. The hydrological setting of Lake Mungo, and the lake system more broadly, affects water δ18O, which in turn is recorded in the δ18O of the preserved otoliths. The isotopic starting point for the model is based on river records from the nearby Barwon-Darling River system (Hughes et al., Reference Hughes, Stone, Gibson, Meredith, Sadek, Cendon, Hankin, Hollins and Morrison2012).
Establishing lake volumes and surface areas
To construct the model, maximum water level, surface area, and volume were calculated for each lake. Initially, the maximum water level in each of the four modelled lake basins was established using a digital elevation model (DEM) from the scanning radar topography mission, provided by Geoscience Australia. Here, the maximum water level was controlled by the height of the outlet channel connecting each basin to the next in the chain (Bowler et al., Reference Bowler, Gillespie, Johnston, Boljkovac, Bolijkovac, Haberle and David2012). Using DEM, the maximum lake level was defined as the highest closed 1-m contour line that resulted in separate lake basins. Next, surface areas and volumes were determined by excluding all contours that fell outside the highest closed 1-m contour line in each lake. The surface area was then calculated as the number of pixels in this contour, where each pixel represents a known unit area. To determine lake volume, the surface area was calculated by identifying pixels in 10-cm-depth intervals from the base of the lake to the highest closed 1-m contour line and integrating the series to estimate the volume at each respective 10-cm height.
Establishing mass balance conditions for the model
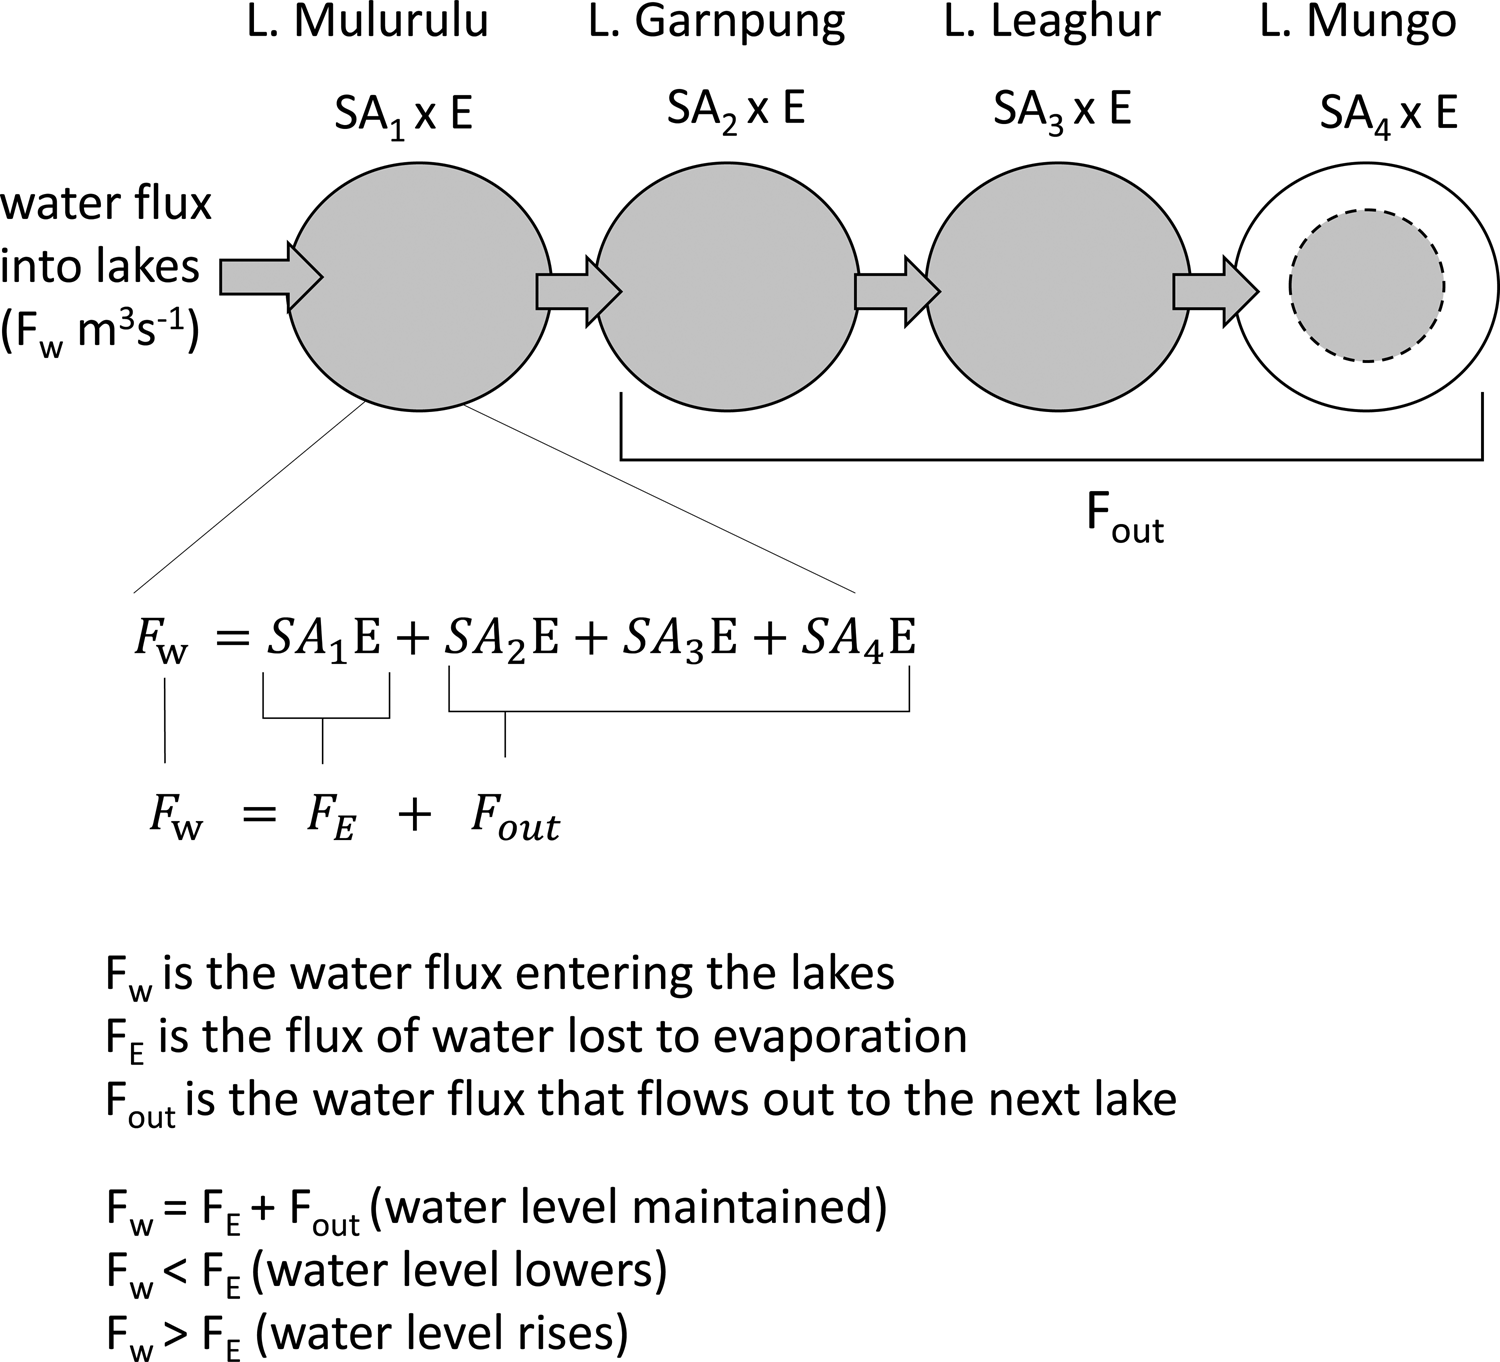
The starting point for the model is that all lakes are full; effectively, this hypothetically represents the aftermath of a large flood event, per the Bowler (Reference Bowler1998) hypothesis. The conditions required to maintain maximum lake levels are defined by water fluxes, specifically: (1) the rate of evaporation from each lake's surface, (2) the extra water that is needed to push water from one lake to the next, and (3) the amount of water needed to maintain the height of the next lake in the sequence. For example, for the water height of Lake Mungo to be maintained in a steady state, it needs to receive as much water from Lake Leaghur as it is losing via evaporation. For Lake Leaghur to remain full, it needs to receive as much water as it loses through evaporation as well as loss to Lake Mungo, where the latter is equivalent to the amount Lake Mungo loses via evaporation. Thus, the basic relationship between water fluxes representing the inflow, evaporation, and outflow required to maintain lakes in mass balance is given by:

where Fw is the water flux entering the lakes, FE is the flux of water lost to evaporation, and Fout is the water flux needed to maintain the heights of the lakes lower in the sequence. When Fw = FE + Fout, the lake level is stable because loss via evaporation is compensated exactly by inflowing water. When Fw < FE, the lake level will fall until empty because evaporation dominates. When Fw > FE, inflowing water dominates over evaporation, so the lake level will rise until full and then overflow (i.e., Fout becomes >0). Similar expressions of these water fluxes for a chain or string of lakes are considered in Gibson and Reid (Reference Gibson and Reid2014) and Gat and Bowser (Reference Gat, Bowser, Tayor, O'Neill and Kaplan1991).
The volume of water lost to evaporation from the first lake in the system is given by its surface area multiplied by the evaporation rate. The amount of outflow required is the surface area multiplied by the evaporation rate for each lake farther down the system (see Fig. 3).
Schematic representation of the water flux entering the Willandra Lakes system as expressed by equations 1, 2, and 3. Note the equation shown is for the specific case of Lake Mulurulu and in the model is adjusted appropriately for each lake downstream.

The water flux entering the Willandra Lakes system that is required to keep the water levels at a constant height can be expressed as:

where Fw is water flux entering the system, SA 1, SA 2, SA 3, and SA 4 are the surface areas of the lakes from top to bottom of the Willandra sequence, and E is the evaporation rate for the region. If no water flows out of Lake Mungo, then to maintain stable lake levels throughout the model system, the outflow for the top lake in the sequence must be equal to the sum of the surface area multiplied by the evaporation rate for each lake farther down in the sequence, or:

This gives us the amount of water needed to maintain all the lakes at mass balance after an initial filling event. Now that we have set up the model for maintaining water mass balance, we turn to establishing the isotopic equilibrium conditions.
Establishing isotopic equilibrium in the model
Several variables affect the δ18O of water bodies. In the model presented here, we take into account the following: surface area and volume of the lakes; the regional evaporation rates (annual, winter, and summer); equilibrium and kinetic effects on the fractionation of water oxygen isotopes during evaporation; and the connections between the lakes. Given the shallowness of the lakes (maximum depth is ~7–8 m), their large surface area to volume ratios (Lake Mungo was ~140 km2 when full; Barrows et al., Reference Barrows, Fitzsimmons, Mills, Tumney, Pappin and Stern2020), and the high wind speeds in the region (Mildura airport's mean monthly wind speed is between 9 and 20 km/hr (Australian Government Bureau of Meteorology, 2020c), the lakes are assumed to be well mixed. No direct lake-water oxygen isotope measurements are available because the modern lake system is dry and has not seen substantial water levels for the past ~16,000 yr (Fitzsimmons et al., Reference Fitzsimmons, Stern and Murray-Wallace2014). Therefore, the isotopic starting point for the model is estimated based on δ18O records from the nearby Barwon-Darling River as outlined in detail below (Hughes et al., Reference Hughes, Stone, Gibson, Meredith, Sadek, Cendon, Hankin, Hollins and Morrison2012). The following variables are not considered in the model as there are no robust data available for this site at ~20 ka: humidity, temperature, groundwater input/output, and salinity.
It should be noted that although the water δ18O value used as a starting point for the model influences the final equilibrium δ18O value, it does not influence the rate or degree of change over time, which is what we are interested in for this study. We thus chose to use a water δ18O starting point of -8‰, based on studies of water δ18O in the nearby Barwon-Darling River (Meredith et al., Reference Meredith, Hollins, Hughes, Cendón, Hankin and Stone2009; Hughes et al., Reference Hughes, Stone, Gibson, Meredith, Sadek, Cendon, Hankin, Hollins and Morrison2012). During high-flow events, like those that once filled the Willandra Lakes, ephemeral tributaries of the Barwon-Darling River contribute 18O-depleted water to the system. For example, Hughes et al. (Reference Hughes, Stone, Gibson, Meredith, Sadek, Cendon, Hankin, Hollins and Morrison2012) found that Darling River water at Bourke during the January 2004 high-flow event had a δ18O of -8.32‰ relative to -3.23‰ in water measured upstream at Brewarrina. Fluvial input near Bourke of 18O-depleted water from the Culgoa River, a normally dry tributary, caused the ~5‰ decrease in water δ18O (Hughes et al., Reference Hughes, Stone, Gibson, Meredith, Sadek, Cendon, Hankin, Hollins and Morrison2012). We assume for the Willandra Lakes model that a large-scale flood event filled the lakes over a period of days, resulting from an intense rainfall event(s). The isotopic composition of the source water in such a scenario is likely to be lighter (depleted in 18O) than the composition of mean rainfall for the local or source region.
Using a -8‰ starting water δ18O value, the equation for the isotopic steady state is given by:

where δp is the isotopic composition of precipitation or water entering the lakes, δL is the isotopic composition of the lake water, and δL – x gives the fractionation-related reduction in δ18O relative to the source liquid. At a typical ambient temperature of 15–20°C, equilibrium fractionation results in approximately x = 10 (Gonfiantini, Reference Gonfiantini, Fritz and Fontes1986; Froehlich et al., Reference Froehlich, Gonfiantini, Rozanski, Aggarwal, Gat and Froehlich2005; Rohling, Reference Rohling2016). In natural arid environments, this liquid-vapour offset can range from ~6‰ to 13‰, as measured respectively in evaporating water pans in arid Australia (Skrzypek et al., Reference Skrzypek, Mydłowski, Dogramaci, Hedley, Gibson and Grierson2015; Gonfiantini et al., Reference Gonfiantini, Wassenaar, Araguas-Araguas and Aggarwal2018) and the ephemeral Lake Gara Niba in the Algerian Sahara, northern Africa (Gonfiantini et al., Reference Gonfiantini, Wassenaar, Araguas-Araguas and Aggarwal2018). Δt is the time step used in the model to calculate how the system evolves through time. In the model, evaporation causes the surface layer of each lake to become enriched with 18O, and the isotopically heavier surface water is then instantaneously mixed through the rest of the water column before being passed on to the next lake in the sequence. Correspondingly, the first lake in the sequence was replenished with -8‰ water.
Running the steady-state model: scenarios
The first phase of the steady-state model involved setting up a series of connected boxes with the same dimensions as the Willandra Lakes basins and filling these instantly with water of δ18O equal to -8‰, simulating a massive flood event into the dry basins. The lake water was then maintained at mass balance (inflow = outflow + evaporation), while the water δ18O was allowed to adjust with evaporation and inflow according to equation 4. This was maintained for 20 years. We then used the δ18O value of water in Lake Mungo at the end of 20 years as the starting point for the second phase of the model, whereby we cut off inflow to Lake Mungo and allowed the water to evaporate.
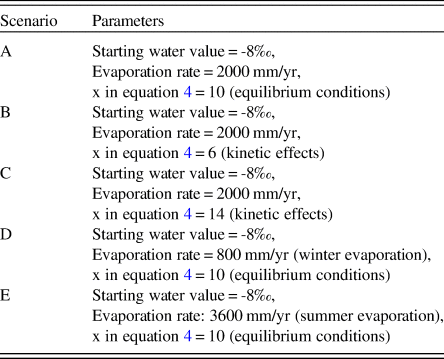
We tested five different versions of the steady-state model, and the parameters of these are summarised in Table 1. In scenarios A, B, and C, we set FE to the annual average evaporation rate for the region, which is 2000 mm/yr (Australian Government Bureau of Meteorology, 2020b); in scenarios B and C, we changed the degree of evaporative fractionation in equation 4 from x = 10 (equilibrium) to x = 6 and x = 14, respectively, as a sensitivity test for changes in fractionation due to kinetic effects in natural arid environments (Skrzypek et al., Reference Skrzypek, Mydłowski, Dogramaci, Hedley, Gibson and Grierson2015; Gonfiantini et al., Reference Gonfiantini, Wassenaar, Araguas-Araguas and Aggarwal2018). In scenarios D and E, we changed FE from the modern annual average evaporation rate for the region (2000 mm/yr) to the winter (800 mm/yr) and then summer (3600 mm/yr) evaporation rates, respectively (Australian Government Bureau of Meteorology, 2020b). This provides sensitivity tests with respect to the model's response to different evaporation rates.
Summary of the modelled scenarios for the Willandra Lakes; evaporation rates are based on historical records for the region from the Australian Government Bureau of Meteorology (2020b), and starting water values are estimated based on studies of nearby river systems (Hughes et al., Reference Hughes, Stone, Gibson, Meredith, Sadek, Cendon, Hankin, Hollins and Morrison2012).

RESULTS
Lake volume and surface area
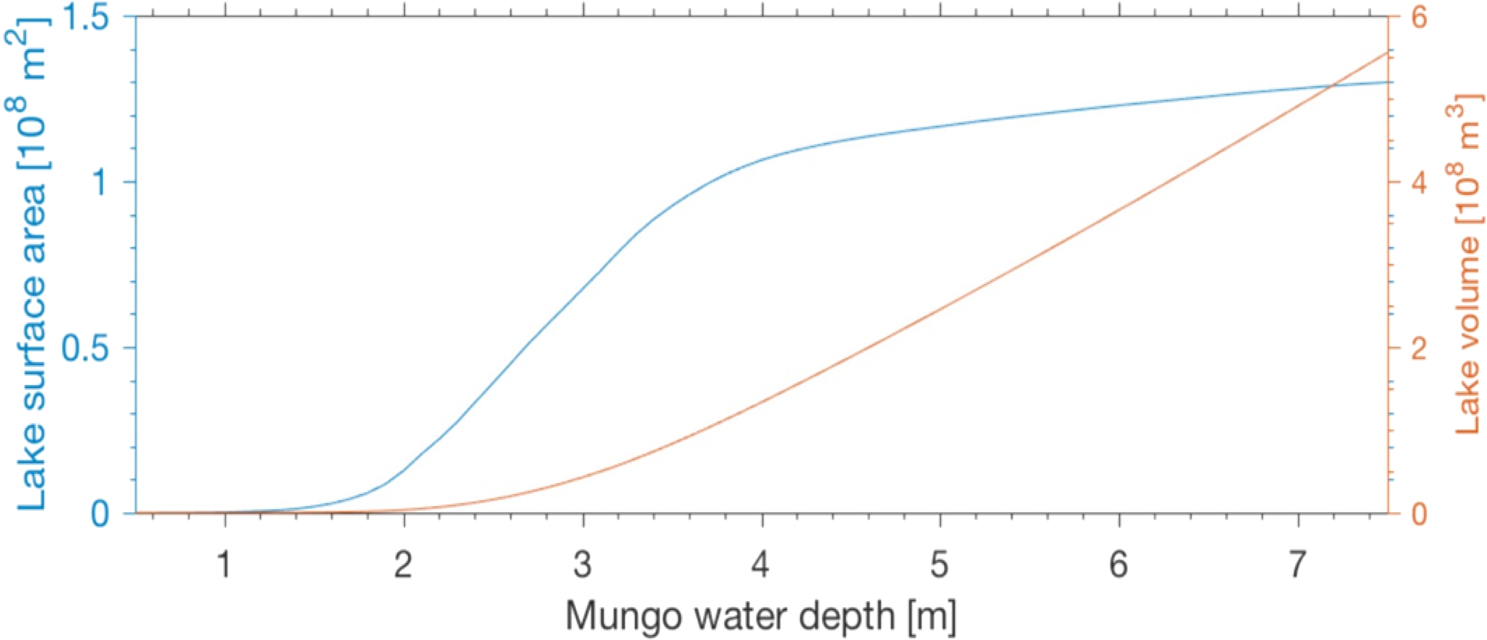
The surface area and volume of Lake Mungo are shown as functions of water level in Figure 4. We found negligible changes in the volume between 1 and 2 m water depths and a near-linear increase in volume from 2 to 7.5 m water depth, to a maximum volume of ~5.5 x 10⁸ m3. The surface area shows no appreciable increase until ~1.5 m water depth, where it increases rapidly to ~1 x 10⁸ m2 at 4 m water depth and then remains relatively stable until the maximum depth is achieved.
(color online) Modelled change in Lake Mungo's surface area and volume with depth.

Mass balance modelling
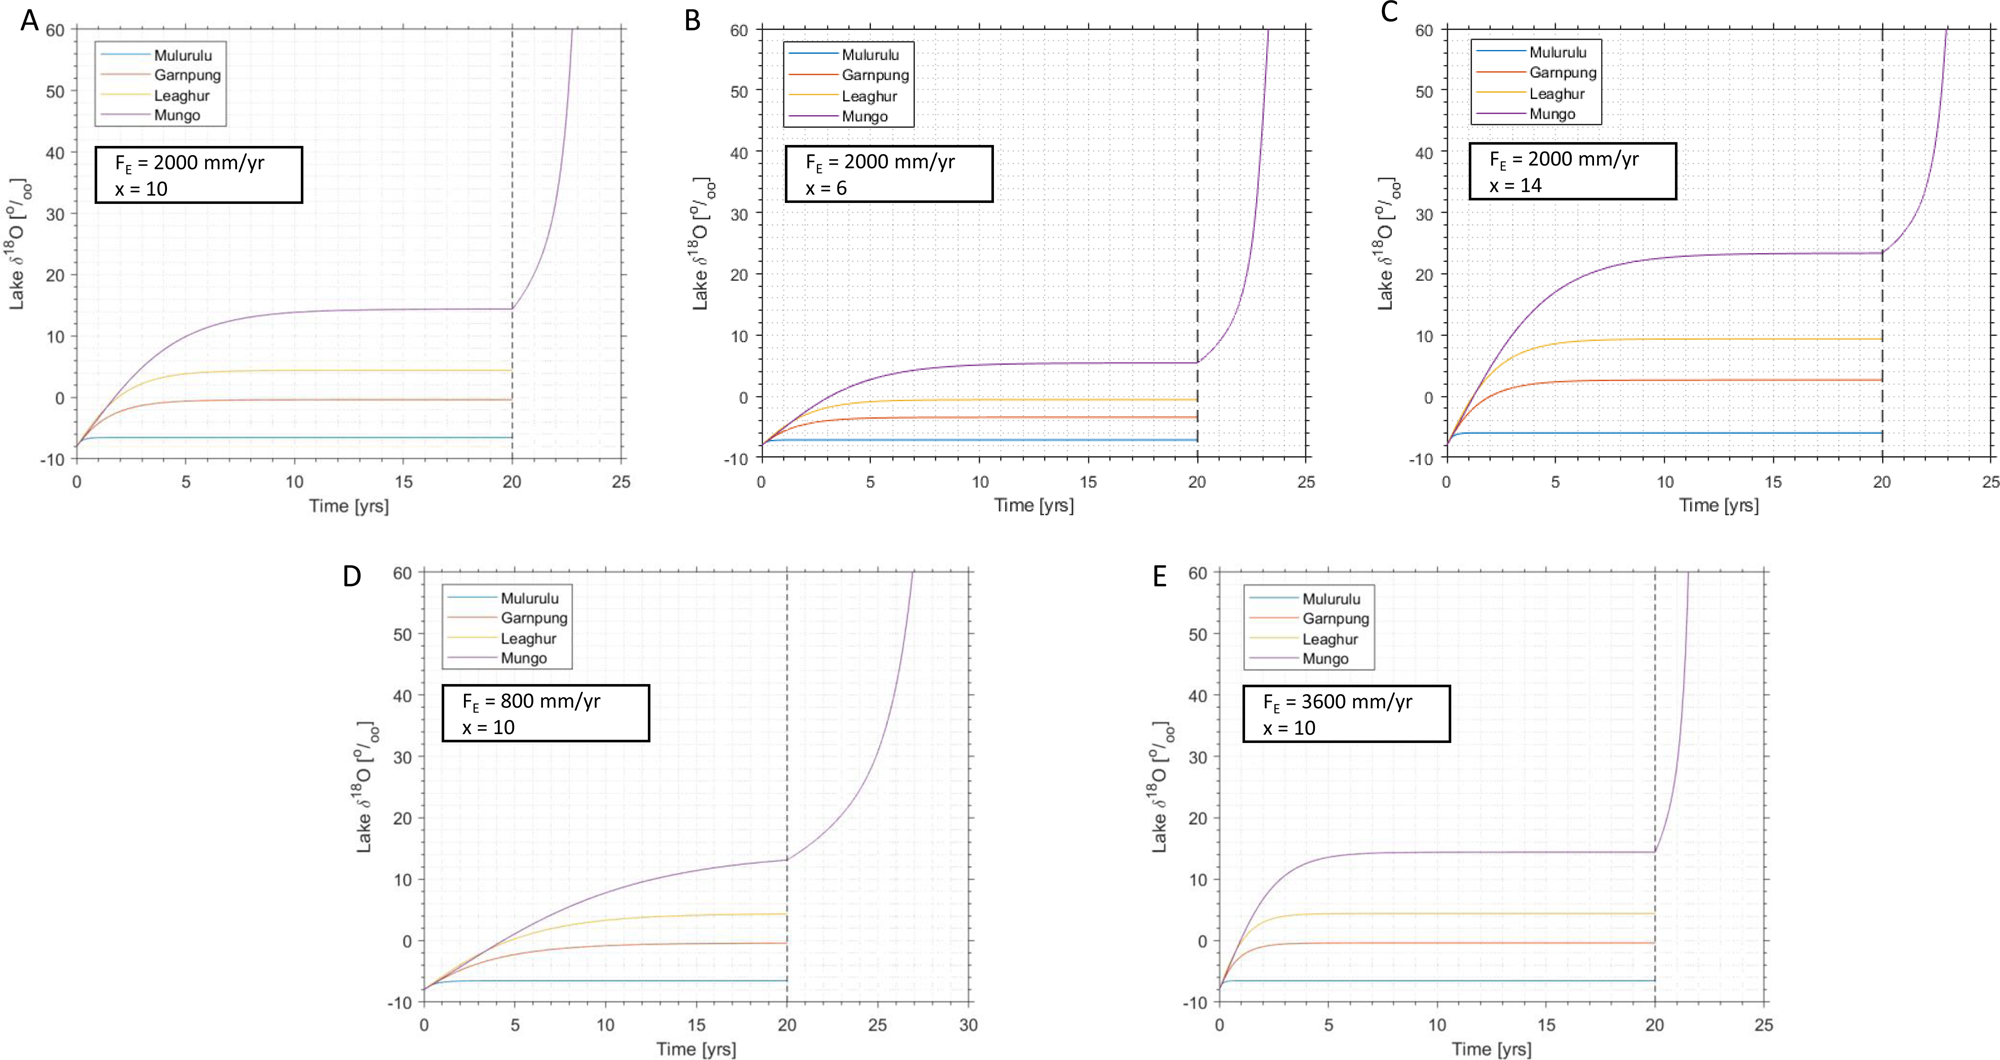
The results of the mass balance portion of the model, to the left of the dashed vertical line in Figure 5, show that the modelled water δ18O of each lake basin increases as a function of both time and distance down the system. At Mulurulu, the first lake in the sequence, the modelled δ18O of the lake water remains close to the -8‰ of the inflow in all four scenarios, only increasing by 1–2‰ over 20 years. In contrast, the modelled water δ18O values at Lake Mungo, the terminal lake in the sequence, increase rapidly before beginning to plateau.
(color online) Modelled output for changes in the water δ18O of the Willandra Lakes system when the lake levels are maintained in mass balance for 20 years (to the left of the dashed vertical line) and the changes in the water δ18O of Lake Mungo when it is cut off from the other lakes and left to evaporate to dryness (10 cm deep) after those 20 years (to the right of the dashed vertical line). Five different scenarios are shown: (A) evaporation rate is set to 2000 mm/yr, x is set to 10 in equation 4; (B) evaporation rate is set to 2000 mm/yr, x is set to 6 in equation 4; (C) evaporation rate is set to 2000 mm/yr, x is set to 14 in equation 4; (D) evaporation rate is set to 800 mm/yr, x is set to 10 in equation 4; (E) evaporation rate is set to 3600 mm/yr, x is set to 10 in equation 4.

Scenario A: evaporation set to 2000 mm/yr, equilibrium scenario, x = 10
In scenario A, FE = 2000 mm/yr and x = 10, the modelled δ18O of water in Lake Mungo increases by ~18‰ in five years and eventually levels off at ~10 years, at a value of 14‰ (a total change of 22‰), which is maintained until the first part of the model ends at 20 years (Fig. 5A). The end value of 14‰ is used as the start of the second part of the model when inflow to Lake Mungo is ceased, and the water is left to evaporate until the lake is essentially dry (10 cm deep). Following the cessation of inflow, the modelled water δ18O for Lake Mungo increases by 16‰ in two years and continues to increase rapidly to beyond the limits of the graph.
Scenario B: evaporation set to 2000 mm/yr, x = 6
In scenario B, also with FE = 2000 mm/yr, we use x = 6 to allow for evaporation under reduced fractionation compared to equilibrium, which results in a lesser increase in the modelled Lake Mungo water δ18O, namely 11‰ in five years and flattening at ~15 years to a value of 5.5‰ (a total change of 13.5‰); this is maintained until the first part of the model ends at 20 years (Fig. 5B). In the second part of the model, when inflow to Lake Mungo ceases, the modelled water δ18O increases by 10.5‰ in two years and continues to increase rapidly to beyond the limits of the graph.
Scenario C: evaporation set to 2000 mm/yr, x = 14
In scenario C, also with FE = 2000 mm/yr, we use x = 14 to allow for substantial kinetic fractionation effects, which results in a greater increase in the modelled Lake Mungo water δ18O, namely 25‰ in five years and flattening within 12 years to a value of 23‰ (a total change of 31‰); this is maintained until the first part of the model ends at 20 years (Fig. 5C). In the second part of the model, when inflow to Lake Mungo ceases, the modelled water δ18O increases by 11‰ in two years and continues to increase rapidly to beyond the limits of the graph.
Scenario D: evaporation set to 800 mm/yr, equilibrium scenario, x = 10
Assuming that the modern winter evaporation rate applies year-round, a sensitivity test with a low annual evaporation-rate (scenario D) causes the lake water δ18O to increase more slowly toward isotopic equilibrium. At Lake Mungo, the water δ18O increases by ~9‰ in the first five years of mass balance conditions, reaching ~13‰ at 20 years (a total change of 21‰). In the second phase, when inflow into Lake Mungo is cut off, the modelled water δ18O values increase by 5‰ in the first year and 18‰ over five years (Fig. 5D).
Scenario E: evaporation set to 3600 mm/yr, equilibrium scenario, x = 10
Assuming that the modern summer evaporation rate applies year-round, a sensitivity test with a high annual evaporation-rate (scenario E) resultsin a faster increase in water δ18O during phase 1, with Lake Mungo water δ18O increasing by 22‰ in the first five years, culminating in a δ18O of ~14‰ after 20 years (Fig. 5E). In the second phase, when inflow is cut off to Lake Mungo, the modelled water δ18O values increase sharply by 14‰ in the first year and by >60‰ over two years.
DISCUSSION
Under water mass balance conditions (inflow = evaporation + outflow), the water δ18Os will eventually approach isotopic equilibrium, a point at which there is no measurable change in the isotopic composition of the water; we refer to this point as “isotopic balance.”
In the results for the mass balance portion of the model, to the left of the dashed vertical line in Figure 5, the δ18Os of the different lakes progress similarly to different points of isotopic balance. The modelled water δ18O for Lake Mulurulu at the top of the sequence remains fairly low and close to the -8‰ of incoming water in all scenarios. The lakes farther down the sequence (Leaghur, Garnpung, and Mungo) reach successively higher isotopic balance points than does Lake Mulurulu. These results are a direct consequence of evaporation and the connections between the lakes, with each lake passing on isotopically heavier water (i.e., higher δ18O) than the water it received from the upstream lake. Ultimately, this causes lakes farther from the primary water source to reach higher δ18O levels than those closer to the source. These results further demonstrate the string-of-lakes effect on water δ18O, as discussed by Gat and Bowser (Reference Gat, Bowser, Tayor, O'Neill and Kaplan1991) and Gibson and Reid (Reference Gibson and Reid2014). If we had modelled water mass balance for Lake Mungo in isolation, the dependence of Lake Mungo water δ18O on processes in the lakes higher in the system would have been neglected.
Comparison between the models and the otoliths
The impact of removing inflow on the δ18O of Lake Mungo water is shown to the right of the dashed vertical line in Figure 5. This is the point at which we isolated Lake Mungo and allowed the water to evaporate at the given rate until the lake was effectively dry (10 cm deep). Any fish that were living in the lake during the full extent of this trend would have died and been deposited on the lake floor. The fish otoliths that are the focus of this and the previous study (Long et al., Reference Long, Stern, Williams, Kinsley, Wood, Sporcic and Smith2014) were collected from hearth sites on the lakeshore, which suggests that they did not die naturally in the lake but were collected and eaten. The original interpretation of the increasing trends in the hearth otolith δ18O records proposed that they resulted from water changes associated with progressive drying out and lowering of lake levels (Long et al., Reference Long, Stern, Williams, Kinsley, Wood, Sporcic and Smith2014). In all scenarios tested here, the change in water δ18O values when Lake Mungo is cut off and evaporating is much more rapid and of much greater amplitude than the changes recorded in the hearth otoliths. Within five years of inflow cut-off, the δ18O in all scenarios increases by >18‰. In scenario E, this even happens in two years (Fig. 5E). When we compare this to the maximum change recorded in the hearth otolith δ18O records—15‰ increase over 10 years (otolith 926-1; Fig. 2)—it becomes apparent that it is improbable that these fish were collected from a lake evaporating to dryness.
The results of this study show that under mass balance conditions, represented to the left of the dashed line in Figure 5, the modelled water δ18O of Lake Mungo increases to a point and then flattens. This happens in all five scenarios. These trends closely follow those observed in the hearth otoliths, in particular otolith 926-1, which shows a sharper increase in early life and a flatter trend in later life (Fig. 2). The total increase in hearth otolith δ18O is in the order of 10–15‰ over 10 years (otolith 926-1). This rate of change is most similar to the results for winter evaporation rate scenario D, where the increase in modelled water δ18O for Lake Mungo under mass balance conditions is 16‰ in 10 years (Fig. 5D).
Although the increasing trend in the hearth otoliths from Lake Mungo was initially interpreted (Long et al., Reference Long, Stern, Williams, Kinsley, Wood, Sporcic and Smith2014) in a qualitative manner in terms of inflow cut-off and subsequent lake desiccation, supporting the easy prey hypothesis (Bowler, Reference Bowler1998), our model-based quantitative assessment indicates that this can no longer be supported. Instead, we find that hearth otolith δ18O records are more representative of a recently flooded lake that is maintained in mass balance under relatively low evaporation conditions (<800 mm/yr). That is, the otolith records are registering a change in oxygen isotopes with evaporation but not a change in lake volume and thus level.
Given the similarities between the winter mass balance model results (scenario D) and the otolith observations, we infer that the golden perch living in Lake Mungo between ~19 and 19.5 ka were living in a mass-balanced system with a steady lake level, which gradually developed toward isotopic mass balance (equilibrium). We contend that it is highly unlikely that Lake Mungo evaporated to dryness during the period represented by the fishbone hearths. The rapid trend in water δ18O that would characterise evaporating lake conditions is not reflected in the hearth otolith data. This reinterpretation of the otolith records fits well with recent work at Lake Mungo, which suggests increased availability of surface water during the LGM as a result of lower evaporation rates and increased runoff (Barrows et al., Reference Barrows, Fitzsimmons, Mills, Tumney, Pappin and Stern2020).
Fish otolith δ18O and lake level modelling compared to sedimentary records
Sedimentary archives provide a broad range of information concerning lake hydrology, and optically stimulated luminescence dating has proven invaluable for putting this information into a chronological sequence (Fitzsimmons et al., Reference Fitzsimmons, Stern and Murray-Wallace2014; Barrows et al., Reference Barrows, Fitzsimmons, Mills, Tumney, Pappin and Stern2020; Jankowski et al., Reference Jankowski, Stern, Lachlan and Jacobs2020). The difficulty comes with matching these records with an Aboriginal presence on the lakeshore. Otoliths and shells from hearth sites and middens are already being used to radiocarbon date hearth sites on the lakeshore and link them to the sediments in which they lie (Stern, Reference Stern, McGrath and Jebb2015), but there is further value in these otoliths and shells. The subannual records in otoliths can add detail to the local lake level history, experienced by people in the past. When coupled with mass balance modelling, as shown here, we can start to rule out some scenarios for lake conditions and add weight to others.
Otolith: diagenetic, cooking, and trash disposal effects
Modern golden perch fish otoliths are typically composed entirely of aragonite. Diagenetic effects like heating can cause the aragonite to recrystallise into the more stable polymorph calcite. In archaeological otolith samples, the absence of calcite is usually a good indication that an otolith has not been affected by chemical alteration. Two of the ancient hearth otoliths were tested using X-ray diffraction, and neither were found to contain measurable calcite (Long et al., Reference Long, Stern, Williams, Kinsley, Wood, Sporcic and Smith2014). This provides some assurance that recrystallisation has not occurred.
Regarding the effect of cooking on fish otolith oxygen isotopes, Disspain et al. (Reference Disspain, Ulm, Izzo and Gillanders2016) applied a range of different cooking methods to black bream and found that otoliths that had been heated had lower mean δ18O compared to the control group. Differences in δ18O between heat-treated otoliths and the control group ranged from -1.09 to -1.47‰, except for the otoliths that were burnt. Burnt otoliths were visibly blackened with a chalky texture, and these had δ18O values 4.37‰ lower than the control. This is similar to the results of cooking experiments conducted by Andrus and Crowe (Reference Andrus and Crowe2002), who found that the δ18O of burnt Atlantic croaker (Micropogonius undulatus) and catfish (Bagre marinus) otoliths were 1.8–3.1‰ lower than the control sample. The study by Long et al. (Reference Long, Stern, Williams, Kinsley, Wood, Sporcic and Smith2014) avoided any otoliths that showed signs of burning (blackened surface), but they may have experienced heating. If we take into account the possibility that heating affected hearth otolith δ18O values, they should all be 1–2‰ higher, as heating would have caused the original δ18O value to decrease. There would be no change in the slope of the observed trend, and so this does not increase support for an evaporating lake scenario.
Evaporation rate, equilibrium, and kinetic fractionation
The annual average evaporation rate during the LGM is unknown. Likewise, the effect of ambient conditions on the isotopic fractionation of water during evaporation is unknown for the LGM. Therefore, we tested multiple evaporation rates and both equilibrium and kinetic values for x in equation 4 to determine the effect these have on the modelled water δ18O. The results show that the evaporation rate affects the speed at which the water δ18O increases toward isotopic balance, while the fractionation rate controls the height of that balance point. All the scenarios with the same x value in equation 4 will eventually reach the same isotopic balance point, but the time this takes differs. In the summer scenario (Fig. 5E), which had the highest evaporation rate, the increase in modelled water δ18O for Lake Mungo occurs quite quickly, reaching isotopic balance in 10 years. In contrast, the winter evaporation scenario (Fig. 5D), with the lowest evaporation rate, yields a modelled water δ18O curve for Lake Mungo that is flatter and only reaches 13‰ in the 20 years of the model. If we extended the time frame for this portion of the model, it would eventually flatten out at ~14‰. By changing the value for x from 10 in scenario A to 14 in scenario C (Fig. 5C), we increase the isotopic balance point from ~14 to ~23‰. By reducing the value for x to 6 in scenario B (Fig. 5B), we reduce the isotopic balance point to ~5.5‰. Even with this reduced value of x, the change in the water δ18O of Lake Mungo, 11‰ in 5 years, is still greater and faster than the change observed in the otoliths (15‰ in 10 years). Regardless of there being only equilibrium (x 10) or equilibrium + kinetic (x = 10 ± 4), based on water bodies evaporating in similarly arid environments (Gonfiantini et al., Reference Gonfiantini, Wassenaar, Araguas-Araguas and Aggarwal2018) and fractionation during evaporation, the change in water δ18O when Lake Mungo is cut off and left to evaporate is still much more pronounced than that seen in the otoliths. For the model presented here, the only way that the trend can be flattened to more closely match the otoliths is by changing the evaporation rate.
Model limitations
All models have limitations around what can and cannot be inferred (Box, Reference Box1976). The model created here is not a true-to-life simulation of climate and lake conditions in the Willandra Lakes region during the LGM. Instead, it is a simplified model that only considers the amount of water needed to fill the lakes, the annual evaporation rate, and basic isotopic theory for fractionation of water during evaporation. There are usually subannual to decadal changes in temperature, humidity, water input, evaporation rate, and other factors that are simply unknown for this period at the scale needed to compare to the life of a fish.
The mass balance models presented here do not include contributions from groundwater. It has been suggested by Bowler et al. (Reference Bowler, Gillespie, Johnston, Boljkovac, Bolijkovac, Haberle and David2012) that during the final drying of the lower lakes in the system, an influx of seasonal high-salinity groundwater would have produced clay dunes with a high gypsum content. So far, the only lake where high gypsum clays are observed on the lunettes is at Chibnalwood/Arumpo, which is below Lake Leaghur in the sequence and not directly connected to Lake Mungo. These lakes are not considered in the present scenario, and there is no evidence of a gypsum clay phase at Lake Mungo (Bowler et al., Reference Bowler, Gillespie, Johnston, Boljkovac, Bolijkovac, Haberle and David2012).
In the nearby Darling River, groundwater exchanges were found to increase the river water Cl- content (increasing the salinity), but the depletion in the stable isotope values by mixing with depleted groundwater was found to be overwhelmed by evaporative enrichment (Meredith et al., Reference Meredith, Hollins, Hughes, Cendón, Hankin and Stone2009). Those authors could only identify the impact of groundwater input on the oxygen isotopes by sampling at a high spatial and temporal resolution a short distance of the river. Similar conclusions were reached by Simpson and Herczeg (Reference Simpson and Herczeg1991), who observed that groundwater influx had a major impact on salinity levels when Darling River waters were low, whereas the impact on the isotopes of the river water was minor. In the present study, we are comparing our model outputs to the otolith records, which at best contain an annual average trend and are unlikely to pick up the short-term influence of groundwater isotopic input. We have therefore decided not to include this in our model.
The salinity of the water in the Willandra Lakes in the past is unknown, but it is expected that any salts accumulating in the upstream lakes would be flushed downstream during flood events (Bowler et al., Reference Bowler, Gillespie, Johnston, Boljkovac, Bolijkovac, Haberle and David2012). This would result in increased salinity during evaporation and higher salinity at lakes lower in the chain. In marine or near-marine salinities, evaporation can result in a reversal in the enrichment process of the oxygen isotopes during evaporation (Gonfiantini, Reference Gonfiantini, Fritz and Fontes1986; Gat, Reference Gat1995). There is no reversing trend evident in the otolith oxygen isotope values, and so it is unlikely that salinity was high enough to cause this effect; thus, it is not considered in the model scenarios.
If humidity were included in the model, we would likely find a change in the evaporative slope. Heavy isotope enrichment is considerable when humidity is low, but the effect is reduced when humidity is higher (Gat and Bowser, Reference Gat, Bowser, Tayor, O'Neill and Kaplan1991). Humidity also has a role to play in limiting the isotopic enrichment of the lake water. At humidity 0.75 (75%), the limiting value for a lake of 0‰ is +8‰. At humidity 0.50 (50%), the same lake has a limiting value of ~24‰, and at humidity 0.25 (25%), the limit is >40‰. Again, there are no records for humidity at Lake Mungo during the LGM, but a follow-up mass balance model could test different scenarios to see what effect this has on the oxygen isotope trends.
CONCLUSIONS
Our reappraisal of the δ18O records preserved in golden perch (Macquaria ambigua) otoliths from archaeological contexts at the Lake Mungo UNESCO World Heritage Site indicates that the fish did not die in a lake that was cut off from the river system and evaporating to dryness. Our calculations instead suggest that the annual evaporation rate for the region was lower than it is today and that lake levels were more or less stable (i.e., the fish were living in a mass-balanced system, and the otolith δ18O increase resulted from the gradual development of the ambient water toward isotopic balance). The trend in otolith δ18O values was most similar to those of the water when the lakes were full and evaporative rates were set to 800 mm/yr. Our results also have implications for the interpretation of Aboriginal fishing practices. The hypothesis that people were taking advantage of sluggish oxygen-starved golden perch in a drying-out lake system does not seem to be supported. Hence, consideration needs to be given to other fishing techniques and thus the role of fish in the diet. Development of the implications will require more oxygen isotope records across otolith (or shell) age increments from the Willandra Lakes region and further refinement of the modelling to account for variation in environmental factors such as humidity, temperature, precipitation, and groundwater processes.
ACKNOWLEDGMENTS
We would like to thank the Traditional Tribal Groups of the Willandra Lakes Region and thank the support of the Willandra Lakes Region Aboriginal Advisory Group and guidance set out in their Research Code of Practice. We would like to thank Nicola Stern and Nathan Jankowski for providing comments on the sections related to the archaeology and geology of Lake Mungo and the Willandra Lakes, and Matthew Jones for providing comments on the modelling aspects of this study. Thanks also to the reviewers and QR Editors who provided insightful comments that greatly improved the final manuscript. This research was supported in part by ARC DP150100487 and ARC DP1092966. Long was supported in part by a postdoctoral fellowship with the ARC Centre of Excellence in Australian Biodiversity and Heritage. The model code can be found at https://github.com/dave-heslop74/Mungo-model.