I. INTRODUCTION
As an advanced process, electropulsing treatment (EPT) has been found to be more powerful and more effective in accelerating microstructural changes and phase transformationsReference Onodera and Hirano1–Reference Gromov, Zuev and Tsellermar6 and in improving properties of alloys, when compared to traditional thermal and thermomechanical processes.Reference Troitskii7–Reference Zhu, To, Lee, Liu, Jiang and Tang10 Previous studies reported that electropulsing tremendously accelerated phase transformations by a factor of at least 6000 times, compared with that achieved in the normal ageing process.Reference Zhu, To, Lee, Liu, Jiang and Tang4 It was also reported that with adequate electropulsing, the elongation of a Zn–Al-based alloy (ZA22) was increased by 437% at ambient temperature under a high strain rate, whereas the instantaneous tensile stress remained unchanged, compared with that of the non-EPT alloy.Reference Zhu, To, Lee, Liu, Jiang and Tang10
The fundamental mechanisms by which such significant changes of phase transformations and properties resulted from electropulsing are not yet understood. This study deals with static electropulsing-induced phase transformations in a cold-drawn Zn–Al-based alloy (ZA27), based on a systematic investigation on phase transformations and processing of the Zn–Al-based alloys.Reference Zhu11–Reference Zhu, To, Lee, Zhang and Cheung13
II. EXPERIMENTAL PROCEDURES
Ingots of a Zn–Al-based alloy (ZA27) of nominal composition Zn71.3Al26.5Cu2.2 (in mass%) were repeatedly extruded, tempered, and drawn to produce alloy wire of 1.18 mm in diameter. The cold-drawn Zn–Al-based alloy wire was cut into pieces of 100-mm length for static EPT (without external stress affect) at ambient temperature (28 °C).
A self-made electropulsing generator was applied to discharge multiple positive pulses with current intensities: 5 A for 10 s (s), 30 s, and 60 s, and 10 A for 60 s. The frequency for the multiple electropulsing was selected as 50 Hz. The duration of each pulse was kept to about 2300 μs. The current densities (A/mm2) are 37.4 and 109.3 for 5A EPT and 10A EPT, respectively. The mean root square densities (A/mm2) for the two EPTs are 6.28 and 24.7, respectively. The surface temperature of the specimens being tested was about 28–30 °C, which was measured by a thermocouple.
Longitudinal cross sections of the non-EPT and the static EPT wire specimens were polished and examined using scanning electron microscopy in the backscattered diffraction mode to obtain a medium resolution of atomic number contrast among the various phases involved. Phases containing heavier elements, e.g., Zn-rich η and ε phases, appear as light images. Those containing light elements, e.g., Al-rich α phase, appear as dark images. X-ray diffraction (XRD) examination was performed with an x-ray diffractometer, using nickel-filtered Cu Kα radiation. The characteristic XRD measurement was carried out within a range of diffraction angle (2θ) from 35–47° with a scanning speed of 1° min−1.
Electron backscattered diffraction (EBSD) performance was carried out on a Leo 1530 field emission scanning electron microscope HKL Technology APS Ltd, Oxford, UK. In performance EBSD, the specimens were tilted at 70°.The electron backscattered Kikuchi diffraction patterns (EBKDP) were generated by scanning selected areas of 1.35 × 10³ (μm) in backscattered electron microscopy (BSEM) images The electron microscope scanned in step-sizes of 0.3 μm. Special care was taken in polishing specimens for EBSD examination, using diamond paste from 6 μm down to 0.4 μm.
III. RESULTS AND DISCUSSION
A. Static electropulsing-induced phase transformation in alloy ZA27
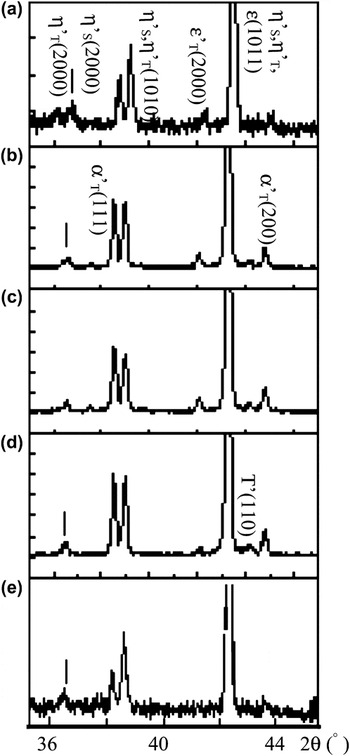
The cold-deformed Zn–Al-based alloy wire (ZA27) consisted of residual supersaturated η′S phase [hexagonal close-packed (hcp) structure], various metastable phases: η′T (hcp structure), ε′T (Zn4Cu, hcp structure), α′T [face-centered cubic (fcc) structure], and a small amount of residual T′ [body-centered cubic (bcc) structure] phase. According to the XRD examination, the (0002) XRD peaks of η′S and η′T phases are overlapped at 2θ about 36.7°, as shown in Fig. 1(a). The (1010) and (1011) XRD peaks of the overlapped η′S and η′T locate at 39.3 and 43.3°, respectively. The (10-10), (0002), and (10-11) XRD peaks of ε appear at 37.8, 42.3, and 43.3°, respectively. The (110) XRD peak of T′ phase is at 44.2°. Two eutectoid phase transformations: η′S → η′T + ε′T + α′T and ε′T → η + α + T′, i.e., ε + α → η + T′ occurs sequentially in various thermal and thermomechanical processes.Reference Zhu11–Reference Zhu, To, Lee, Zhang and Cheung13
X-ray diffractograms of the cold-deformed ZA27 specimens of (a) nonelectropulsing treatment and static EPT with current densities: (b) 5 A for 10 s, (c) 30 s, and (d) 60 s and (e) 10A for 60s.
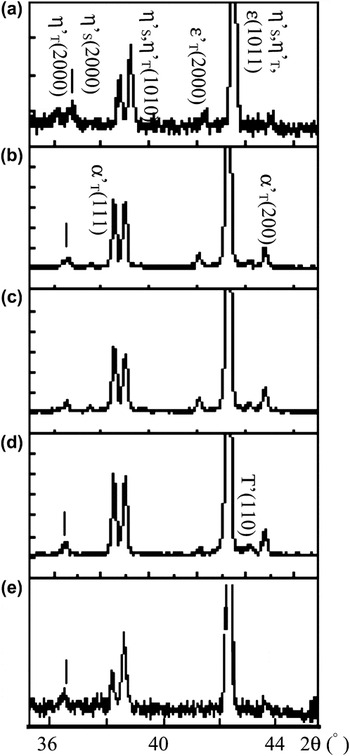
During 60 s of 5A EPT, the overlapped (0002) XRD peaks of η′S and η′T phases gradually shifted to a lower 2θ angle from 36.7° with increasing electropulsing time, as shown in Figs. 1(a)–1(d). This shifting of the 2θ angle was one of the characteristics of the decomposition of the supersaturated η′S phase.Reference Zhu11–Reference Zhu, To, Lee, Zhang and Cheung13 This means that the decomposition of η′S phase: η′S → η′T + ε′T + α′T occurred during 60 s of 5A EPT. Meanwhile, the (0002) XRD peak of ε′T phase decreased, accompanying an increase of the (110) XRD peak of T′ phase increased at 44.3°, as shown in Fig. 1(d). This indicated that another decomposition, ε′T → η + α + T′, i.e., ε + α → η + T′, occurred. The decomposition of the ε′T phase, i.e., the four phase transformation ε + α → η + T′ completed after over 526 h of ageing at 100 °C,Reference Zhu, Man, Dorantes-Rosales and Lee12 whereas the decomposition of η′S and ε′T phase completed after only about 60 s of 5A EPT. It was obvious that electropulsing tremendously accelerated the phase transformations. In other words, the decompositions occurred in a way of quenching.Reference Zhu, To, Lee, Liu, Jiang and Tang4 After 10A EPT for 60 s, the overlapped (0002) XRD peaks of η′S and η′T phases had shifted to a higher 2θ angle, and the (110) XRD peak of T′ phase reduced, as shown in Fig. 1(e). These implied that two reverse phase transformations: α + η + T → ε′T and η′T + ε′T + α′T → η′S occurred in a way of up-quenching.
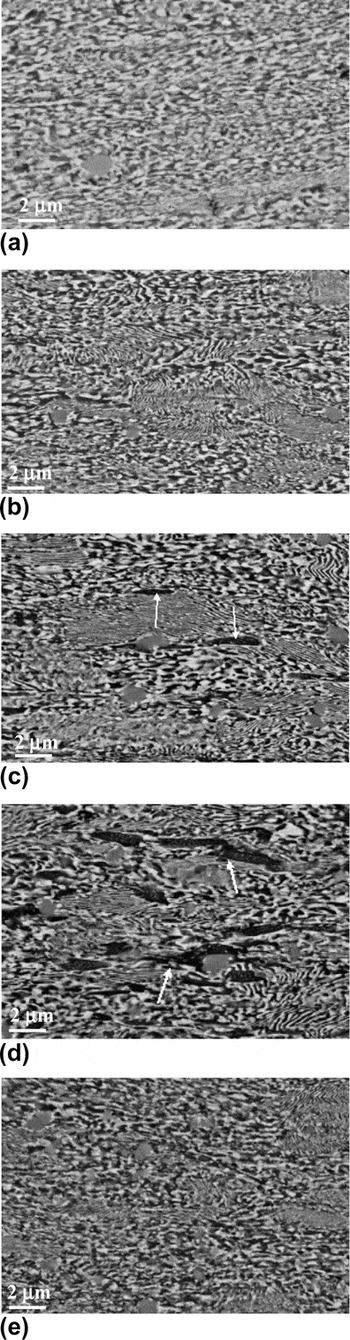
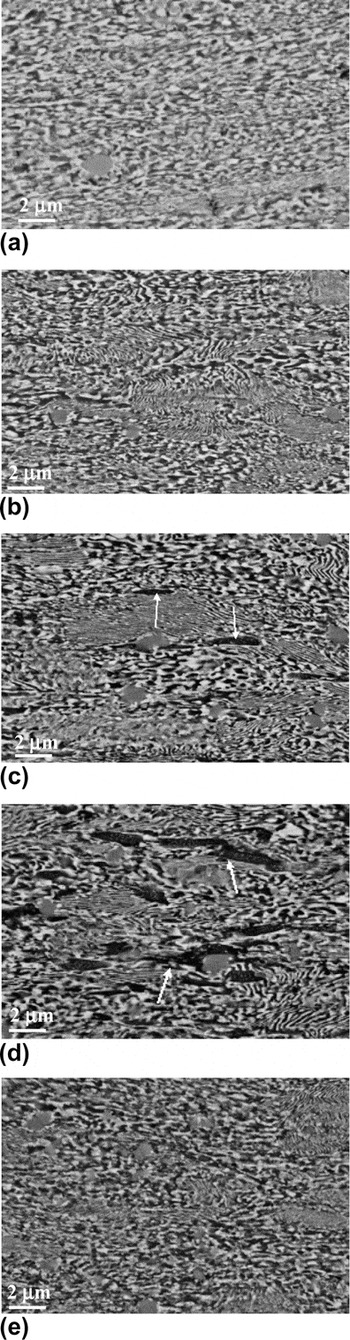
The aforementioned two stages of phase transformations were detected in the BSEM examination. Shown in Fig. 2 are images of the non-EPT specimen and the static EPT specimens with various current densities 5A EPT for 10 s, 30 s, and 60 s, and 10 A for 60 s. It was observed that when 5A EPT duration increased up to 60 s, the dark imaged Al-rich α′T phase increased, as shown in Figs. 2(a)–2(d). The α′T phase is one of the products of the decomposition of η′S phase: η′S → η′T + ε′T + α′T. This means that the η′S → η′T + ε′T + α′T occurred during 60s of 5A EPT. This agreed with the XRD results. After 10A EPT for 60 s, the amount of the dark imaged α′T phase considerably decreased. This means that the reverse transformation: η′T + ε′T + α′T → η′S occurred.
Backscattered electron microscopy images of the cold-deformed ZA27 specimens of (a) non-EPT and static EPT with current densities: (b) 5 A for 10 s, (c) 30 s, and (d) 60 s and (e) 10 A for 60 s.
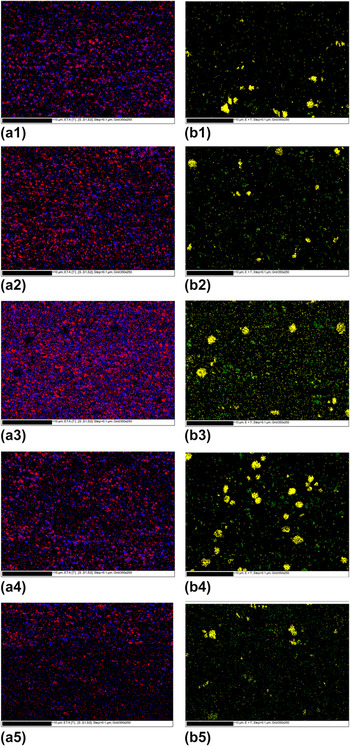
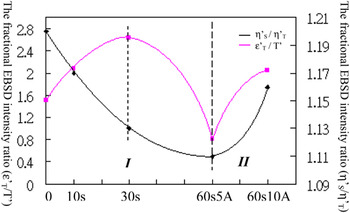
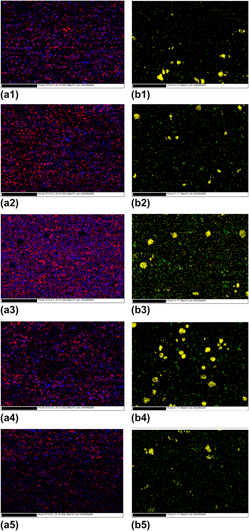
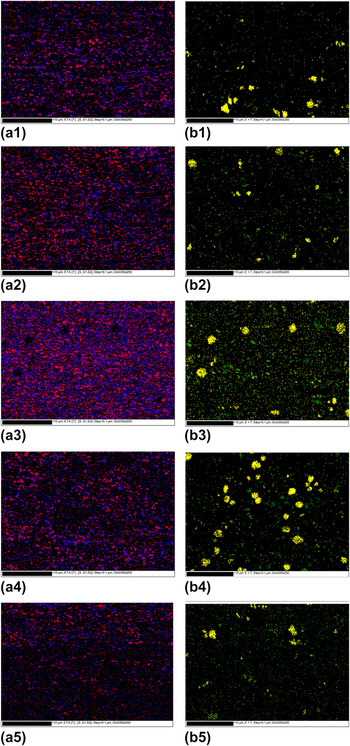
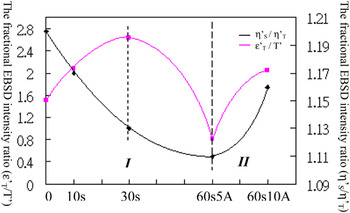
To confirm the above mentioned two stages of phase transformations, i.e., forward and reverse phase transformations, EBSD was carried out on the non-EPT and EPT specimens. In our previous studies, decompositions of η′S phase and ε′T phase were detected in the EPT eutectoid ZA alloy.Reference Zhu, To, Lee, Liu, Jiang and Tang4 Lattice parameters of the five phases involved in the phase transformations: η′S, ε′T, α′T, η′T, and T′ were determined by using transmission electron microscopic (TEM) examination, and listed in Table I.Reference Zhu, To, Lee, Liu, Jiang and Tang4, Reference To, Zhu, Lee, Tang, Liu and Jiang5 By using these TEM-determined lattice parameters of the five phases, the EBKDP were generated for scanning selected areas of 1.35 × 10³ (μm2) in the BSEM images of the specimens being tested. EBSD mapping of the η′S phase (blue in color), η′T (red in color), ε′T (green in color), and T′ (yellow in color) were realized, as shown in Figs. 3(a) and 3(b), respectively. The EBSD intensities of the phases were automatically examined. Ratios of fractional EBSD intensities of (η′S/η′T) and (ε′T/T′) are listed in Table II. Ratios of the fractional EBSD intensities, (η′S/η′T) and (ε′T/T′) of the non-EPT specimen and the static EPT with current intensities: 5 A for 10 s, 5 A for 30 s, 5 A for 60 s, and 10 A for 60 s are listed in Table I and schematically shown in Fig. 4.
Electron backscattered diffraction (EBSD) mapping of (a) η′S, (blue), η′T (red) and (b) T′ (yellow) and ε′T (green) of the cold-deformed ZA27 specimens of (1) non-EPT and static EPT with current densities: (2) 5 A for 10 s, (3) 30s, and (4) 60 s and (5) 10 A for 60 s.
The ratios of the fractional EBSD intensities, (η′S/η′T) and (ε′T/T′) of the non-EPT and the static EPT ZA27 alloy specimens with current densities: 5 A for 10 s, 30 s, and 60 s and 10 A for 60 s.
The lattice parameters for electron backscattered diffraction (EBSD) mapping deduced by transmission electron microscopy.Reference To, Zhu, Lee, Tang, Liu and Jiang5, Reference Jiang, Tang, Shek, Zhu, Guan, Wang and Xu14

hcp, hexagonal close-packed; fcc, face-centered cubic; bcc, body-centered cubic.
The ratios of the fractional EBSD intensities, (η′S/η′T) and (ε′T/T′) of the nonelectropulsing treatment specimen and the static EPT specimens with current densities: 5 A for 10 s, 30 s, and 60 s and 10 A for 60 s.

The ratio (η′S/η′T) represents the relative amount of η′S and η′T in the specimen being tested. A change of the ratio (η′S/η′T) indicates the direction of the phase transformation: η′S → η′T + ε′T + α′T. The ratio (ε′T/T′) represents the relative amount of ε′T and T′ in the specimens. Then the direction of the phase transformation: ε′T → η + α + T′ was detected.
In the first stage (60 s of 5A EPT), the (η′S/η′T) decreased gradually from 1.20 to 1.11, i.e., the decomposition, η′S → η′T + ε′T + α′T occurred, as shown in Fig. 4. It is noticed that in the early period of 30 s of 5A EPT in the first stage, the (ε′T/T′) increased from 1.51 of the non-EPT specimen to 2.63 of the 5 A/30 s EPT specimen because of the increase of ε′T phase resulted from the decomposition of η′S phase:η′S → η′T + ε′T + α′T. Then it decreased to 0.90 after 5A EPT for 60 s, and the decomposition of ε′T, i.e., ε′T → η + α + T′ became dominant, as shown in Fig. 4. Therefore, it is reasonable to deduce that η′S → η′T + ε′T + α′T occurred earlier than ε′T → η + α + T′. The two decompositions of the η′S and the ε′T are separated schematically in the first stage (the I zone), as indicated by a dashed line in Fig. 4. After 10A EPT for 60 s, the ratios, (ε′T/T′) and (η′S/η′T) increased from 0.81 and 1.11 to 2.04 and 1.16, respectively, as shown in Fig. 4. This means that two reverse phase transformations: η + α + T′ → ε′T and η′T + ε′T + α′T → η′S occurred in the second stage. In previous studies, it was determined that the reverse phase transformation:η + α + T′ → ε′T was followed by the phase transformation: η′T + ε′T + α′T → η′S.Reference Zhu, To and Liu15 The electropulsing-induced reverse phase transformations are schematically shown in the II zone of Fig. 4.
Coupled with the XRD, BSEM, and TEM examinations, EBSD confirmed quantitatively the electropulsing-induced phase transformation in ZA27 alloy as: the first stage, η′S → η′T + ε′T + α′T and ε′T → η + α + T′, which occurred sequentially by a way of quenching, and the second stage, η + α + T′ → ε′T and η′T + ε′T + α′T → η′S, which occurred sequentially by a way of up-quenching.
B. Relationship between phase transformations that occurred under electropulsing and during various thermal and thermomechanical processes
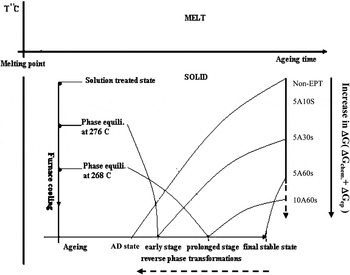
The relationship between phase transformations that occur under electropulsing and in various thermal and thermomechanical processes is schematically shown in Fig. 5, here the reverse phase transformations are indicated by dashed lines. In previous studies, it was reported that the transformation: η′S → η′T + ε′T + α′T occurred at the early stage of ageing or in the part of specimens with less external stress, whereas the transformation: ε′T → η + α + T′ occurred at the prolonged stage of ageing or in the part of specimens with higher external stress.Reference Zhu11
Relationship between phase transformations in the aged and the as-deformed-EPT ZA alloy (ZA27).
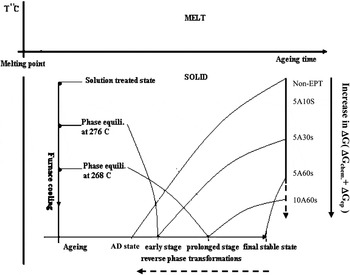
From Fig. 5, it can be seen that the electropulsing-induced phase transformations (η′S → η′T + ε′T + α′T and ε′T → η + α + T′) by a way of quenching are in agreement with those occurred during ageing and the external stress-induced phase transformation. In other words, for the phase transformations by way of quenching, those that occur at the early stage of electropulsing are related with the phase transformations that occurred at the early stage of ageing or in the part of specimens with less external stress, e.g., η′S → η′T + ε′T + α′T, whereas phase transformations occurring at the prolonged stage of electropulsing, e.g., ε′T → η + α + T′, i.e., ε + α → η + T′, are related to those that occurred at the prolonged stage of ageing or in the part of specimens with higher external stress.
The phase transformations by the way of up-quenching have been previously studied.Reference Jiang, Tang, Shek, Zhu, Guan, Wang and Xu14
In these studies of both the phase transformations and the reverse phase transformations, the Kikuchi diffraction patterns were created from a bulk specimen by the EBSD technique. The phases with similar microstructure were discriminated quantitatively, based on TEM-determined lattice parameters of phases involved. Therefore, EBSD becomes effective in detecting quantitatively multiphase transformations of alloys. This is a new development of EBSD technique in materials research.
C. Driving force for the static electropulsing-induced phase transformations
The driving force for the static electropulsing phase transformations consists mainly of two parts, ΔG chem and ΔG ep, as described by:

where ΔG chem is the chemical Gibbs free energy and ΔG ep is the electropulsing-induced Gibbs free energy. The electropulsing tremendously accelerated the phase transformations in two stages:
(i) When ΔG < 0, ΔG = ΔG chem + ΔG ep, the phase transformations (η′S → η′T + ε′T + α′T and ε′T → η + α + T′) by the way of quenching were significantly accelerated. As ΔG = 0, the saturated state, i.e., the final stable state is reached.
(ii) Upon further electropulsing, ΔG became positive, i.e., ΔG > 0. The saturated phases, i.e., the stable phases, decomposed by the way of up-quenching to high temperature phases. The reverse transformations occurred: α + T′ + η → ε′T and η′T + ε′T + α′T → η′S. During the reverse phase transformations, ΔG chem appears as an antidriving force, i.e., ΔG = –ΔG chem + ΔG ep. The ΔG ep becomes the driving force.Reference Zhu, To, Lee, Liu, Jiang and Tang4, Reference To, Zhu, Lee, Tang, Liu and Jiang5
When the equilibrium at the higher temperature was reached, the phase transformations by way of quenching started again. Both ΔG chem and ΔG ep accelerated tremendously the phase transformations by way of quenching i.e., ΔG = ΔG chem + ΔG ep.
D. Electropulsing kinetics
Under electropulsing, electron winds formed by a knock-on collision of high-rate electrons with atomic nuclei was beneficial to the mobility of dislocation.Reference Conrad, Sprecher and Nabarro16 Under the impact of transit stress, motivated dislocations were moving very quickly, even at ultrasonic speed.Reference Gumbsch and Gao17 The transfer of energy from the electrons directly to atoms was much more effective than that in the traditional thermal and thermomechanical processes. In the case of diffusion-controlled phase transformations, electropulsing effectively influenced the dislocation dynamics. Accumulation and annihilation of dislocation considerably speed up at the subgrain boundaries, as the atomic diffusion flux, j, tremendously increases with increases of both time and current density of electropulsing. The j consists of two parts: j t and j a, where j t is the flux of diffusion atoms caused by the thermal effect, and the j a is the flux of the diffusion atoms due to the athermal effect.Reference Conrad2, Reference Hao, Tanimoto and Mizubayashi18–Reference Dolinsky and Elprin20
The average atomic flux per second during multiple continuous electropulsing can be described as in the following equationReference Jiang, Tang, Shek, Zhu, Guan, Wang and Xu14:
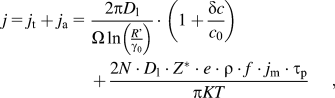
where D l is the lattice diffusion coefficient, N the density of the atom. The additional symbol c 0 is the average concentration of vacancy, δc supersaturation concentration of vacancies, r 0 and R′ the distances far from the dislocation, where the vacancy concentrations are c 0 and c 0 + δc, respectively; Z* is effective charges of intercrystalline atoms, e is the charge on an electron, T the absolute temperature; j m, f, and τ p are peak current density, frequency, and duration of each electropulse, respectively.
From the equation, it can be seen that j a strongly increases with peak current density (j m) and the duration of electropulsing (τ p). In this study, the current density is represented by the current intensity for the alloy wire of 1.18 mm in diameter.
IV. CONCLUSIONS
(1) By using EBSD, phases with similar microstructure are discriminated, based on TEM-determined lattice parameters of phases. Thus, it was quantitatively detected that electropulsing tremendously accelerated phase transformations in two stages:
(a) The supersaturated phases, η′S and ε′T decomposed sequentially by the way of “quenching”: η′S → η′T + ε′T + α′T and ε′T → η + α + T′.
(b) The reverse phase transformations occurred sequentially by the way of up-quenching: η + α + T′ → ε′T and η′T + ε′T + α′T → η′S.
(2) The electropulsing-induced phase transformations in the way of quenching are in agreement with those that occurred during ageing and the external stress-induced phase transformation.
ACKNOWLEDGMENTS
The authors thank Mr. F.Y.F. Chan of the Electron Microscopy Unit of the Hong Kong University for the technical assistance. The authors also thank the Research Grant Council of Special Administration Region of the People’s Republic of China for financial support (Project No. PolyU 5316/09E).