

1. Introduction
The Centers for Disease Control and Prevention (CDC) have declared opioid abuse to be the worst drug overdose epidemic in U.S. history.Reference Kolodny1 Drug overdose deaths increased by 137% between 2000 and 2014, exceeding deaths from car accidents and firearms, and becoming the leading cause of mortality from injuries in the U.S. in 2009.Reference Paulozzi2 In particular, overdose deaths from prescription opioids have nearly quadrupled since 1999, and more than 17,000 people died from overdose by prescription opioids in 2015 alone.3
The spike in overdose deaths from prescription opioids was at first matched by a parallel increase in the number of opioid prescriptions written by doctors. Our data shows that doctors filled 80.5 opioid prescriptions for every 100 persons in 2006. While the number of patients with access to prescription opioids has declined more recently, the number of prescriptions the average patient had in 2016 was still at a high of 3.5. Furthermore, these prescriptions came with an average supply of 18.1 days per prescription, which is higher by 4.8 days than the average in 2006.4
However, opioid prescription rates do not subscribe to a consistent regional or temporal pattern. CDC in a 2012 report pointed to the fact that the rates of use of opioid pain relievers have shown a 2.7-fold variation between the highest and the lowest prescribing states.Reference Paulozzi5 In addition to regional variation, opioid prescription in the U.S. has also seen temporal fluctuations: there was a 4.1% annual increase in prescription rates between 2006 and 2008, but the annual increase shrank to a 1.1% between 2008 and 2012, and became a 4.9% annual decrease between 2012 and 2016.6
This variation is not surprising given vast regional differences in the socioeconomic and demographic profiles of U.S. states, and the fact that different states in the U.S. have adopted different variants of a given policy, and at different times, to address the crisis. For instance, all states except Missouri have passed legislation establishing prescription drug monitoring programs (PDMPs), and everywhere except in Nebraska, these PDMPs require dispensers to report data on patients.Reference Frakt7 The objective of the PDMPs is to detect patterns of drug abuse, and prevent doctor shopping or prescription duplication by maintaining a database of all prescriptions of controlled substances issued to a patient. This allows doctors an opportunity to access past records of patients before prescribing opioids to them. However, while some states make it obligatory for physicians to access the PDMP before prescribing opioids, others do not. Moreover, PDMPs vary across states in the frequency with which they require prescribers and dispensers to update the databases; PDMP update can be in real time, daily, every 3 days, or monthly depending on the state in question.
In addition, as of 2016, 48 states have authorized some variant of a naloxone access law (NAL), and 37 states have passed a drug overdose good samaritan law (GSL).8 NALs allow for the administration of naloxone to counter the effects of an opioid overdose, while GSLs provide immunity from prosecution for drug possession to individuals who seek medical assistance during an overdose episode.Reference Rees9 However, NALs and GSLs vary across states in terms of whether they provide immunity to prescribers, dispensers and/or lay-persons; whether the immunity covers civil liability, criminal prosecutions and/or professional sanctions; whether the states have a standing or a protocol order governing how pharmacists are allowed to dispense naloxone without a patient specific prescription; and whether prescribers, dispensers or lay persons are required to be a part of a naloxone administration program to qualify for immunity.10
After establishing the impact of state interventions on opioid prescriptions, we explore whether varying degrees of urbanization, racial diversity and income disparity within states is driving part of this sub-state heterogeneity. Finally, we assess how much of the variation in prescription rates still resists explanation by policy interventions, even after accounting for county and year fixed effects, and a comprehensive set of time-varying county-level controls.
States have also variously reformed substance abuse treatment in the wake of this deadly crisis. One such reform is rooted in the expansion, by some states, of Medicaid under the Affordable Care Act (ACA). ACA requires coverage for mental health and substance abuse treatment from expansion states that jointly administer Medicaid with the federal government.Reference Zezima and Ingraham11 A related reform is the state-level certification of doctors to deliver Medication-Assisted Treatment (MAT) to patients suffering from opioid dependency. There is a great deal of state-level heterogeneity in these reforms: Medicaid expansion did not occur in all states, and the types and extent of treatments covered under Medicaid vary from state to state. Meanwhile, across states, varying numbers of physicians have been certified to administer buprenorphine, and to varying numbers of patients — either 30 or 100 — at a time.12
Such state-level heterogeneity exists not only in the design of all of these interventions, but also in the timing of their adoption. States adopted different mixes of these policies, and at different times. Thus, medical communities across the U.S. have had varying degrees of exposure to state policies that are meant to raise awareness about, and limit the extent of, opioid abuse.
This paper seeks to understand the heterogeneous impacts of state PDMP laws on county-level prescription rates. We begin by analyzing the degree to which the spatial and temporal variation in opioid prescriptions can be attributed to the variation in the policies adopted by different states. More specifically, we use county-level panel data on all opioid prescriptions in the U.S. between 2006 and 2015 to examine whether there is a heterogeneous treatment effect at the substate level due to state-level policy interventions, with a specific focus on PDMP policies. We focus on PDMPs more thoroughly than other interventions (such as NALs, GSLs, Medicaid expansions or MAT certifications) because PDMPs affect prescriptions most directly. Conversely, the impact of other opioid-related policies operates on prescriptions through more indirect channels such as awareness amongst doctors of the extent, urgency and consequences of the misuse and abuse of prescription opioids. Nonetheless, these other interventions serve as important proxies for states' commitment to mitigating the opioid crisis, and thus we control for them when studying the impact of PDMPs.
After establishing the impact of state interventions on opioid prescriptions, we explore whether varying degrees of urbanization, racial diversity and income disparity within states is driving part of this sub-state heterogeneity. Finally, we assess how much of the variation in prescription rates still resists explanation by policy interventions, even after accounting for county and year fixed effects, and a comprehensive set of time-varying county-level controls.
Our results indicate that PDMPs are not effective in reducing prescription rates unless physicians are required to access the PDMPs prior to prescription. Moreover, other state interventions such as NALs, GSLs, Medicaid expansion and MAT certifications also have a negative and significant impact on prescription rates even though they do not directly require action from physicians. However, these significant results are driven entirely by urban counties (as defined below: metro counties, and non-metro counties with an urban population of at least 2500 people). We find no analogous effect of any of these policy interventions on rural counties (non-metro counties with a completely rural population or an urban population of less than 2500 people).
In addition, we find evidence for heterogeneous county-level responses to the state-level interventions. Disparity in the income and racial distribution of these counties accounts for part of this heterogeneity. Our findings suggest that more affluent counties with an average weekly wage above the national average are more responsive to many of these policies than poorer counties. Moreover, counties with an above median proportion of whites in the population are more responsive to most of these policies than counties with a below median proportion of whites.
We also find that there is large, residual unexplained variation in prescription rates within and across counties. Most of our models are able to explain only about a third of the overall variation in prescription rates despite including county and year fixed effects, and a series of socioeconomic and demographic county-level controls. The remaining regional and temporal variation still resists explanation.
2. Previous Studies
Scholarship on the opioid crisis does not usually speak to the question of variation in prescription rates directly and tends to focus, instead, on drug overdose or substance abuse treatment. For instance, Alpert et al. (2017) exploit state variation in exposure to an abuse deterrent reformulation of Oxycontin to establish evidence for consumer substitution from opioids to heroin.Reference Alpert13 They use data on the number of overdose deaths by drug types to gauge the size of the substitution effect. Meanwhile, Hollingsworth et al. (2017) attempt to quantify the extent to which disparate local macroeconomic conditions can explain opioid deaths and emergency department (ED) visits.Reference Hollingsworth14 They find that an increase in the unemployment rate leads to increased opioid related deaths and ED visits.
In addition, there has been a recent focus amongst such studies on exploiting the regional and temporal variation in state interventions to evaluate the treatment effect of specific policies on opioid abuse and overdose. For instance, Rees et al. (2017) exploit state variation in NALs and GSLs to find that these laws are associated with a 9 to 11 percent reduction in opioid overdose deaths.15 MacLean and Saloner (2017) deploy a difference-in-difference strategy to compare Medicaid expanding states with non-expanding states over time, and conclude that Medicaid expansion has had a large impact on the financing of substance abuse treatment, but no effect on drug-related overdoses.Reference Maclean and Saloner16 Moreover, a number of studies have analyzed the impact of PDMPs. Many of them conclude that there is no evidence to suggest that PDMPs reduce the prevalence of opioid misuse or adverse health outcomes.Reference Meara17 However, more recent PDMP literature has exploited the increased take-up rate of PDMPs — especially of the “must access” kind — to arrive at a different conclusion. For instance, Buchmueller and Carey (2017) found that must-access PDMPs significantly reduce the prescription drug consumption of Medicare beneficiaries. The study relies on a random 5% subsample of prescription drug claims from Medicare's prescription drug program (Part D).Reference Buchmueller and Carey18
In the handful of cases where the supply of, and variation in opioid prescriptions is directly addressed, either the sample or the scope of the study is limited in a number of ways. Olsen et al. (2006) find that primary care physicians in the Northeast and Midwest are significantly less likely to prescribe opioids than those working in the South and the West, but they are unable to evaluate recent trends in prescriptions because their data range from 1992 to 2001.Reference Olsen19 Curtis et al. (2006) study insurance claims for twelve oral opioid medications, and find a ten-fold difference across states in the number of claims per 1000 people.Reference Curtis20 However, their sample is limited to a handful of private insurance firms, and uses data only from 2000. Carlson et al. (2012) use a national sample of opioid prescriptions, and find that geographic variation in prescription rates at the county-level is greater than the variation observed in other healthcare services, with the highest prescribing counties disproportionately located in Appalachia, and in the Southern and Western states.Reference Carlson21 While this study overcomes shortcomings of relying on a few insurance firms, it draws its data only from 2008, and is thus, unable to adopt a longitudinal approach towards temporal trends in opioid prescriptions. Given this, Schnell and Currie (2017) offer more insightful results because they use data on all opioid prescriptions between 2006 and 2014.Reference Currie and Schnell22 They find that physicians who completed their education at top medical schools write fewer prescriptions, implying that physician training partly explains the variation in prescription rates. However, the educational backgrounds of individual physicians are unlikely to account fully for the systematic geographic and temporal patterns that characterize county-level opioid prescription rates.
A couple of studies also address the impact of PDMPs on opioid prescriptions specifically, but they have important limitations. For instance, Bao et al. (2016) found that PDMPs lead to more than a 30 percent reduction in the rate of prescribing.Reference Bao23 However, they only use data from twenty-four states, and from the years 2001 to 2010, thereby ignoring the most recent trends in prescriptions. Similarly, Wen et al. (2017) found that PDMPs adopted between 2011-14 resulted in a 9-10% reduction in the opioid prescriptions. However, this study is limited to Medicaid enrollees, and only looks at the impact of PDMPs enacted within this 3-year window.Reference Wen24
Moreover, a few descriptive reports present anecdotal evidence suggesting that the increase in opioid-induced deaths in non-metropolitan and rural areas in the U.S. has been greater than the increase in metropolitan areas.Reference Frosch25 However, these patterns have not been corroborated by empirical studies of nationwide trends.
Given these considerations, we fill a number of gaps in the existing scholarship. First, we focus our attention on prescription rates, which have been neglected relative to opioid overdose deaths and emergency visits. Second, we perform our analysis at the county-level as opposed to the state-level, thereby exploiting the substantial sub-state heterogeneity in prescription rates. Third, by relying on a national sample of opioid prescriptions, we overcome the selection bias that is inherent to studies based on Medicare and Medicaid populations, or on a select group of private insurance firms. Fourth, because our study extends from 2006 to 2015, we are able to adopt a longitudinal approach and study the most recent trends in prescriptions rates as and when they evolve with the ongoing opioid crisis. Fifth, instead of looking at a singular policy like PDMPs in isolation of other state interventions, we are able to explain more of the regional variation by consolidating and controlling for a variety of opioid-related policy interventions. Finally, ours is the only study of which we are aware that statistically quantifies the heretofore anecdotal hypotheses regarding the rural-urban, racial and income patterns underlying the supply of prescription opioids.
3. Data
Opioid prescriptions are our primary outcome of interest. County-level data on prescription rates per 100 persons was obtained from the CDC website.26 It has been collected by QuintilesIMS, a public company specializing in pharmaceutical market intelligence. The data is based on a sample of approximately 59,000 retail (non-hospital) pharmacies, which supply about 88% of all retail prescriptions in the U.S. For the purposes of this dataset, a prescription is an initial or refill prescription dispensed at a retail pharmacy in the sample, and financed by private insurance, Medicaid, Medicare, or cash.27 The public use version of this dataset on the CDC website only provides an account of the number of prescriptions filled for opioid anal-gesics per 100 persons.28 These prescriptions include butrans (buprenorphine), codeine, fentanyl, hydroco-done, hydromorphone, methadone, morphine, oxyco-done, oxymorphone, propoxyphene, tapentadol, and tramadol, but exclude mail order pharmacy data, and cough and cold formulations containing opioids and buprenorphine. In addition, the data does not include methadone prescribed through methadone maintenance treatment programs. Missing data tends to indicate that the county had no retail pharmacies, the county was not sampled, or the prescription volume was erroneously attributed to an adjacent, more populous county based on the sampling rules used.
We acquired data on PDMP legislations from the PDMP Training and Technical Assistance Center (TTAC).29 Information about the frequency at which PDMPs are updated was procured from a 2016 Pew Charitable Trusts report.Reference Urahn30 Data on Medicaid expansion under the ACA was obtained from Maclean and Saloner (2017).31 Data on whether states have passed a NAL or an opioid specific GSL was procured from the Prescription Drug Abuse Policy System.32 If a NAL was in place for less than a full year, following Rees et al. (2017)'s approach, we set up the NALit indicator as fractions.33
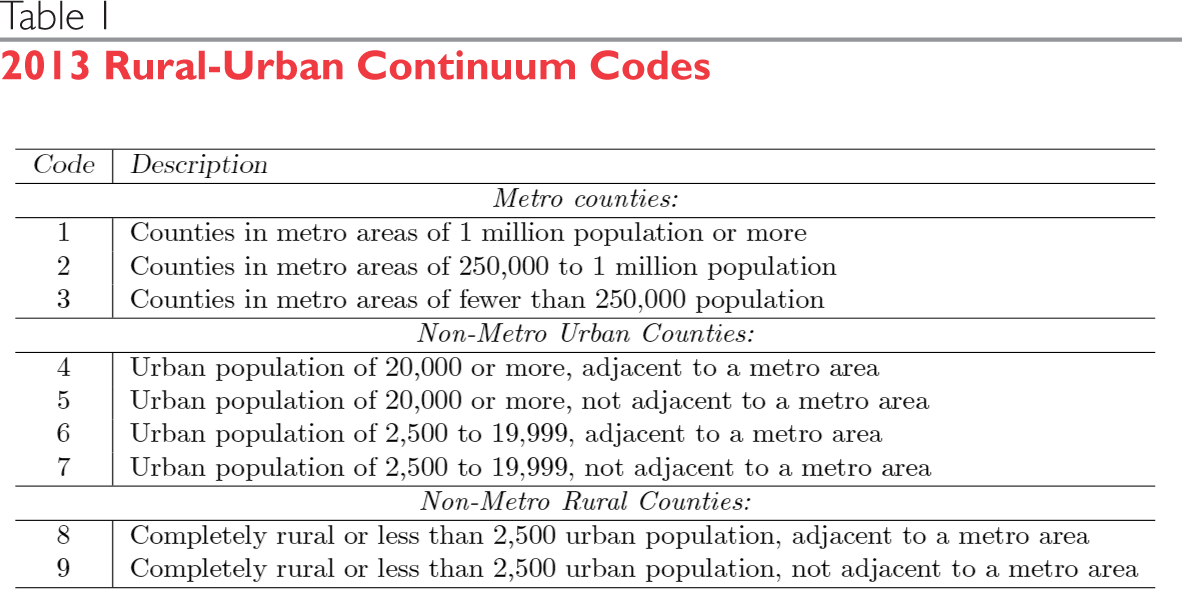
Moreover, we obtained the rural-urban classification of US counties from the Economic Research Service at the US Department of Agriculture.34 We used their 2013 Rural-Urban Continuum Codes (listed in Table 1 of the appendix) to categorize counties as metro, non-metro urban or non-metro rural areas.
Results: Prescription Rates Per 100 Persons

Robust standard errors, clustered at the county-level, are in parentheses
* p < 0.10
** p < 0.05
*** p < 0.01
In addition, the Substance Abuse and Mental Health Services Administration's (SAMHSA) website contains a repository of data from the years 2002 to 2017 on the number of DATA-certified physicians by state who are eligible to provide buprenorphine treatment for opioid dependency.35 We used this repository to scrape data on the number of physicians by state and year who were licensed to administer MAT to either 30 or 100 patients at a time. For the purposes of regression analysis, we demeaned and standardized this data so that coefficients can represent the effect of a one standard deviation increase in MAT-certified doctors on prescription rates.
For our vector of demographic and socioeconomic controls, we procured data on the age, sex, and racial distribution of counties between 2010 and 2015 from the American Community Survey (ACS) while data for the years prior to 2010 was gleaned from the now discontinued USA county census (CenStats USA Counties Database).36 The U.S. census was also used to acquire data on the average status and type of health insurance at the county-year level. Labor market controls such as county level unemployment rates and wages were downloaded from the Quarterly Census of Employment and Wages (QCEW) 2000-2015 database on the Bureau of Labor Statistics website.37
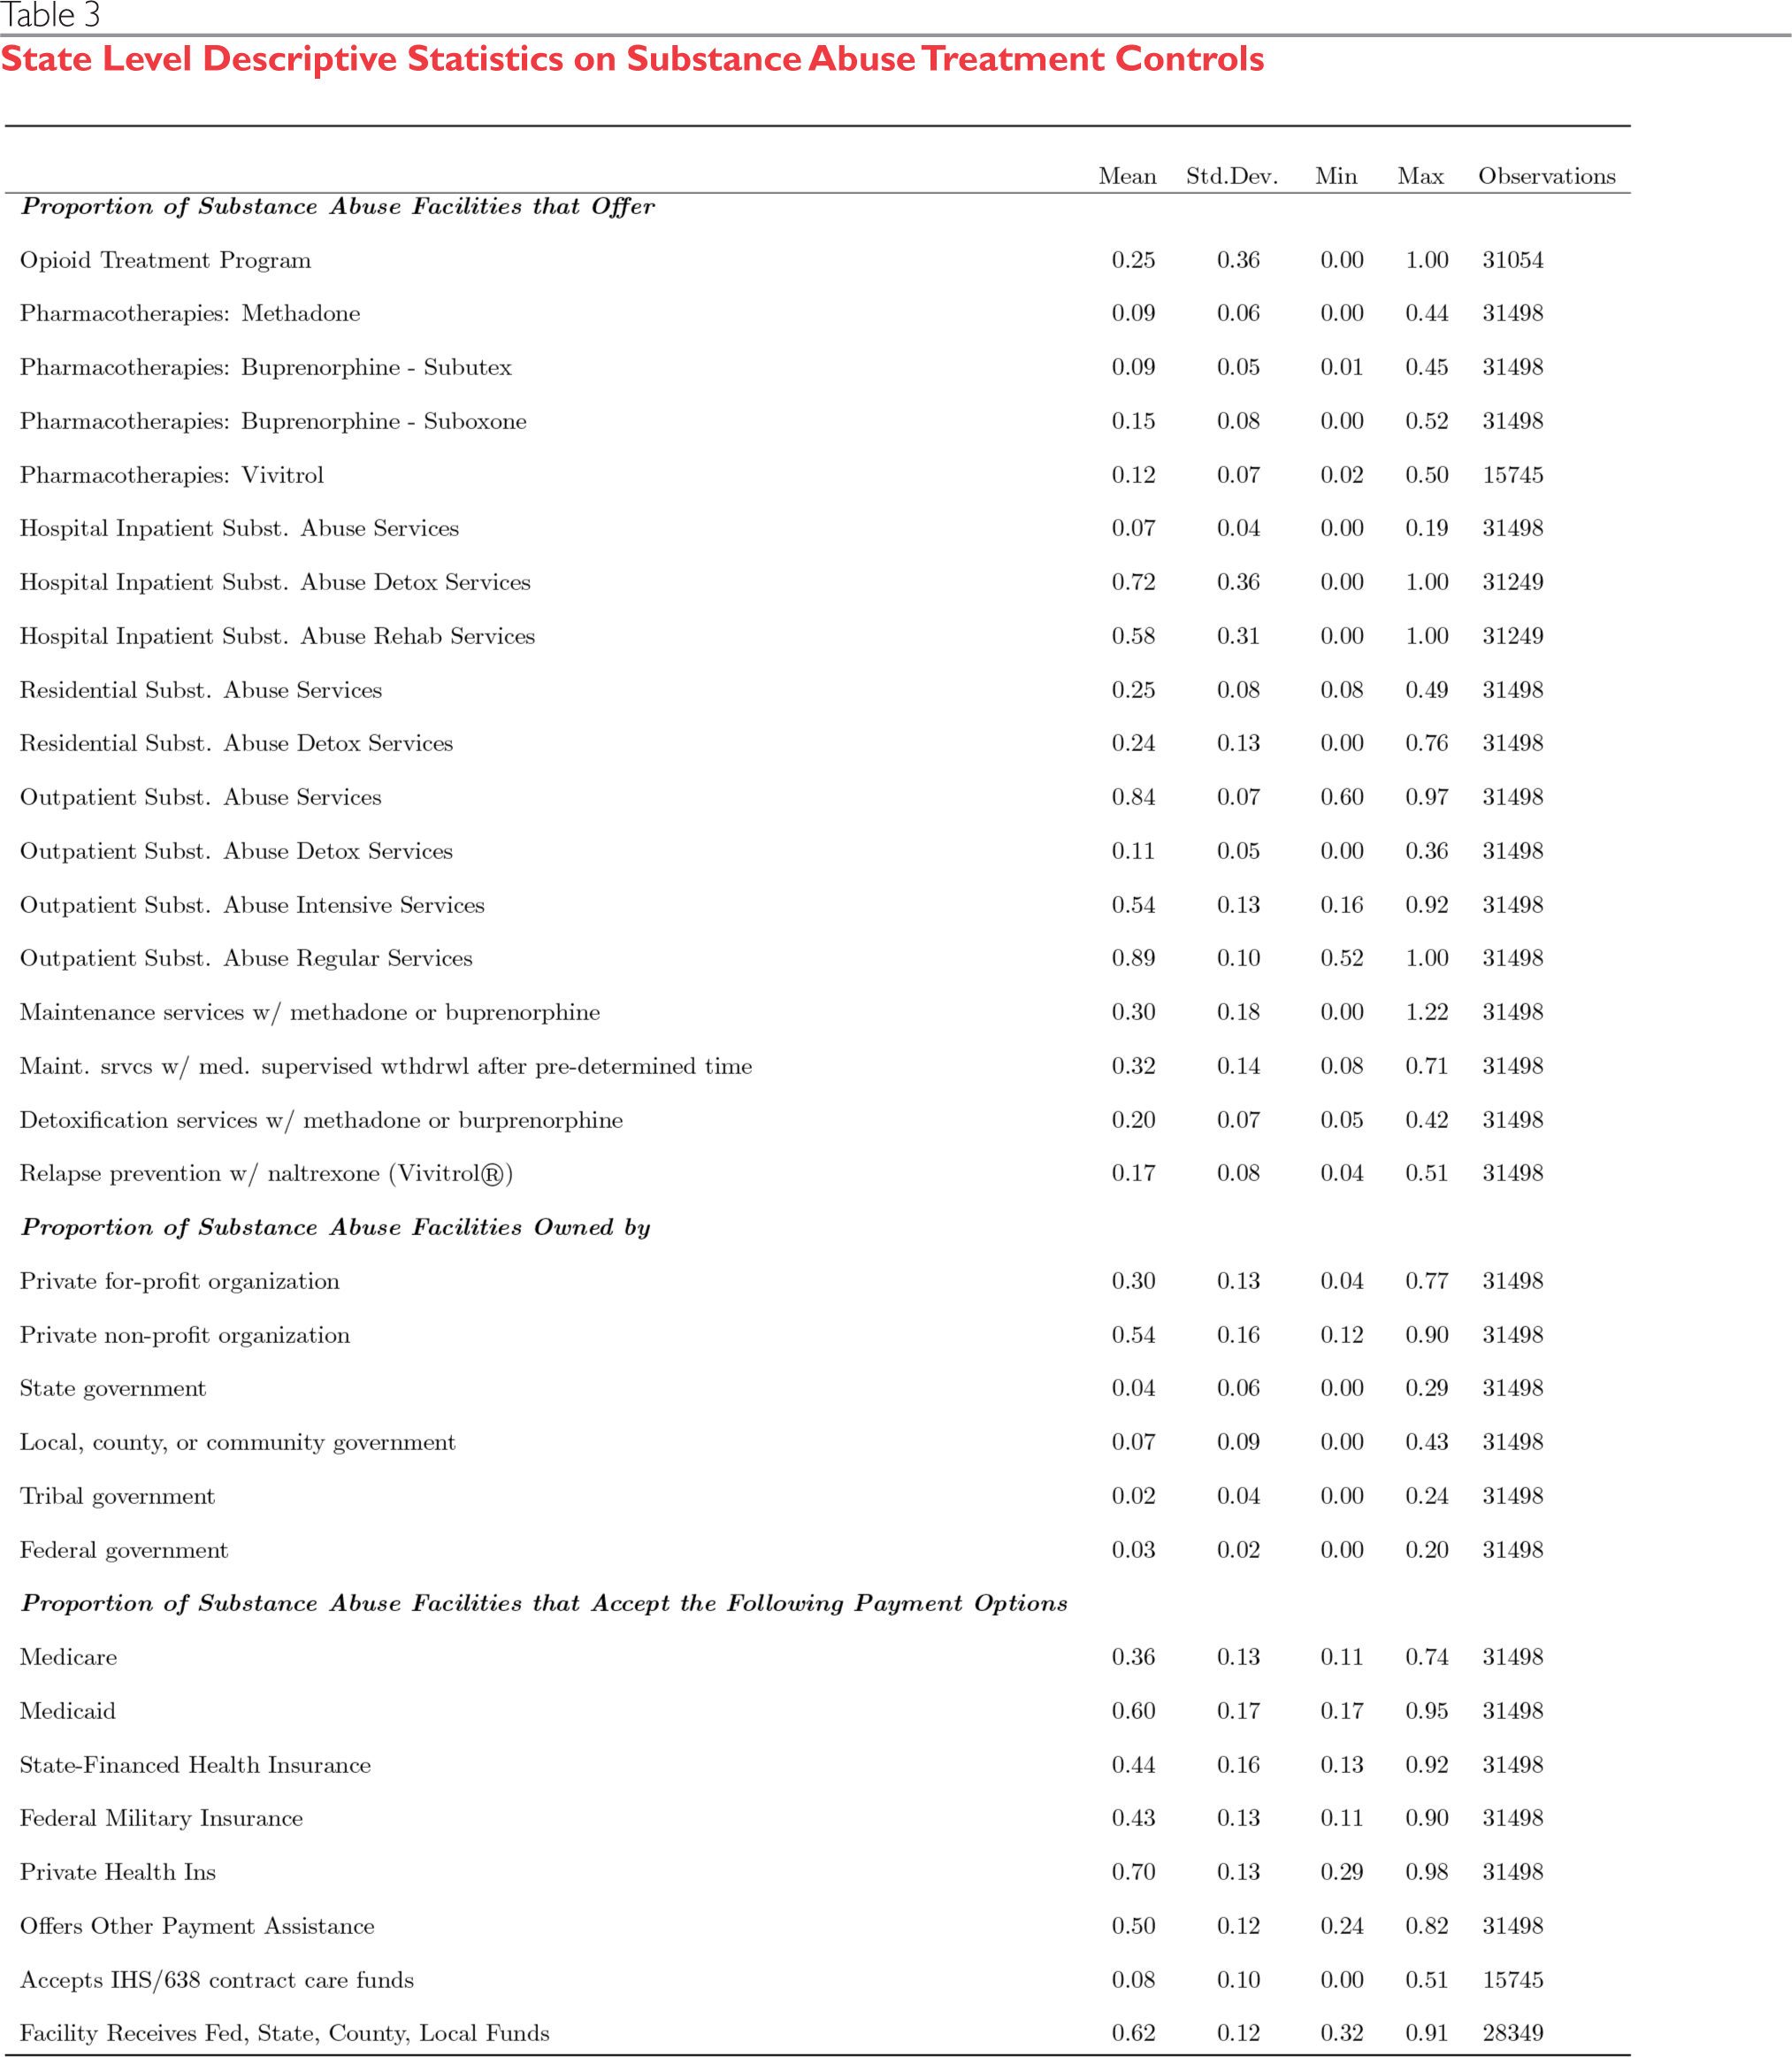
Data on the number of and access to substance abuse treatment centers in the U.S. was acquired from the National Survey of Substance Abuse Treatment Services (N-SSATs), which is compiled by SAMHSA.38 N-SSATS collects information from all substance abuse treatment facilities in the U.S., both public and private. N-SSATs is a helpful source of information on the availability of certain kinds of treatments such as MAT, the number of patients at these facilities, the involvement of different levels of federal and local government in the provision of these services, and the kinds of health insurance plans accepted at these treatment centers.
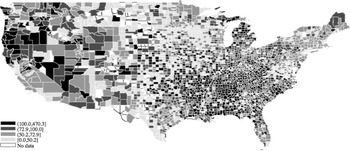
Figure 1 maps county-level variation in prescription rates in 2015. It shows that about a fourth of the US counties have more than one opioid prescription per capita annually, and of these, 69% are non-metro counties.
Geographic Variation in Prescription Rates per 100 Persons, 2015

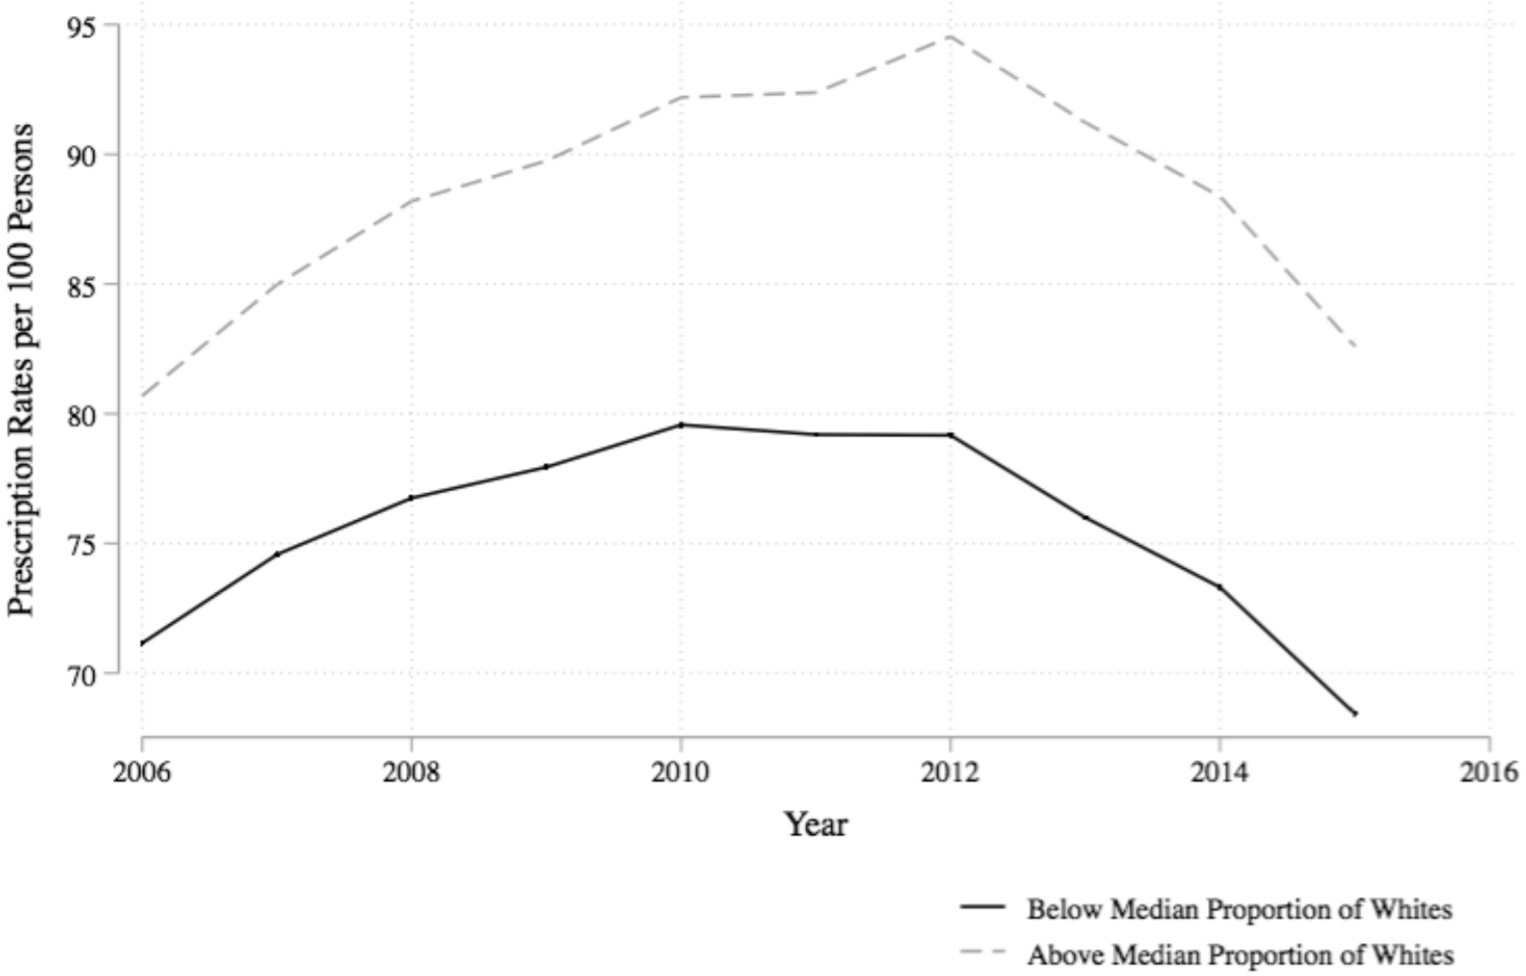
Figure 2 shows opioid prescription rates over time categorized by whether the county had above or below the national median proportion of whites in the population. It shows that counties above the national median not only have a higher level of prescriptions, but are also slower to respond to the downward national trend in prescriptions that seemingly began in 2010. Nonetheless, it is clear that across both categories, prescription rates have consistently declined since 2012 — by about 2.9% annually.39
Variation in Prescription Rates per 100 Persons by Proportion of White Population

4. Empirical Strategy
We exploit the temporal and geographic variation in PDMP legislation — and other opioid-related state interventions — to study the impact on doctors' prescribing practices and on the variation in U.S. opioid prescription rates. Our main specification is as follows:

The outcome of interest, Prescriptionsit, is the prescription rate for county i in year t per 100 persons. δi contains a set of county fixed effects, which account for the time-invariant characteristics of each county, while yt consists of a series of year fixed effects that control for the confounding factors that are fixed in time but vary across counties. State Policiesst is a vector of state-level interventions in response to the opioid crisis. It contains an indicator that equals 1 if state s has a PDMP in year t, and an indicator that equals 1 if state s has a must-access PDMP in year t. Moreover, it contains indicators for whether the state has NALs, GSLs, and Medicaid expansion under the ACA in year t. In addition, the vector also contains the numbers of MAT doctors certified for treating 30 or 100 patients at a time in state s and year t.
Because prescription rates in year t — 1 may influence both the prescription rates and the state policies of year t, we control for Overprescriptionit-1, which is an indicator that equals 1 if the prescription rate of county i in year t — 1 was above the national average, as measured in 2006 (the first year of the dataset). Thus, StatePoliciesst×Overprescriptionit—1 is an interaction between the aforementioned state-level policy interventions, and the county-level lag for over-prescription. It equals 1 when county i has a given policy in place, and was previously prescribing above the national average. Therefore, this interaction is our main variable of interest as it evaluates the treatment effect of a given policy on a county that was previously prescribing above the national mean, relative to counties that were not high-prescribers and/or did not enact a given policy. To identify whether county-level responses to state interventions have rural-urban, racial or income based patterns, we also segment our data by rural-urban, racial and income characteristics, and re-estimate equation 1 on the resulting subgroups.
In addition, we test whether PDMPs in general, and must-access PDMPs in particular, have differential treatment effects based on the frequency at which the PDMP is updated. All states that have a must-access PDMP also have a daily frequency, but not all states that have a daily frequency have must-access PDMPs. This raises two important questions: first, whether amongst non-must access PDMP states, having a daily versus a non-daily PDMP exerts a significant influence over prescription rates; and second, whether the treatment effect of must-access PDMPs is in fact driven not by their must-access nature but by the fact that they update daily. The following two specifications seek to answers these questions.
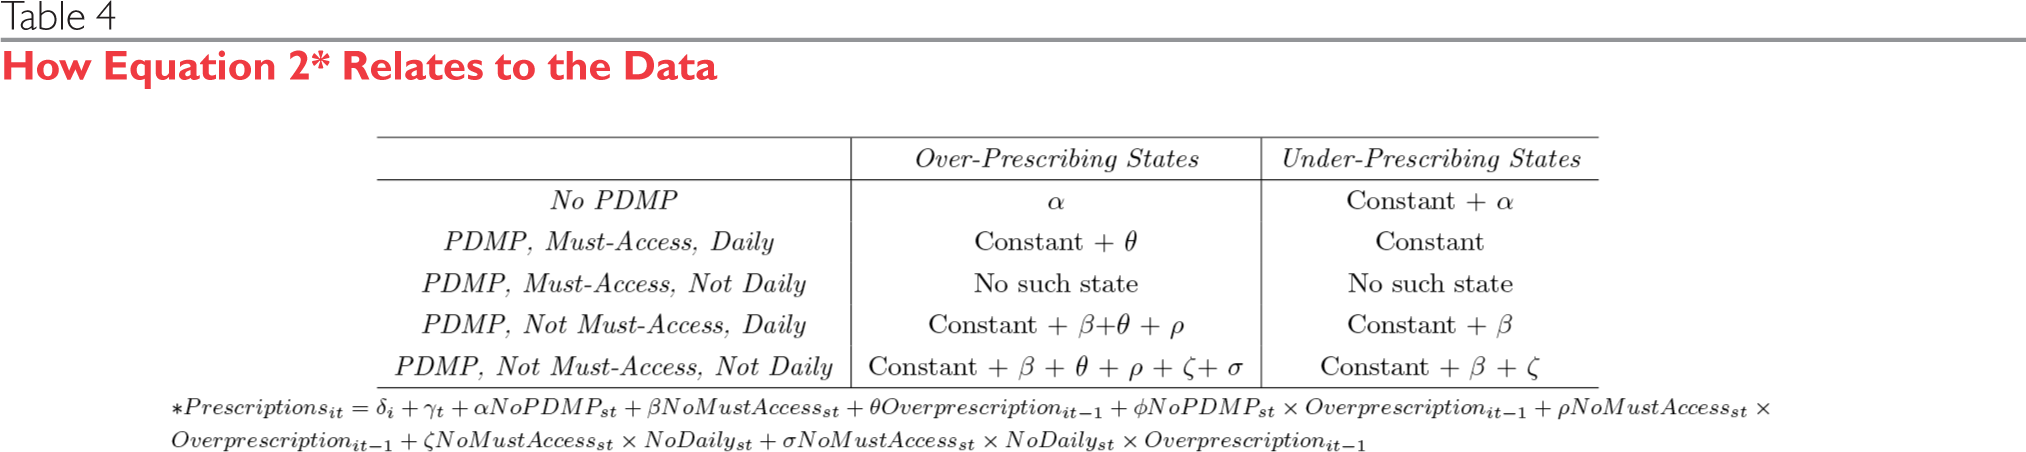
In equation 2, we interact the frequency of PDMP update in a given state with the corresponding PDMP legislations. With this approach, we hope to answer the first of the frequency-related questions: whether having a daily PDMP affects the prescription rates of non-must access states. Table 4 of the appendix lays out how the underlying structure of our data motivated this model; it relates each of the coefficients in Equation 2 to all combinations of No PDMPst, No MustAccessst, Not Dailyst and Overprescriptionit—1, where No PDMPst is an indicator that equals 1 if state s does not have a PDMP in year t, No MustAccessst is an indicator that equals 1 if state s does not have a must-access PDMP in year t, and Not Dailyst is an indicator that equals 1 if state s updates its PDMP at intervals that are longer than daily. σ is the main coefficient of interest because it helps us ascertain whether amongst non-must access PDMPs, having a daily versus a non-daily PDMP is significant, controlling for endogenous historical trends from previous years.

To answer the second question — whether the effect of must-access is confounded by the frequency of PDMP update — we run Equation 3 but only on the subset of counties that have a daily PDMP, to see if states that have must-access PDMPs are significantly different from states that do not have a must-access PDMP, conditional on updating the PDMP daily. The coefficient of interest in this model is

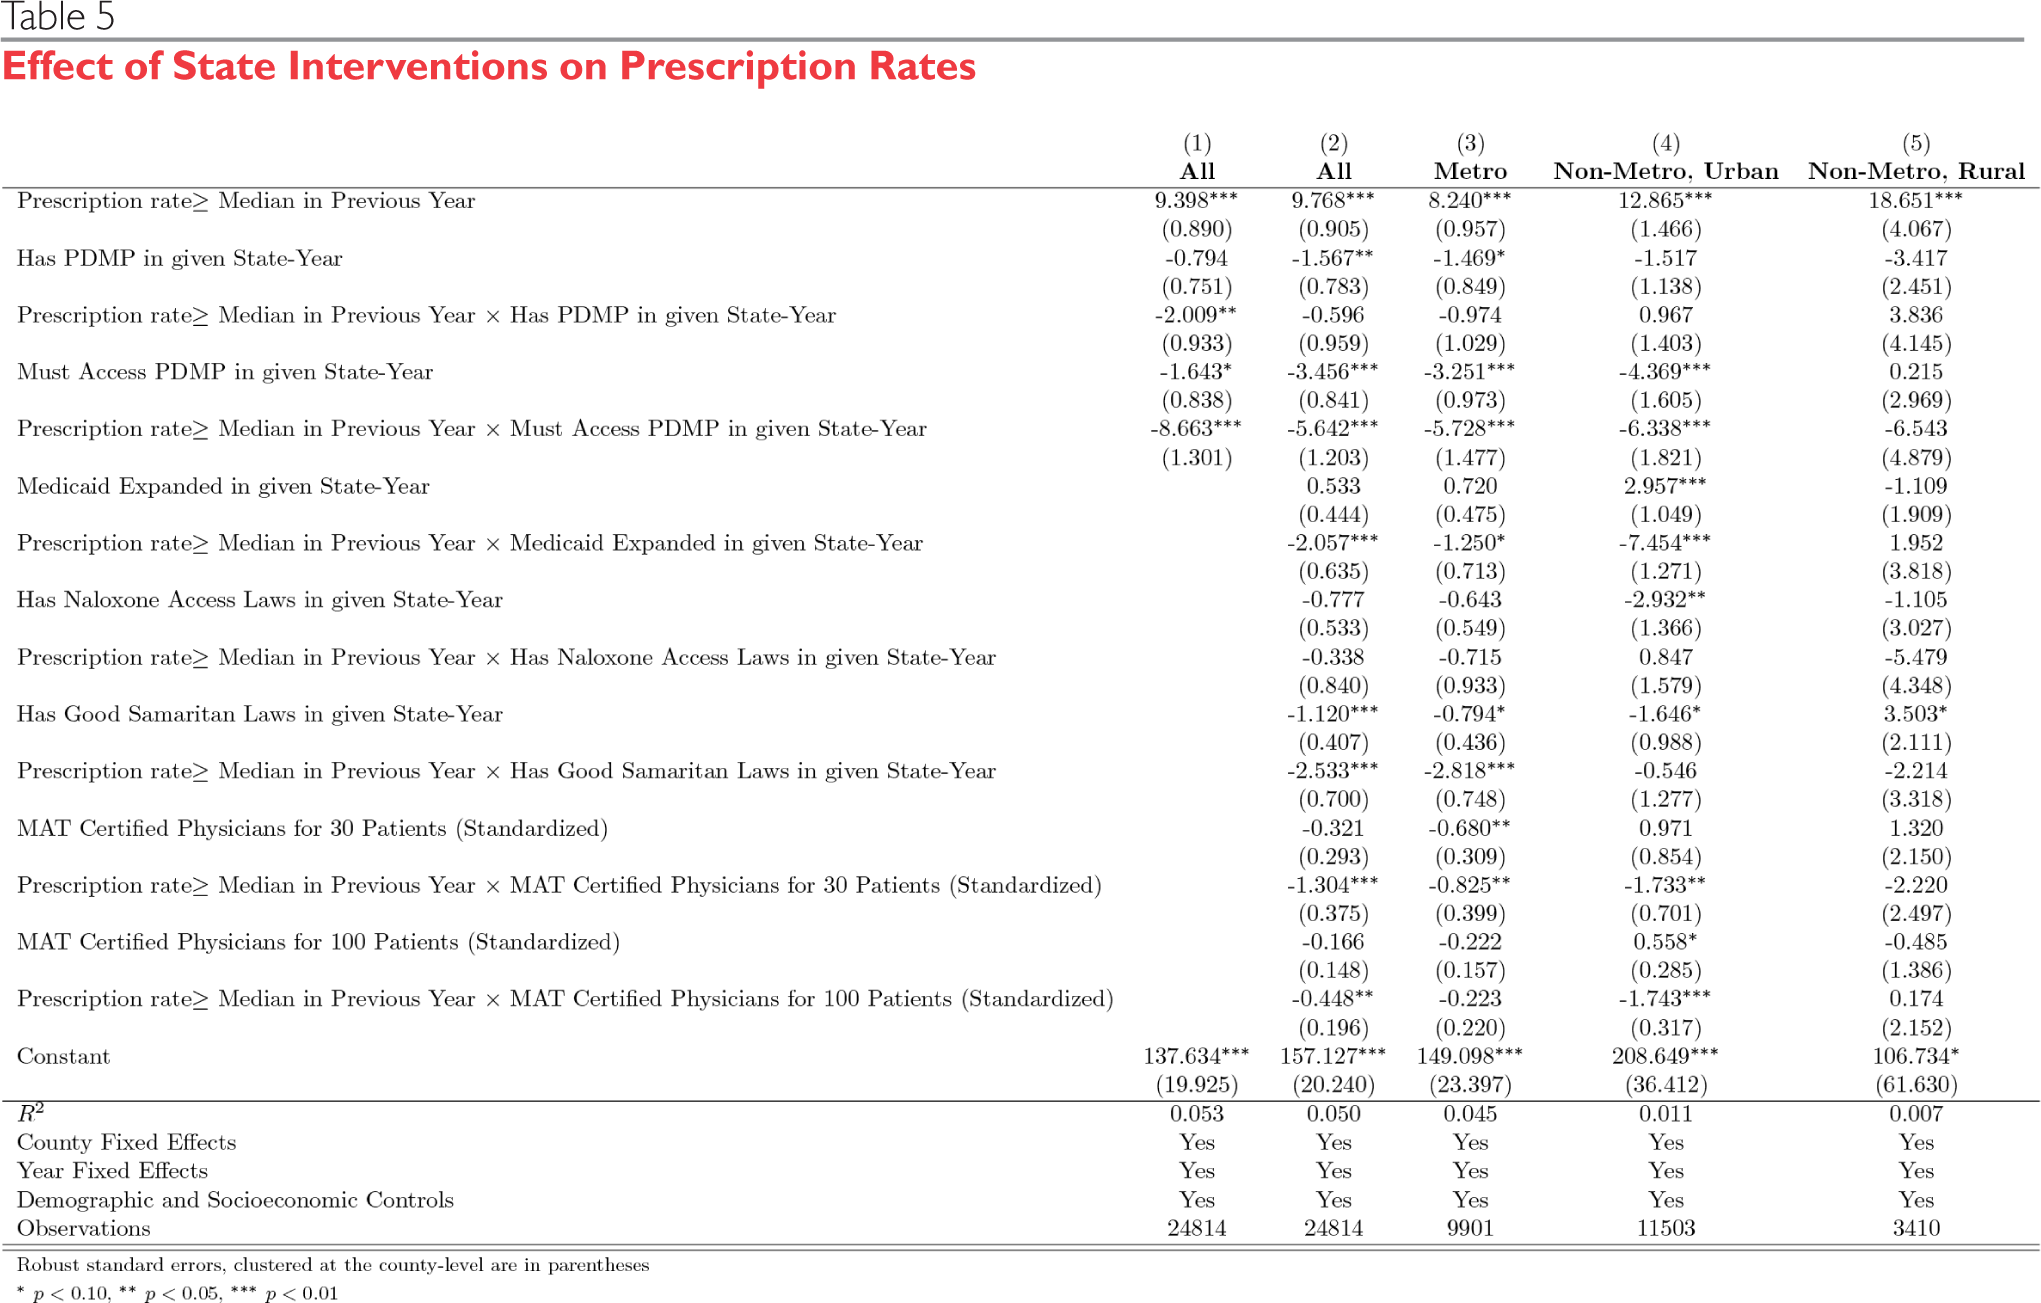
Given that our models already include time and state fixed effects, to prevent them from being over-determined, our main specification does not contain additional socio-economic or demographic controls. However, to check the robustness of our results, we re-run equation 1 after controlling for Xit, a vector of time-varying county-level socio-economic and demographic controls. These include age, sex and race distributions; unemployment rate, income levels, health insurance coverage by type of health insurance, and the characteristics of substance abuse treatment centers. Thus, we re-estimate equation 1 but with the addition of county-specific controls:

All specifications in this paper bear two important features. First, they weight observations by the population of county i to estimate nationally representative policy effects. Unweighted models unduly ascribe equal weights to big and small counties alike, allowing the smaller counties to wield a disproportionately large influence over the results. Second, all specifications report robust standard errors, clustered at the county-level.
5. Results
5.1. Pooled Sample
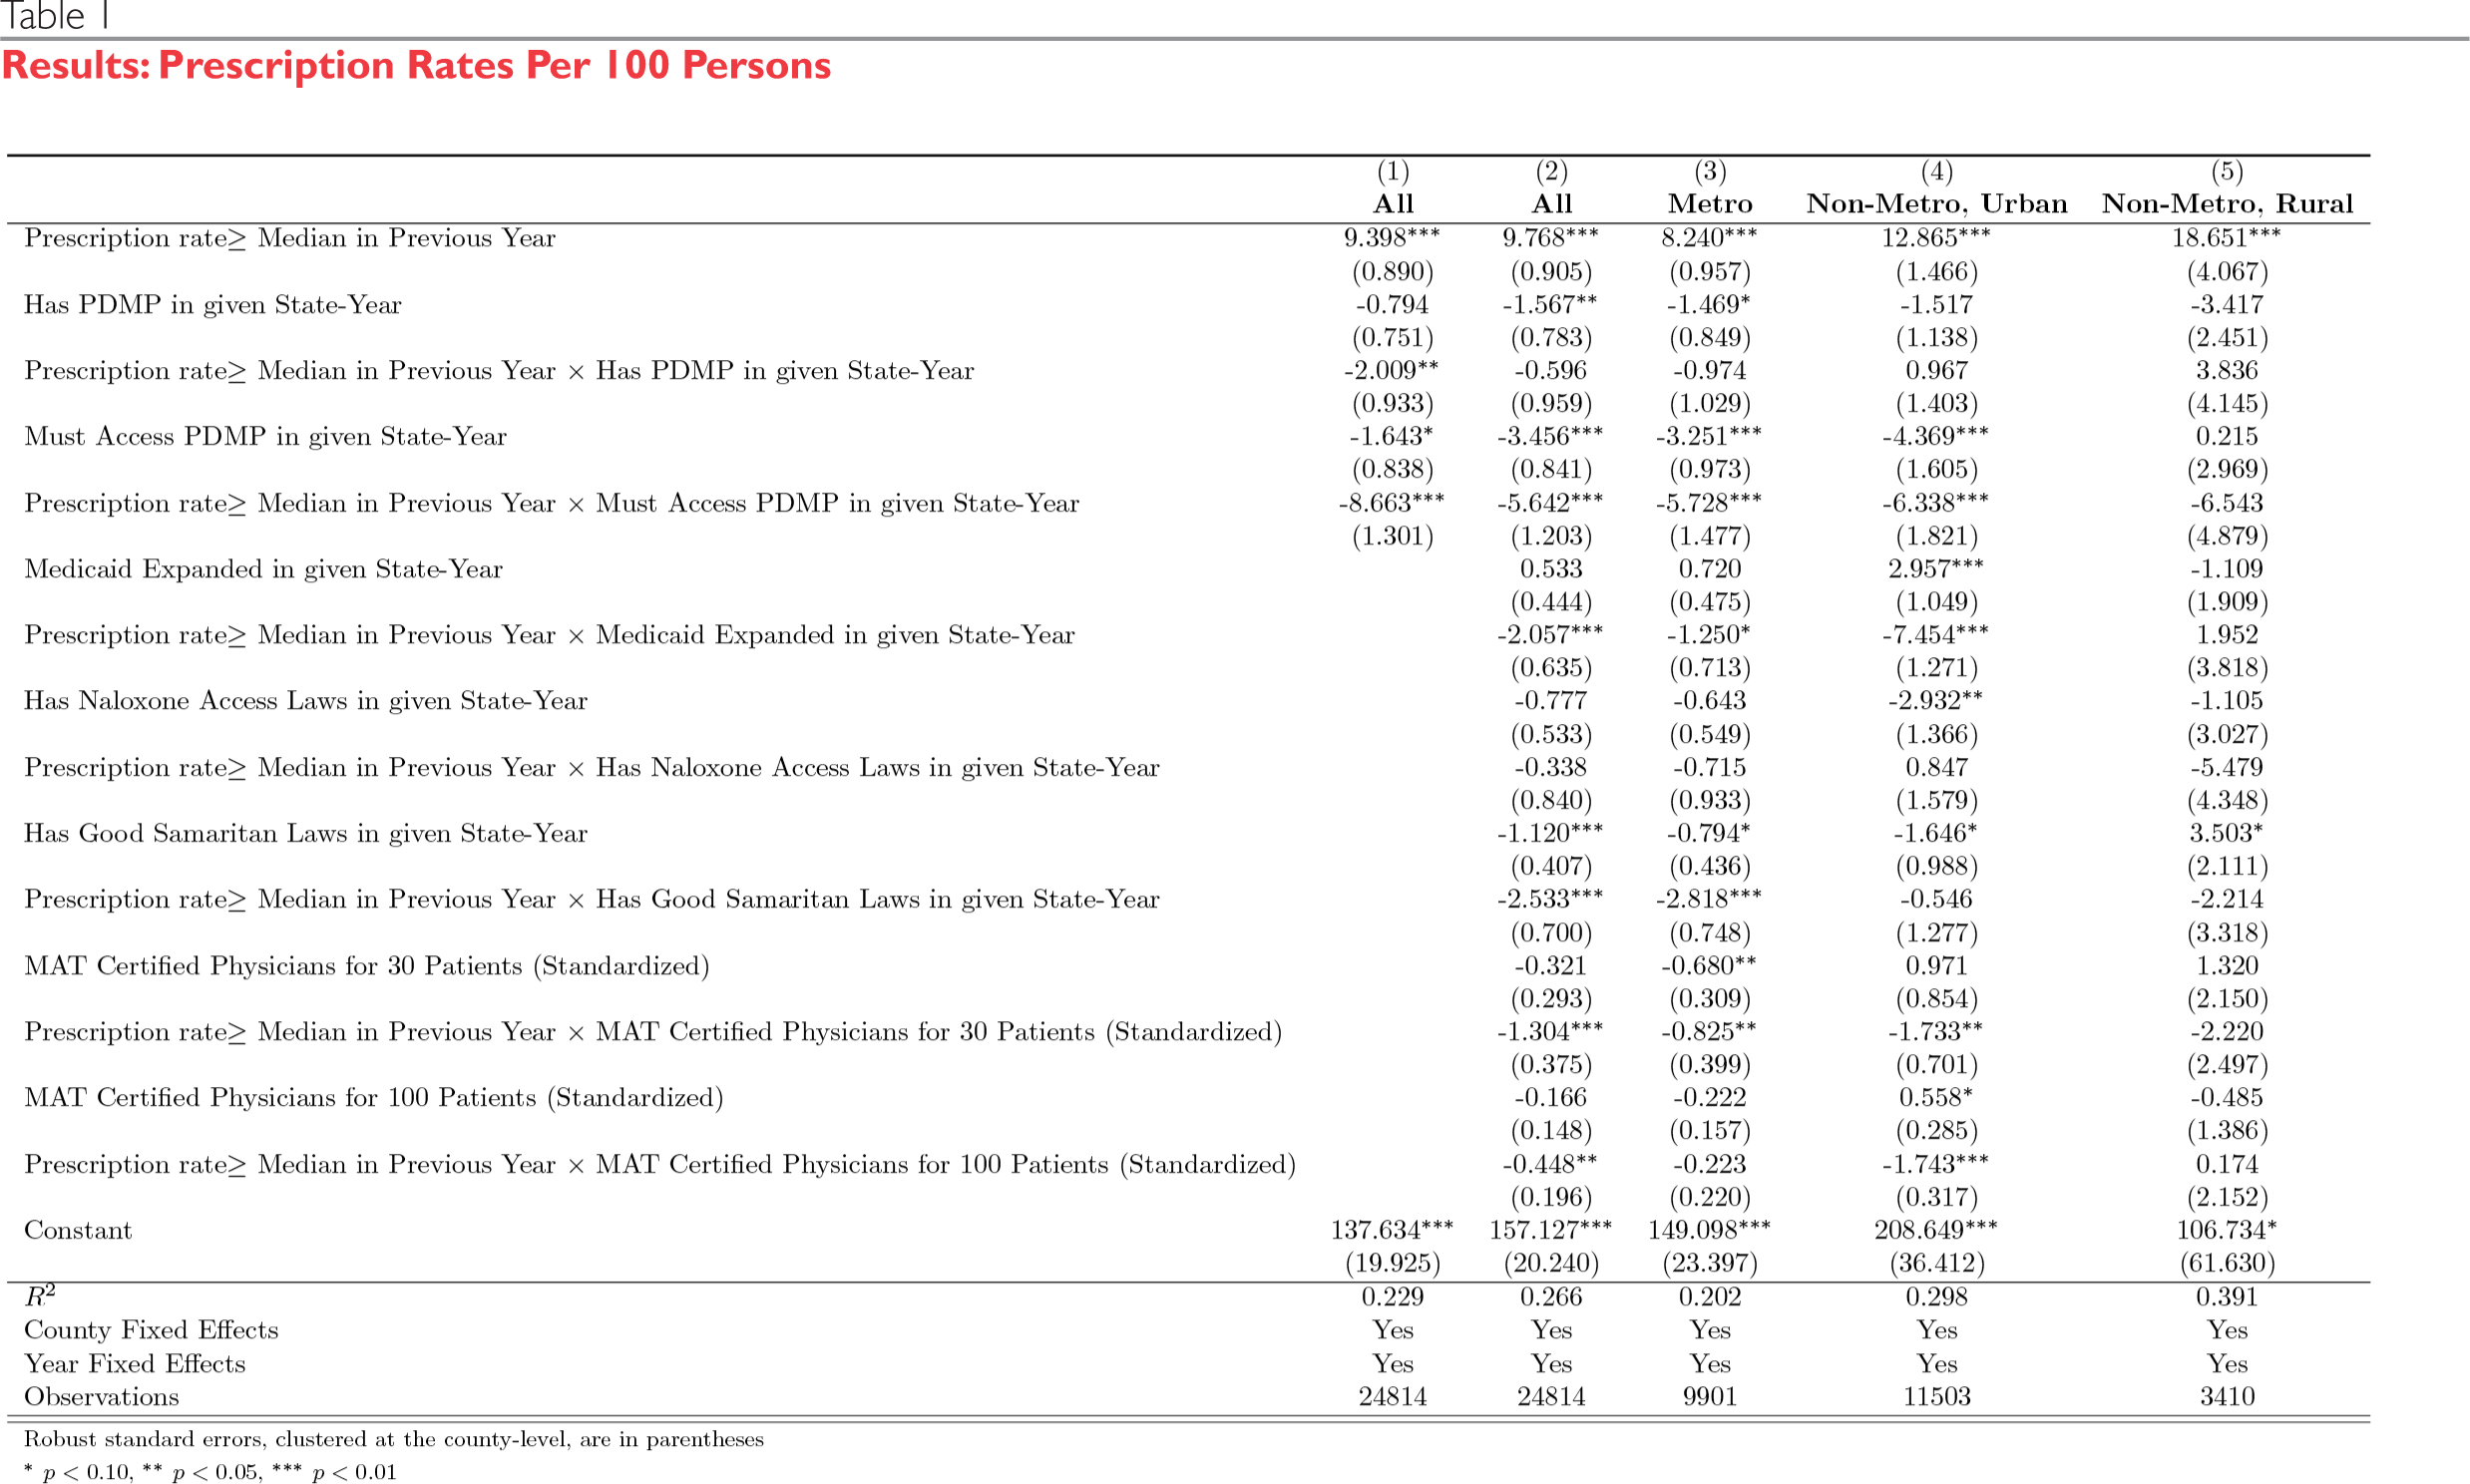
Table 1 shows the effect of a series of state interventions on prescriptions per 100 persons. In column 1, we study the effect of PDMPs only, and must access PDMPs in particular, in isolation of other state policies. Then in column 2, we assess the extent to which the effect of PDMPs is confounded by the omission of other policies that could have changed physicians' approach towards opioids, and that act as important proxies for state responsiveness to the opioid crisis.
Column 1 shows that prescription rates per 100 persons decline significantly by 2.01 if a high-prescribing county has a PDMP in place. More importantly, it shows that if the PDMP is of a must-access kind, the treatment effect is more than 4 times as much: must-access PDMPs are associated with a significant decline of 8.66 prescriptions per 100 persons in high-prescribing counties.
This narrative changes when we control for NALs, GSLs, ACA expansion and MAT certifications, as can be seen in column 2. Simply having a PDMP ceases to have a significant effect on the opioid prescriptions of high-prescribing states. However, having a must-access PDMP contributes to a significant decline of 5.64 prescriptions per 100 persons in high-prescribing counties.
In addition, column 2 also reveals that in high prescribing counties, Medicaid expansion is associated with a significant decline of 2.06 prescriptions per 100 persons; having a GSL is associated with a signifi-cant decline of 2.53 prescriptions per 100 persons; a one standard deviation increase in the number of doctors certified to administer MAT to 30 patients corresponds to a significant decline of 1.3 prescriptions per 100 persons, and a one standard deviation increase in the number of doctors certified to administer MAT to 100 patients corresponds to a significant decline of 0.45 prescriptions per 100 persons. Meanwhile, having a NAL is not significantly associated with a change in prescriptions in low or high prescribing counties. All of the additional policies controlled for in column 2 are jointly significant.
For columns 1 and 2, we are only able to explain, at most 26.6% of the overall variation in prescription rates despite controlling for county and year fixed effects and a series of state interventions pertaining to the opioid crisis.
5.2. Treatment Effects by Rural-Urban Sub-Samples
In columns 3, 4 and 5 of Table 1, we seek to explore whether there are distinct rural-urban patterns underlying county-level responses to state interventions. We divide the full sample into three main categories: metro areas (column 3), non-metro areas but with an urban population of 2,500 people or more (column 4), and non-metro areas that are completely rural or have a negligible urban population of less than 2,500 people (column 5). By re-estimating equation 1 for these subsamples, we find that no state intervention has had any significant effect on the last category, i.e. non-metro rural areas (column 5). Thus, the significance and magnitude of the treatment effects seen in columns 1 and 2 are driven primarily by metro areas (column 3) and non-metro areas with an urban population (column 4).
Within metro and non-metro urban areas (columns 3 and 4), simply having a PDMP is still not significant but having a must-access PDMP is — must-access PDMPs reduce prescriptions per 100 persons in high-prescribing metro and non-metro urban counties by 5.64 and 5.73 respectively. Meanwhile, Medicaid expansion does not have a large or statistically signifi-cant effect on metro areas but it reduces prescriptions per 100 persons in high-prescribing, non-metro urban counties by 7.45. GSLs have a significant effect, albeit only on high-prescribing metro areas, of a reduction by 2.82 prescriptions per 100 persons. More MAT certified doctors for 30 patients also significantly reduce prescriptions per 100 persons in high-prescribing metro and non-metro urban counties by 0.83 and 1.73 respectively. However, MAT certified doctors for 100 patients are only significant in high-prescribing, non-metro urban counties, with a reduction by 1.743, while NAL is not significant at all.
We are only able to explain 20.2% of the variation in prescription rates in metro areas, 29.8% of the variation in non-metro urban areas, and 39.1% of the variation in non-metro rural areas. Hence, in all of these cases roughly two-thirds of the variation in prescription rates still resists explanation.
5.3. Treatment Effects by Income and Race
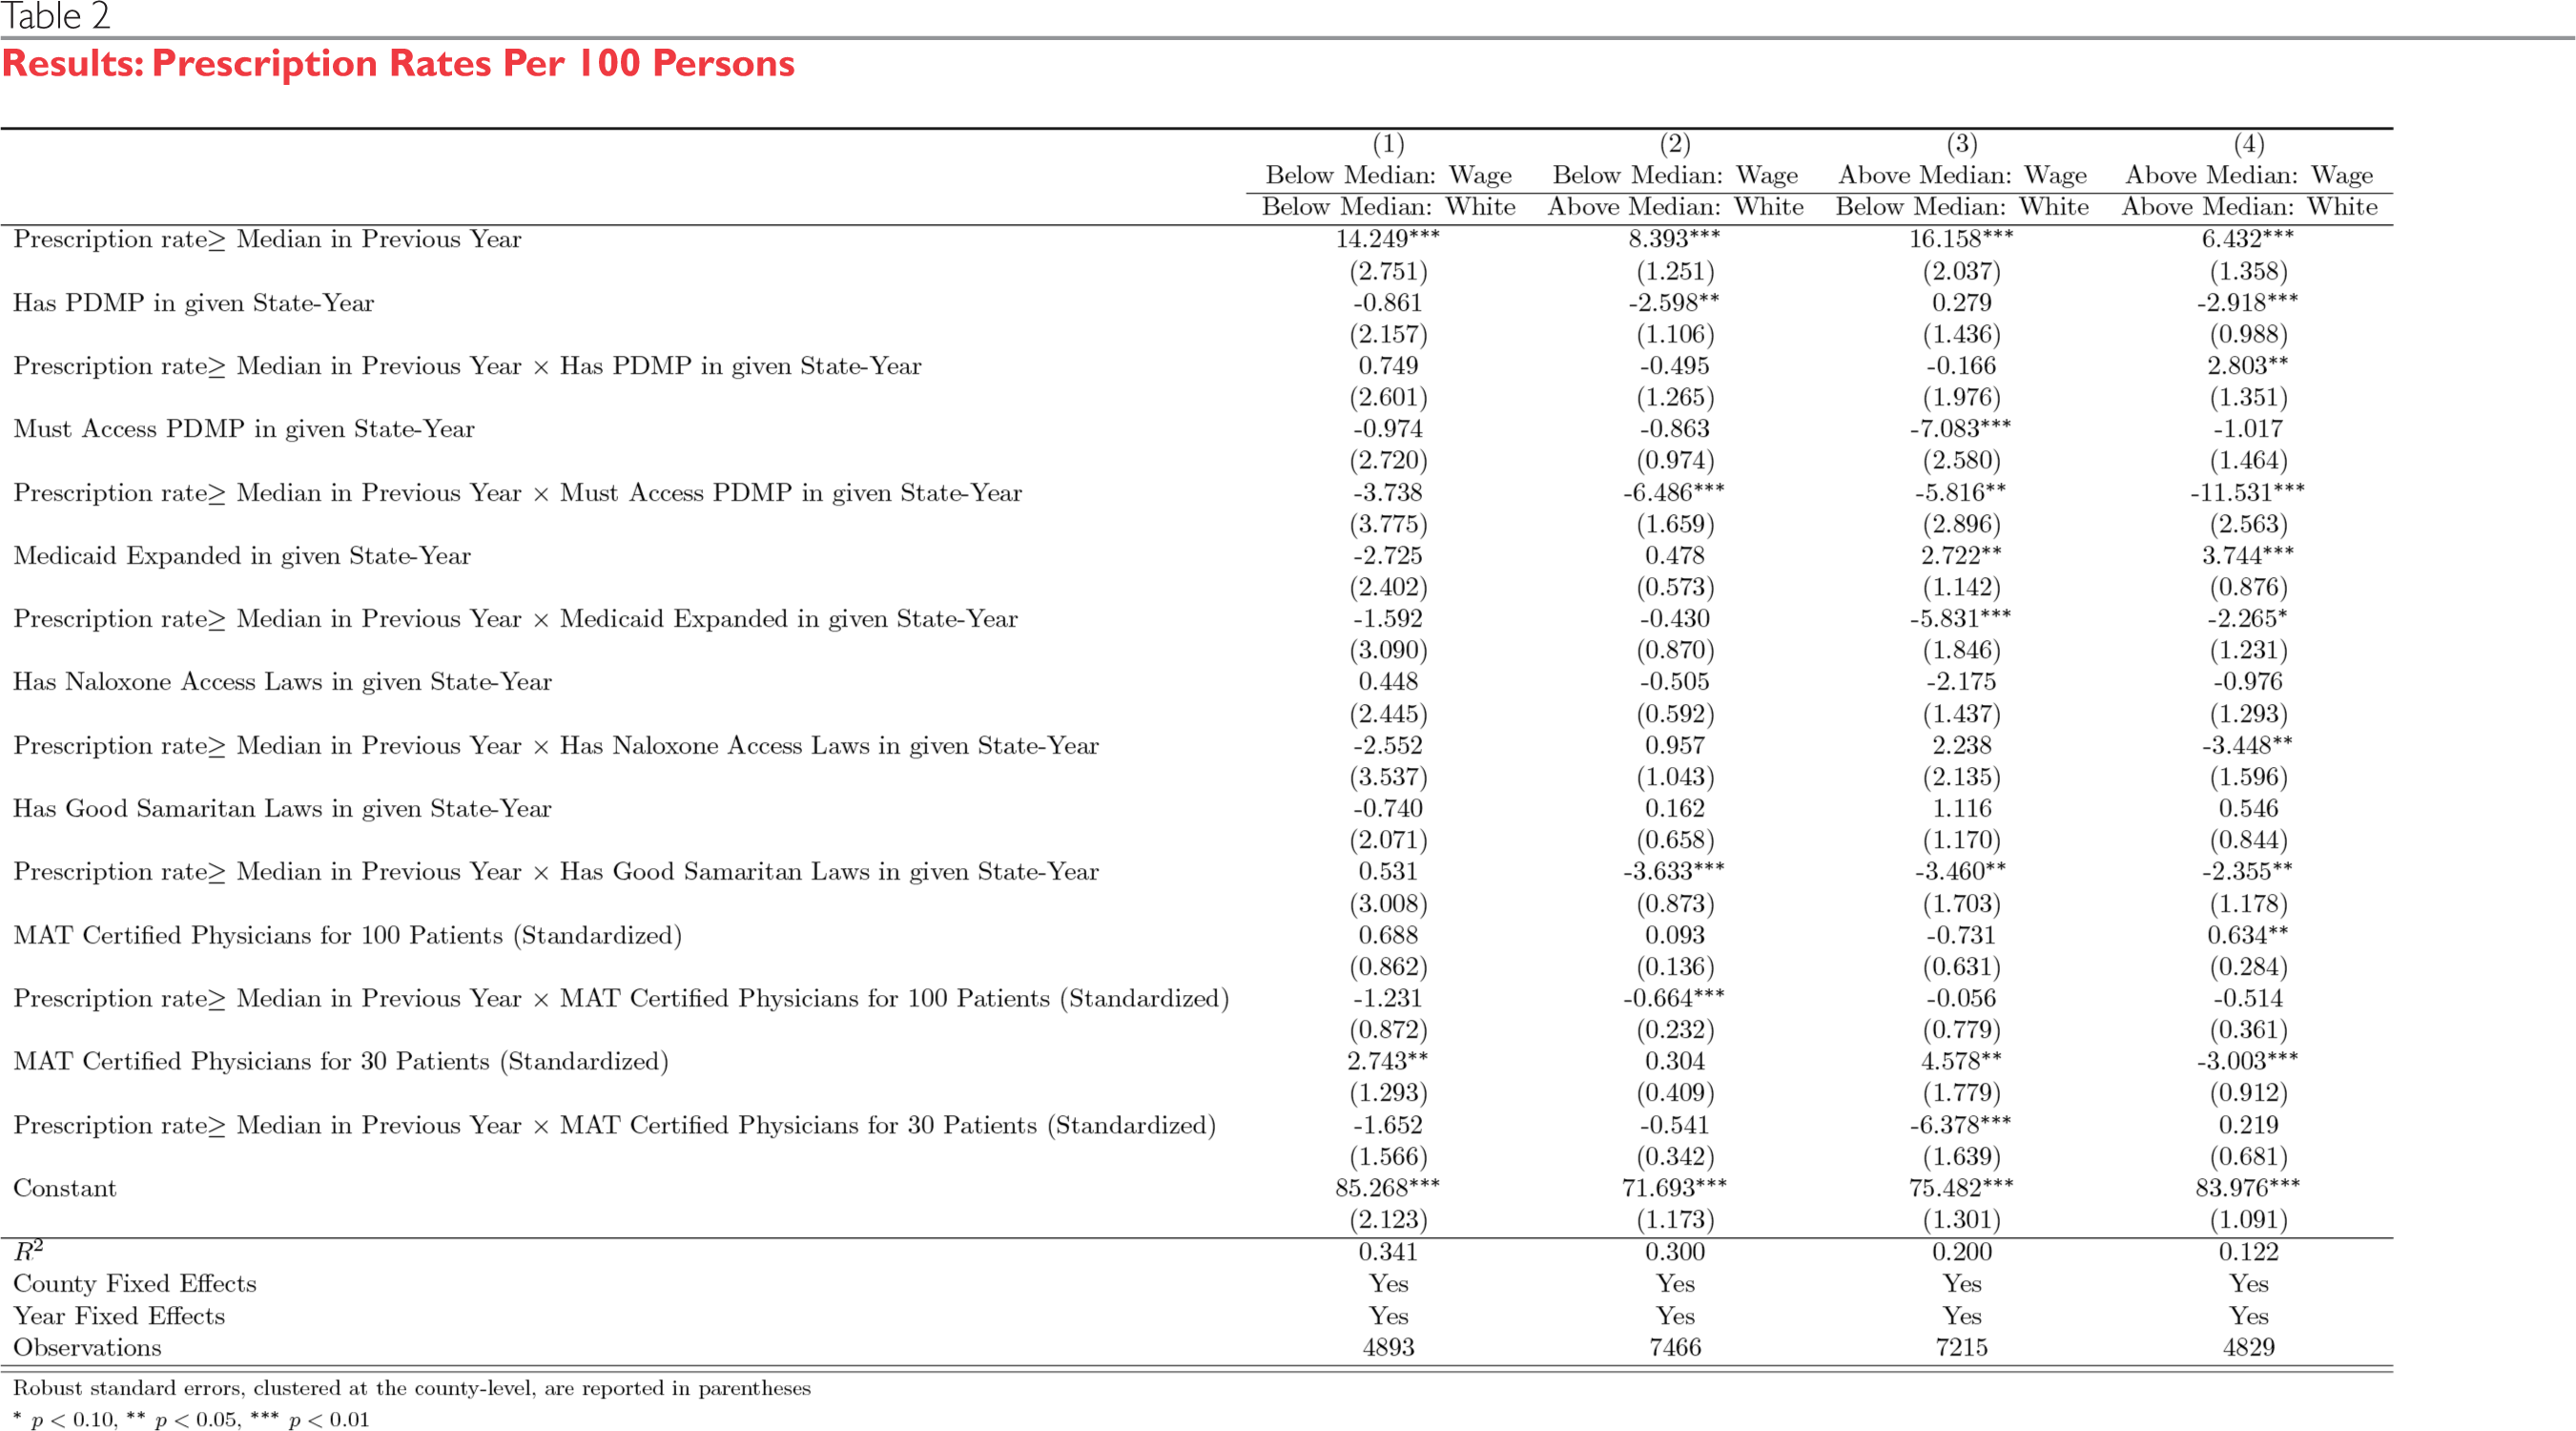
We use 2006 data to identify whether counties are above or below the national median of average weekly wage at the start of the dataset. Similarly we use 2006 data to identify whether counties are above or below the national median in terms of the proportion of their population that is white. We then sort counties into one of four groups, as shown in Table 2: counties that have below median wage and below median whites (column 1), counties that have below median wage and above median whites (column 2), counties that have above median wage and below median whites (column 3), and counties that have above median wage and above median whites (column 4). Table 2 reports whether these groups have shown disparate responses to state interventions overtime.
Results: Prescription Rates Per 100 Persons

Robust standard errors, clustered at the county-level, arc reported in parentheses
* p < 0.10
** p < 0.05
*** p < 0.01
We find that none of the treatment interactions are significant when the county has below median wage and below median proportion of whites (column 1). This means that the poorer and relatively less white counties are entirely unresponsive to state interventions. However, across the remaining subgroups, must-access PDMPs are successful in significantly reducing opioid prescriptions. The coefficient on the must-access interaction is largest in magnitude when the county has above median wage and above median whites (column 4), that is, when the county is predominantly white and affluent. It is second largest in counties that have below median wage and above median whites (column 2), that is, counties that are predominantly white but relatively poor. In comparison to these two groups, the effect of must-access is smaller in magnitude and less significant (p-value < 0.05) in counties that have above median wage and below median whites (column 3), that is, counties that are more affluent but have fewer whites. In so far as the opioid abuse disorder is a disproportionately white disease, it stands to reason that counties with a greater proportion of whites would be more responsive to state interventions, and that within these counties, the more affluent ones would show a larger treatment effect than their poorer counterparts, especially when we consider that poorer counties are likely to be dealing with more deeply entrenched socioeconomic and health problems. But our results are also consistent with the disparate neglect of poorer and of minority counties that have experienced above average prescribing in the past.
Similarly, GSLs also have a consistently negative impact on the prescription rates of all three of these subgroups. However, the results for other interventions are more mixed: Medicaid expansion is only significant if the county has above median wage and below median whites (column 3); PDMPs, without the must-access condition do not reduce prescription rates; NALs are only significant if the county has above median wage and above median whites (column 4); MAT certification for 100 people is only signifi-cant if the county has below median wage and above median whites (column 2) and MAT certification for 30 people is only significant if the county has above median wage and below median whites (column 3).
The model explains 34.1% of the variation in column 1, 30% of the variation in column 2, 20% of the variation in column 3, and 12.2% of the variation in column 4. Thus, in all of these specifications, a sizable proportion (about two-thirds) of the variation remains unexplained.
5.4. PDMP Frequency
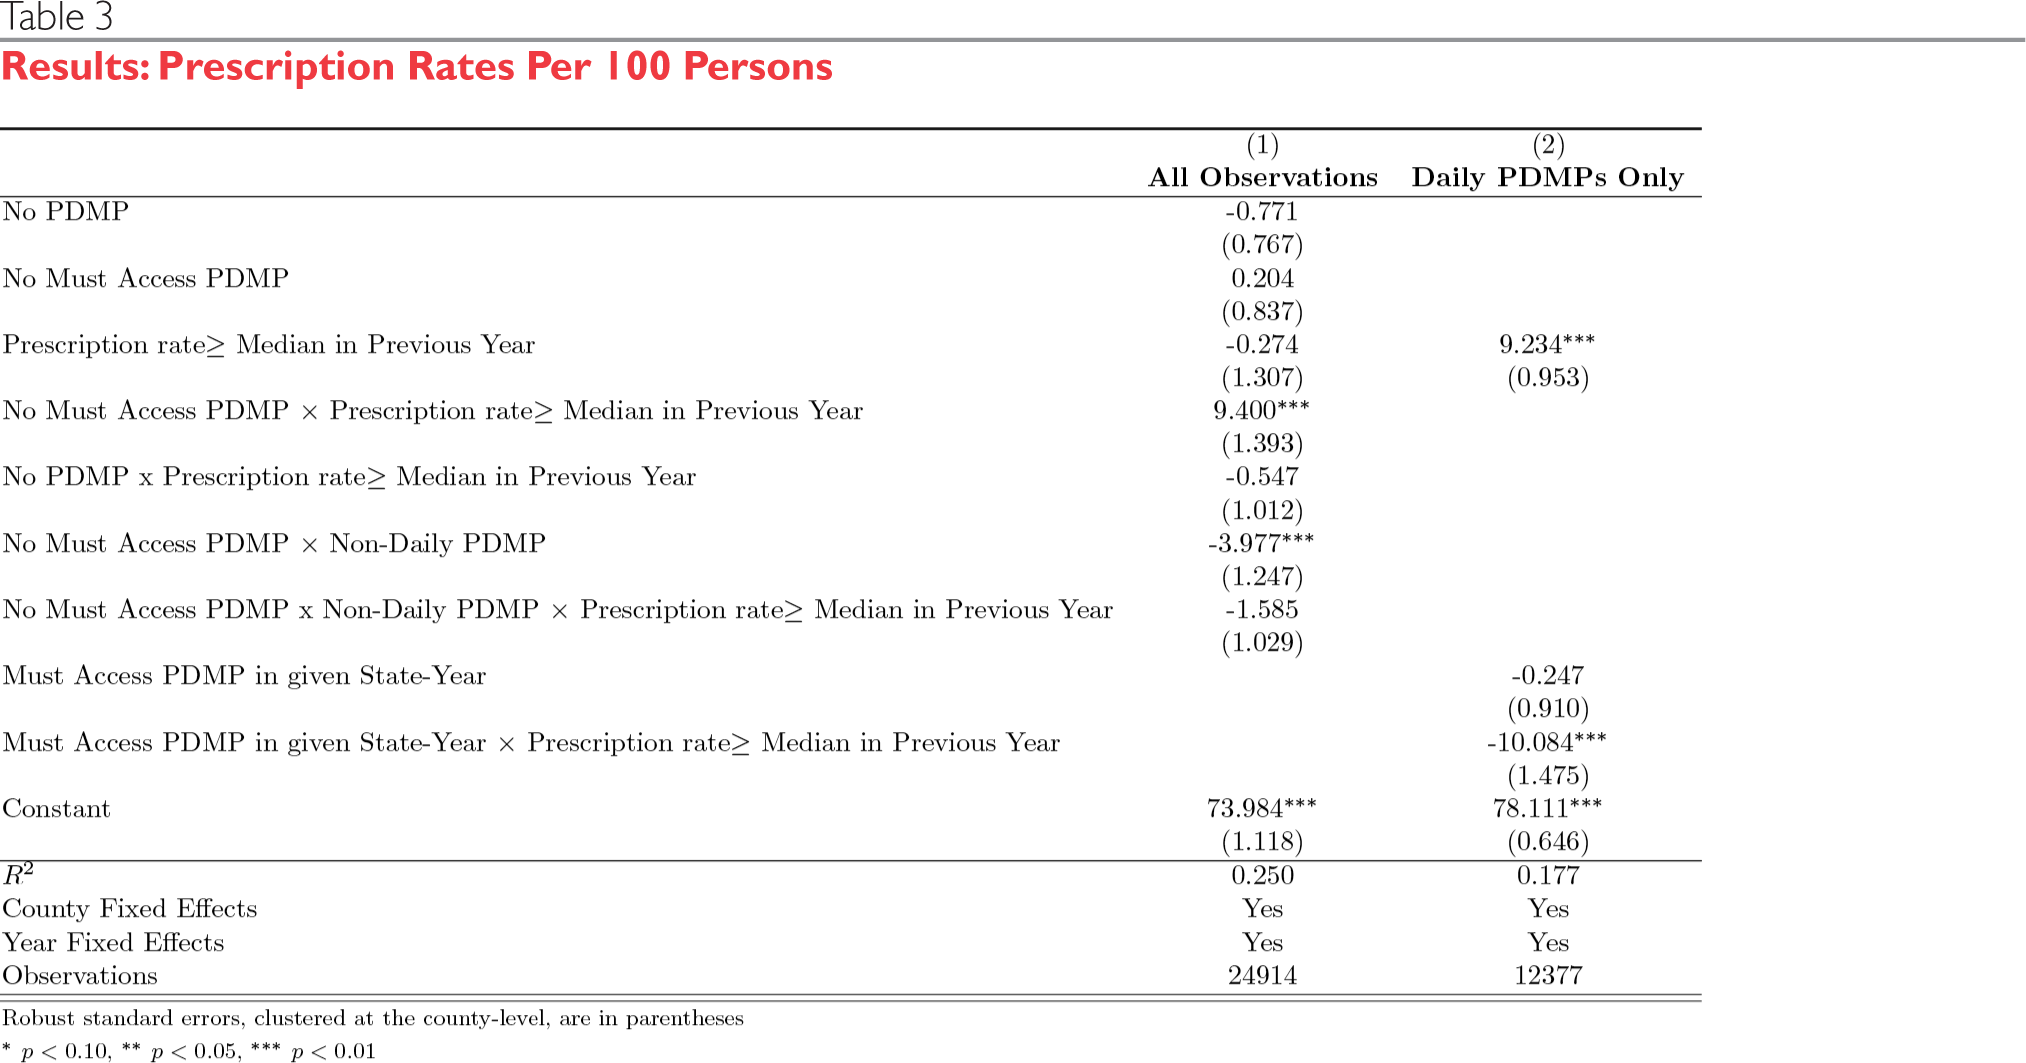
Table 3 shows our tests of whether requiring daily updating of PDMP impacts prescribing rates. Results from Equation 2 are in column 1 and results from Equation 3 are in column 2 of Table 3. The results show that our fully interacted “non-daily” term from Equation 2 is insignificant. This implies that amongst high-prescribing, non-must access PDMP states, having a daily versus a non-daily PDMP yields no signifi-cant influence on prescription rates relative to those states with required daily PDMP reporting.
Results: Prescription Rates Per 100 Persons

Robust standard errors, clustered at the county-level, are in parentheses
* p < 0.10
** p < 0.05
*** p < 0.01
Conversely, we can see in column 2 (which is limited to states with required daily PDMP reporting) that amongst high-prescribing daily frequency states, having a must-access PDMP significantly reduces prescription rates by 10.08 as compared to non-must-access daily states. This suggests that the impact of must-access PDMPs is not confounded by the omission of the frequency of PDMP update from our main specifications. If daily PDMPs were indeed driving the entire treatment effect of must-access, there would have been no significant difference within daily PDMPs based on the must-access nature of PDMPs. Thus, we can say that must-access PDMPs still drive the reduction in prescription rates, even after the frequency of PDMP updates is controlled for.
5.5. Robustness
Table 5 of the appendix shows our results for Equation 4, in which we add demographic controls to the main specification to assess whether our estimates are robust to the inclusion of the time-varying characteristics of US counties. These controls not only account for the socioeconomic composition of counties but also for the nature and accessibility of substance abuse treatment centers in the corresponding state. We find that despite the addition of such a comprehensive vector of county and state level controls, our results remain consistent with our findings in the main specification (Table 1).
As shown in previous sections, non-mandatory PDMPs cease to matter when other state policies are controlled for. Meanwhile, must-access PDMPs only yield an influence over prescription rates in metro and non-metro urban areas but not in their rural counterparts. The same is true for all other state policies — none of them have any significant effect on the prescriptions of rural areas but they significantly reduce prescription rates in metro and non-metro urban areas.
6. Conclusion
Our analysis reveals a number of important results. First, we find that PDMPs are only effective if they obligate doctors to check for patient history on the PDMP prior to filling out a prescription. However, the frequency at which a state requires the PDMP to be updated is not a significant determinant of their effectiveness. Second, even policies that are seemingly unrelated to doctors (NALs, GSLs, MAT certifications and Medicaid expansions) are significantly associated with reductions in prescriptions. This may be because these policies are a proxy of states' commitment to mitigating the opioid crisis, and influence doctors' overall approach to pain management by generating a greater sense of awareness and urgency around a crisis that is, in part, attributed to doctors themselves. Third, we find that even after controlling for year and county fixed effects, and a comprehensive set of county-specific controls, a majority of the variation in prescription rates resists explanation; overall R2 for most models we estimated ranges between 20% to 40%. It is possible that our finding of large residual unexplained variation is due the omission of unobserved factors. But, as Carlson et al. (2013) have argued, residual variation of this magnitude has been unparalleled by other types of medications and is unique to opioid prescriptions.40
Similarly, analyzing must-access from the lens of class and race, we find that must-access PDMPs are not effective in counties that are below the national median in terms of average wage and proportion of white population. Conversely, must-access PDMPs have the largest and most significant effect on prescription rates in counties that are above the national median in terms of average wage and proportion of white population, followed closely by counties that are below the national median in wage but above the national median in proportion of whites. This means that richer and whiter counties are most responsive to state interventions whereas poorer and less white counties have been relatively unresponsive.
We have established evidence for some of the substate heterogeneity driving this variation by considering three factors: extent of urbanization, average wage and racial distribution. With respect to urbanization, we find that all state policies we considered have only been effective on non-rural populations. In particular, while our results confirm and reinforce a big and statistically significant impact of having must-access PDMPs, they also highlight that even must-access PDMPs have, thus far, failed to have an effect on predominantly rural areas. This suggests that while, on average, we may see encouraging effects of state interventions on the pooled sample of all U.S. counties, one specific subset of these counties — non-metro rural areas — is systematically resisting reform.
Similarly, analyzing must-access from the lens of class and race, we find that must-access PDMPs are not effective in counties that are below the national median in terms of average wage and proportion of white population. Conversely, must-access PDMPs have the largest and most significant effect on prescription rates in counties that are above the national median in terms of average wage and proportion of white population, followed closely by counties that are below the national median in wage but above the national median in proportion of whites. This means that richer and whiter counties are most responsive to state interventions whereas poorer and less white counties have been relatively unresponsive.
These findings should be taken with a grain of salt because our study suffers from a number of important limitations. First, we lack data on where these opioids are consumed — we only have data on where they were prescribed. If patients are visiting physicians across county or state boundaries, we may be misattributing disproportionately high prescription rates to areas that are actually serving multiple adjacent counties. Second, we don't have data on the amounts prescribed, the duration of prescription or the type of opioids prescribed, which would have been helpful in providing a more comprehensive understanding of the patterns underlying prescription rates. Third, we're unable to empirically investigate whether there is variation at the individual-level due to the absence of data on individual physicians' prescribing practices.
Acknowldegements
The authors thank Abbe Gluck and Kate Stith for helpful comments.
Appendix
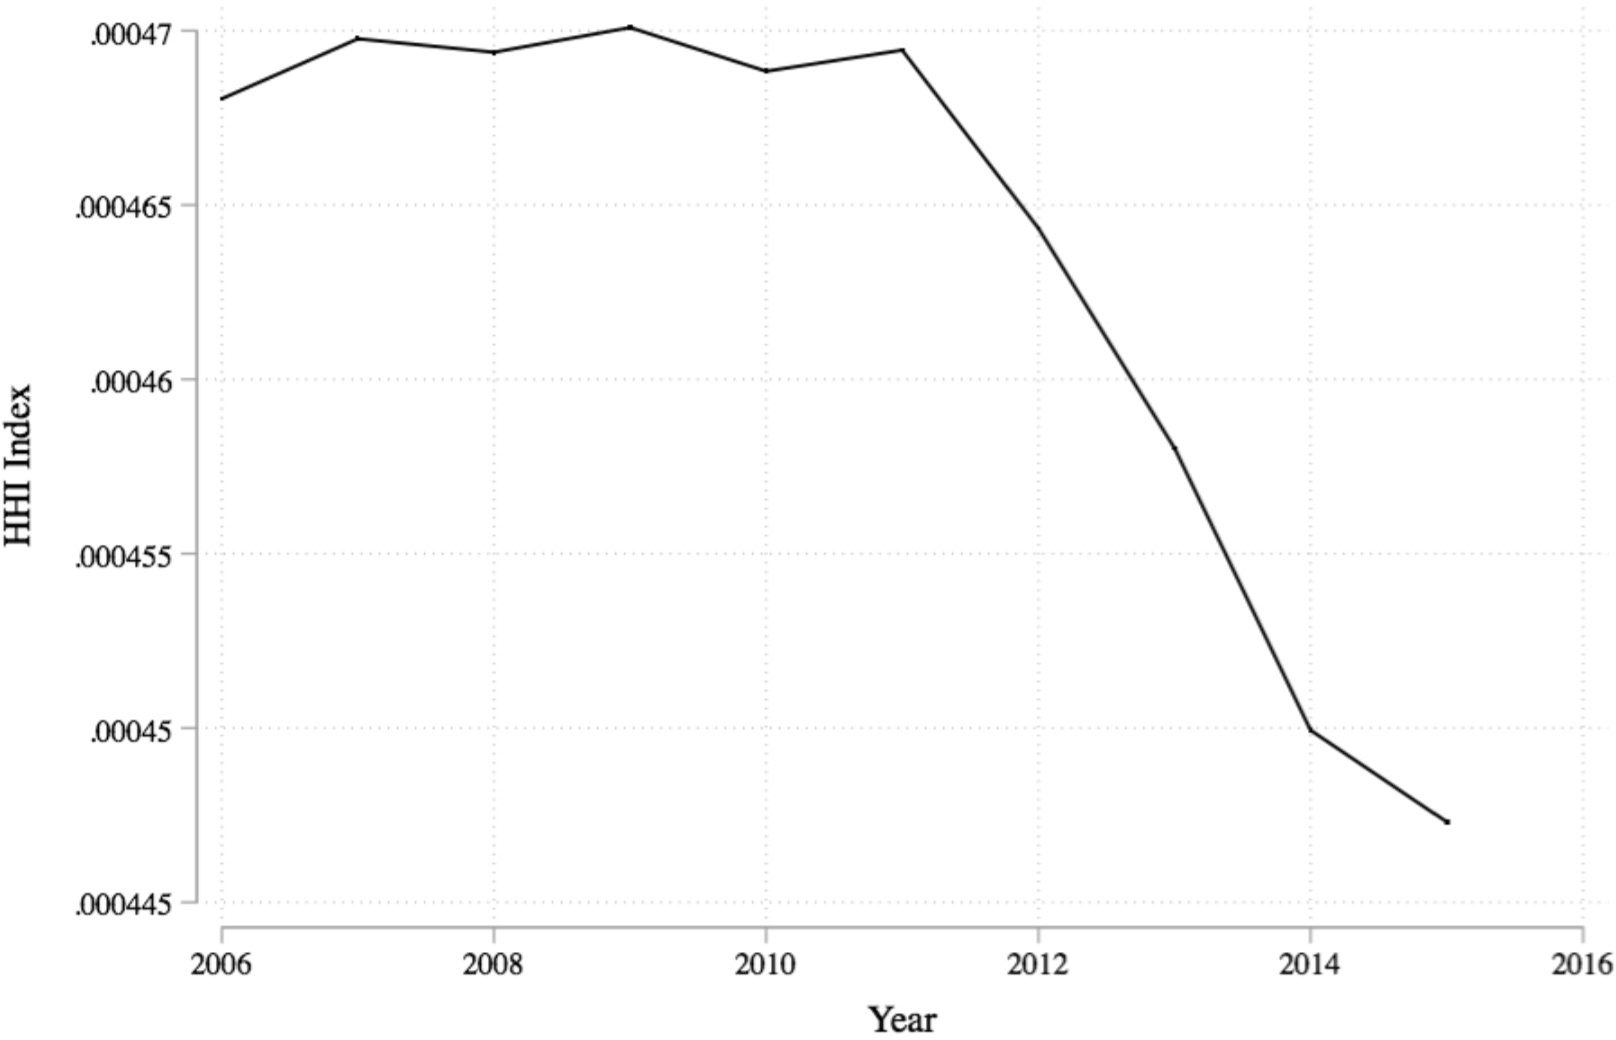
Herfindahl-Hirschman Index

2013 Rural-Urban Continuum Codes

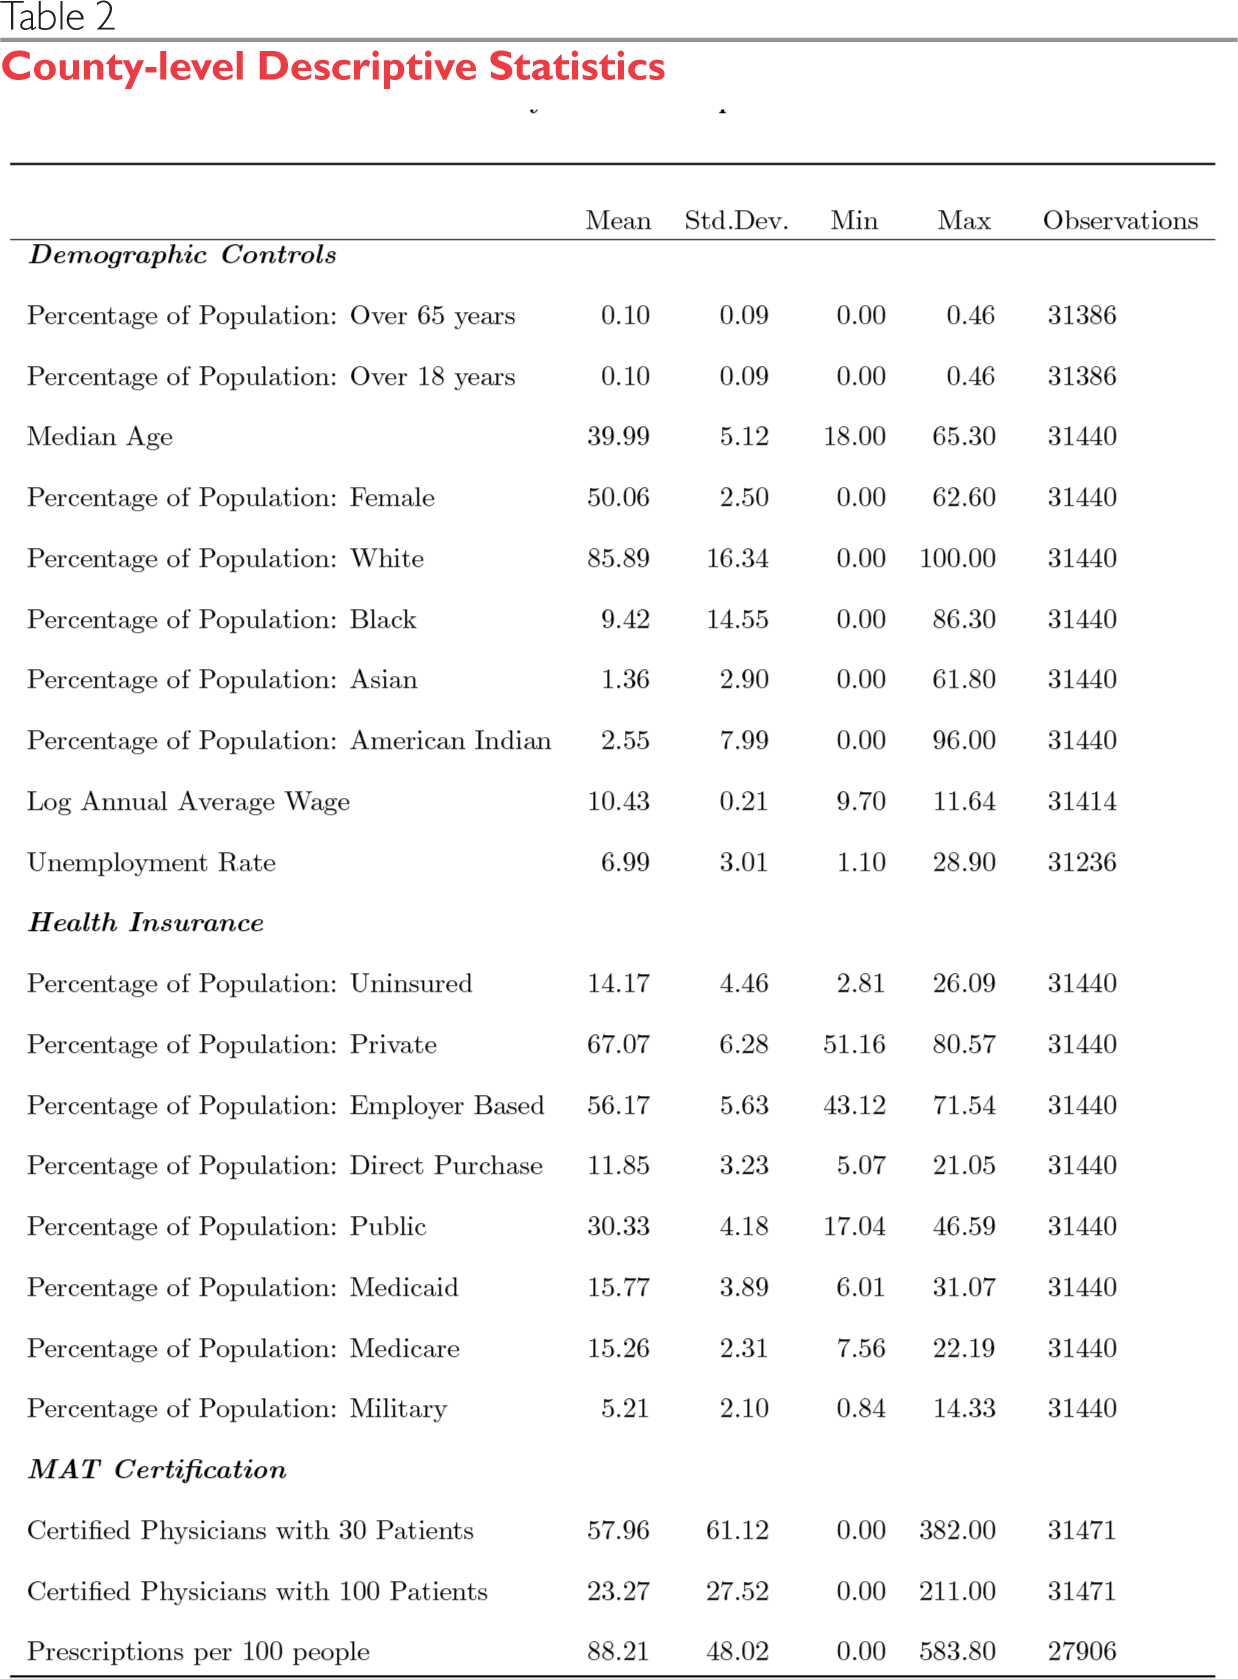
County-level Descriptive Statistics

State Level Descriptive Statistics on Substance Abuse Treatment Controls

How Equation 2* Relates to the Data

* Prescriptionsit = δi + γt + αNoPDMPst + βNoAccessst + θOverprescriptionit−1 + φNoPDMPst × Overprescriptionit−1 + ρNoMustAccessst × Overprescriptionit−1 + ζNoMustAccessst × NoDailyst + σNoMustAccessst × NoDailyst × Overprescriptionit−1
Effect of State Interventions on Prescription Rates

Robust standard errors, clustered at the county-level are in parentheses
* p < 0.10
** p < 0.05
*** p < 0.01