INTRODUCTION
Management of resources relies heavily on the perceptions of resource users and managers, and their ability to share and implement common goals (Nelson Reference Nelson1995; McClanahan et al. Reference McClanahan, Mwaguni and Muthiga2005a, b; Gelcich et al. Reference Gelcich, Edwards-Jones, Kaiser and Castilla2006, Reference Gelcich, Kaiser, Castilla and Edwards-Jones2008, Reference Gelcich, Godoy and Castilla2009). The low probability of detection by enforcement patrols in fisheries (Kuperan & Sutinen Reference Kuperan and Sutinen1998) suggests that the success of management is likely to be facilitated when stakeholders self-enforce management by agreeing on the types of management that they prefer, select leadership that represents and enforces their interests and work collaboratively towards implementation of these activities (Ostrom Reference Ostrom1990; Jentoft Reference Jentoft2003; Napier et al. Reference Napier, Branch and Harris2005; Gutierrez et al. Reference Gutierrez, Hilborn and Defeo2011). This is expected to require a blending of authoritarian and communal approaches where the resulting co-management may require more democratic and collective agreement rather than autocratic or technocratic imposition of decisions (Cocklin et al. Reference Cocklin, Craw and Mcauley1998; Jentoft et al. Reference Jentoft, McCay and Wilson1998). In these situations, management solutions are focused on what can be achieved at the lowest social cost (McClanahan et al. Reference McClanahan, Cinner, Kamukuru, Abunge and Ndagala2008). Poor recognition of these social processes and potential conflicts frequently leads to limited success in the implementation of management (McClanahan Reference McClanahan1999; Christie Reference Christie2004; Beddington et al. Reference Beddington, Agnew and Clark2007; Hilborn Reference Hilborn2007).
A first step towards evaluating social costs is to understand the perceptions of stakeholders about different management tools through surveys of resource users and managers. Stakeholders’ perceptions can reveal the degree to which they believe specific management actions will impose social and economic costs. The results of these surveys can be used to inform the temporal and spatial implementation of management restrictions (Christie et al. Reference Christie, McCay, Miller, Lowe, White, Stoffle, Fluharty, McManus, Chuenpagdee, Pomeroy, Suman, Blount, Huppert, Eisma, Oracion, Lowry and Pollnac2003). Adoption of management is expected to benefit from a preliminary survey of preferences that include independent opinions from stakeholders, their willingness to participate in proposed restrictions, and their perceptions of who benefits from restrictions (Mehta & Heinen Reference Mehta and Heinen2001; Picard Reference Picard2003; McClanahan Reference McClanahan, McClanahan and Castilla2007). Identifying priority management actions allows for a strategy where the most agreeable or least objectionable restrictions are prioritized for implementation so that local successes can be built upon. We use the assumption that, other things being equal, management is more likely to succeed where there are high levels of support than where support is low or absent. The measures with the highest levels of support are recommended as a starting point for engagement in the management process. In principle, if initial management actions are successful and benefits accrue and are fairly distributed among stakeholders, management could move on to the next most agreeable restrictions if they are needed and wanted.
Fisheries management primarily includes restrictions on area, time, size, species, gear and effort. Preferences, costs and benefits of these restrictions will vary according to the scale of the management, and the perceptions of their value will depend on scale of the individual occupations, experience and education (Jacobson & Marynowski Reference Jacobson and Marynowski1997; McClanahan et al. Reference McClanahan, Cinner, Kamukuru, Abunge and Ndagala2008). Consequently, it is common to have disparities in perceptions between resource users dependent on the real or perceived costs and benefits and the scales at which they accrue (Aswani Reference Aswani2005; McClanahan et al. Reference McClanahan, Mwaguni and Muthiga2005a, b; Richardson et al. Reference Richardson, Kaiser and Edwards-Jones2005). Management informed by natural scientific investigation seldom considers local and immediate social costs but considers the larger spatial and temporal scale of ecological benefits. These ecological benefits occur at the scale that educated technicians and managers often employed at regional or national levels perceive and value benefits (Hicks et al. Reference Hicks, McClanahan, Cinner and Hills2009). Conversely, the short-term costs and benefits of restrictions are most strongly felt by extractive users. People perceive the scales of these benefits differently and this is expected to influence whether and how people engage in and comply with management measures (McClanahan et al. Reference McClanahan, Cinner, Kamukuru, Abunge and Ndagala2008; Thomassin et al. Reference Thomassin, White, Stead and David2010). Resolution of these psychological, economic and governance challenges of co-management of common-property resources holds promise for achieving higher compliance for sustainable resource use (Gutierrez et al. Reference Gutierrez, Hilborn and Defeo2011; Cinner et al. Reference Cinner, McClanahan, MacNeil, Graham, Daw, Mukminin, Feary, Rabearisoa, Wamukota, Jiddawi, Campbell, Baird, Januchowski-Hartley, Hamed, Lahari, Marove and Kuange2012).
What then are the factors that lead to divergent perceptions about management? Previous evaluations have shown that education, agriculture and salaried employment alternatives, and history of co-management, education and interactions with managers can be critical (McClanahan et al. Reference McClanahan, Mwaguni and Muthiga2005a, b, Reference McClanahan, Cinner, Kamukuru, Abunge and Ndagala2008; Gelcich et al. Reference Gelcich, Godoy and Castilla2009). Restrictions that are perceived to benefit government or business elite as opposed to resource users (what is referred to as ‘elite capture’) are expected to lead to weak support (Christie Reference Christie2004; Béné et al. Reference Béné, Belal, Baba, Ovie, Raji, Malasha, Njaya, Andi, Russell and Neiland2009). Therefore, conflicts over marine resources can arise because of the heterogeneity in perceptions driven by perceived disparities in benefits (Christie Reference Christie2004; Béné et al. Reference Béné, Belal, Baba, Ovie, Raji, Malasha, Njaya, Andi, Russell and Neiland2009). Identifying the specific restrictions that lead to higher degrees of perceived elite capture, and whether these are related to specific socioeconomic contexts can serve to provide critical information for planning, research, management, awareness and education (for example Nazarea et al. Reference Nazarea, Rhoades, Bontoyan and Flora1998; McClanahan et al. Reference McClanahan, Cinner, Kamukuru, Abunge and Ndagala2008). Yet, many studies examining users’ perceptions of management do so over relatively small spatial scales (such as one village or several villages), limiting the capacity to examine broader trends and their causes. Consequently, the objectives of this study were to: (1) examine the preferences and perceived benefits of management options areas along the entire Kenyan coastline, where our experience suggested considerable heterogeneity in opinions and management systems, both between resource users and managers, but also among fish landing communities; (2) examine the socioeconomic characteristics of key stakeholders (including fishers and managers); and (3) analyse how geographic and socioeconomic characteristics are related to stakeholders’ perceptions about management. We use this information to make policy and process recommendations.
Social context of resource management in Kenya
Historical conflict between local social traditions and norms and legislated national-level management are common in Kenya and elsewhere (McClanahan et al. Reference McClanahan, Glaesel, Rubens and Kiambo1997, Reference McClanahan, Davies and Maina2005c; Walley Reference Walley2004; Béné et al. Reference Béné, Belal, Baba, Ovie, Raji, Malasha, Njaya, Andi, Russell and Neiland2009). In some instances, participatory processes have reduced or resolved conflicts while in other instances they have stalled or failed to find solutions (Walley Reference Walley2004; McClanahan Reference McClanahan, McClanahan and Castilla2007; Wells et al. Reference Wells, Samoilys, Makoloweka and Kalombo2010). For example, Kenyan national laws prohibit the use of pull seine nets and spearguns, but an estimated 60% of fishers actively use these illegal gears (McClanahan et al. Reference McClanahan, Mwaguni and Muthiga2005b). Conversely, some fishing communities that adhere to traditional management see these nets and other gear and forms of management as ‘against tradition’, but have had difficulties getting both local fisher and government support for their local rules (McClanahan et al. Reference McClanahan, Glaesel, Rubens and Kiambo1997). This has created a heterogeneous or fractioned management system that can often differ from place to place based on the interactions of various formal and informal organizations, power and economic incentives at specific fisheries grounds (McClanahan Reference McClanahan, McClanahan and Castilla2007). In this context, we were interested in examining how different types of management scenarios, including restrictions on time, size, gender, species, gear and effort, would be viewed by resource users and managers, and if these views could be predicted by their perceptions of who benefits from the management and their education, history of management and their economies.
METHODS
Study sites
Field studies of fishing communities and resource managers were undertaken in 22 fish landing sites distributed along the entire Kenyan coastline, ranging from the Lamu archipelago in the north near the Somali border to Shimoni in the south near the Tanzania border (Appendix 1, Fig. S1, see supplementary material at Journals.cambridge.org/ENC). The fish landing site communities were usually composed of groups of c.10–100 fishers who landed their catch at shared beach landing site. Fishers captured fish in nearshore mangrove, seagrass, and coral reef ecosystems using traditional handmade canoes, sailboats and various gear (lines, traps, spears and various nets). Some resource managers were interviewed in field situations, but also in the local or regional offices of the park service (Kenya Wildlife Service) and the fisheries department.
Sampling methods
Interviews of 402 people were completed over a 16-month period between April 2008 and August 2009 (Appendix 2, see supplementary material at Journals.cambridge.org/ENC). Interviews included a total of 373 fishers from 22 landing sites and 19 managers, which included 10 marine park attendants and nine fisheries officers. Interviews were undertaken either at the landing sites or at fishers home, when fishers asked to be interviewed at their homes. Fishers were often in transit at the landing sites and often preferred to be interviewed at their homes. In order to sample proportionally in an unbiased way, the number of resource users at the sites were determined from discussions with leaders and direct observation and classified by the main gear types they used. The fishers were then numbered one to n th in each dominant gear-use category and these numbers were randomly selected to identify the person for interviewing, but such that their proportion to the gear used at the landing site was constant. The list of fishers was obtained from the landing sites and from various fisher groups at the site. They were listed with their main gear and, in case of multi-gear users, the fishers were listed by their primary gear. In the few cases when a randomly selected fisher could not be found, an alternative was selected as the next person on the list from the same gear category. Managers were considerably fewer than the resource users and therefore all available managers were interviewed.
Interviewees were asked to rate their level of agreement with various management options on a five-point Likert rating using a previously described questionnaire (McClanahan et al. Reference McClanahan, Cinner, Kamukuru, Abunge and Ndagala2008). Briefly, the questions addressed six management options: area-based management, spatial closures, seasonal closures, management restrictions on gear, limits on the minimum size of landed fish and limits on the species caught. Questions were asked as ‘do you believe that minimum size restrictions on landed fish is a good way to sustain fisheries’ and the same question was asked again for each restriction. Levels of agreement with these restrictions, as evaluated by the Likert rating, included agree completely, agree somewhat, neutral, disagree somewhat, and disagree completely. Don't know was recorded separately and then dropped from the analyses.
Respondents were also asked to rate the extent to which themselves, the community and the government benefited from these various restrictions by marking an x on a 10-cm scale that ranged from low to high benefits. Specific questions were asked about specific restrictions, including what is the appropriate area for marine protected area management, closure size and minimum length of fish for these restrictions. Respondents were specifically asked to specify their preferred size of closures (in km2) and minimum size for fish (in cm). Finally, respondents were asked questions about their socioeconomic conditions, including their occupations and importance, the material status of their households, incomes, age, gender, level of education, area of origin and involvement in community groups (Pollnac et al. Reference Pollnac, Crawford and Gorospe2001; Cinner et al. Reference Cinner, McClanahan and Wamukota2010). A material style of life metric was created from the first axis of the PCA based on the ownership of a list of household items (Cinner et al. Reference Cinner, McClanahan and Wamukota2010). The distance that a community was to a park was calculated from maps and used as a proxy for experience with protected area management.
Data analyses
We were first interested in determining if levels of agreement with different management strategies varied between landing sites/villages and professions, specifically fishers and managers. Consequently, we used the per cent similarity and hierarchical cluster analyses using the Ward method based on the mean levels of agreement at each landing site and each profession. Three clusters of distinct groupings arose from this analysis and these clusters formed the basis for portions of subsequent analysis along with analyses at the level of the individual respondent. In general, scaling of restrictions was on the positive side of the rating and clusters were therefore referred to as strongly positive, positive and weakly positive based on their relative scaling of management preferences.
To evaluate discrepancies in perceived benefits, we took the difference between the pairs of all possible benefits (government-self, government-community, community-self) and evaluated these differences in terms of the perceived disparity in individual perceptions of the management options. We then evaluated the perceived disparity for the three management preference clusters of landing sites and professions. The largest measured disparity (government-self) was used in the final logistic step-wise regression analysis with characteristics of the respondent to test if respondent characteristics were associated with their sense of disparities in management benefits.
We used the following statistical tests of significance: (1) one-way ANOVA and post-hoc Tukey to examine differences in respondents’ socioeconomic characteristics between the three management preferences clusters (strongly positive, positive and weakly positive); (2) nested ANOVA analyses to examine differences in levels of agreements with different management restrictions between the three preference cluster groups with sites (using site averages) nested within clusters; (3) bivariate regression analyses of the perceived disparities between management beneficiaries; and (4) logistic step-wise multiple regression analysis to examine whether respondents’ socioeconomic characteristics were associated with their perceived benefits, level of agreement with and perceived disparity arising from different management restrictions. Cumulative frequency distributions were plotted to evaluate respondent suggestions for the minimum size of landed fish and the proposed sizes of closures and marine protected areas. JMP software was used for the analyses (Sall et al. Reference Sall, Lehmaan and Creighton2001).
RESULTS
Socioeconomic characteristics of stakeholders
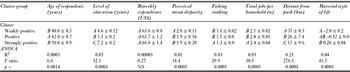
Fishers had a mean age of 40 years, just over five years of education, 2.2 jobs per household and, on average, lived 31-km from the nearest marine protected area (Appendix 2, see supplementary material at Journals.cambridge.org/ENC). Fishers differed from government employees in being older and having more household jobs. Government employees had 12–13 years of education and a lower perceived disparity of benefits than fishers (Table 1).
Summary of key descriptions (mean ± standard errors of the mean [SEM]) of the respondents in the three clusters of management preferences and one-way ANOVA test of significance. Material style of life metric is a multivariate principal component analysis (PCA) scaling based on ownership of various household items, where positive values indicate greater material assets and vice versa. Results of a post-hoc Tukey test comparing individual means where values preceded the same letter (A, B, C) are not significantly different from each other. NS = not significant.

Stakeholders’ perceptions of management
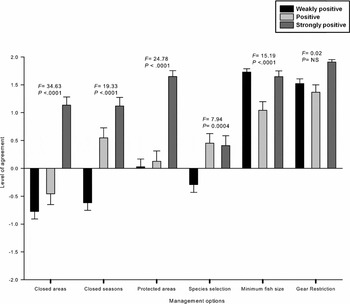
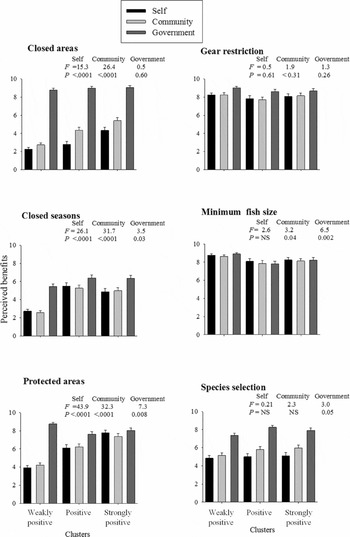
Cluster analysis of the responses to the management restrictions indicates that there were three broad groupings with the cluster group, management and their interaction being statistically significant (Appendix 1, Fig. S2, see supplementary material at Journals.cambridge.org/ENC). The group that rated restrictions strongly positive included the government employees and fishers at four landing sites (Vipingo, Mkokoni, Shimoni and Mkwiro) (Fig. 1, Appendix 1, Fig. S2, see supplementary material at Journals.cambridge.org/ENC). Seven landing sites rated the restrictions in a positive and eleven in a weakly positive way depending on the restriction (Fig. 1, Appendix 1, Fig. S2, see supplementary material at Journals.cambridge.org/ENC).
Scaling of the management restrictions pooling responses into the three major management preference clusters. Results of the statistical tests of significance are given in Table 2. Error bars are standard errors of the mean.

Management preferences among groups
There were statistically significant differences between the three management preference clusters regarding how they rated their level of agreement with all restrictions except species and gear (Fig. 1, Table 2). All groups rated equally high levels of agreement with gear restrictions and this was rated as the most agreeable of all potential restrictions. In contrast, all groups rated species restrictions with low levels of agreement. There were statistically significant but weaker differences in minimum length restrictions, which were rated high for all clusters. The largest differences among the three clusters were their level of agreement with protected areas and closed areas, and closed seasons. These restrictions were what largely distinguished the clusters. The strongly positive cluster rated all restrictions positively, but had higher levels of agreement with minimum length and gear restrictions than for closed seasons. The positive group rated closed seasons positively, but was neutral on protected areas and negative on closures. The weakly positive group was neutral on protected areas, but rated closed seasons, closed areas and species selection negatively.
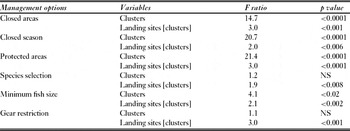
Nested ANOVA analysis of perceived benefit by management options of the three beneficiaries, self, community and government, as rated by the respondents. Scaled values are shown in Figure 3. NS = not significant.

When asked about reasons for their level of agreement, the common explanations for gear restriction were that this ensured less destruction to fish and their habitat and also it reduced mortality of juvenile fish (Appendix 3, see supplementary material at Journals.cambridge.org/ENC). Reasons for supporting minimum length restrictions included ensuring future fish stocks, the ease of selling and better prices. Common reasons given for not supporting species selection was that it was not possible to control the species caught, that the species caught was a natural phenomenal determined by God, there was no benefit to fishers for these species restrictions, and that size was more important than species for effective management. Among those respondents that did support species restrictions, explanations included the importance of stopping extinction, preserving predatory species and the ability of key species to attract tourists, which led to jobs. Respondents that rated parks and closures high saw them as breeding sites and for their ability to increase spillover and improve catches. Those that rated parks and closures negatively said that they restricted their movements while fishing and reduced the area available for fishing.
Acceptable sizes of restrictions
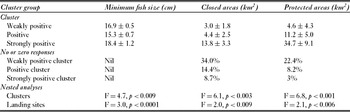
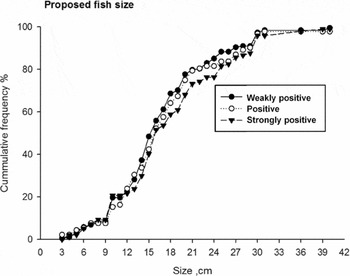
Responses to questions about the appropriate sizes for the minimum length of landed fish, closures and protected areas indicate that all comparisons among the three clusters were statistically significant and differences among clusters were stronger than the sites (Table 3). Differences in the suggested minimum lengths of landed fish were, however, not large among the three groups, ranging from 15.3 cm to 18.4 cm for the mean lengths. The range of individual responses was larger, ranging from a minimum of 3 cm to a maximum of 42 cm, but 90% of the responses suggested minimum sizes of < 30 cm (Fig. 2).
Summary of sizes given for minimum caught fish, closed and protected areas (mean ± SEM) for the three different cluster groups and result of ANOVA nested analysis for landing sites nested within clusters. Figure 4 shows the values presented as cumulative frequency distributions. The number of the 402 total respondents that would not answer the question, could not give quantitative estimates, or gave zero as their answer is indicated below the ‘non or zero responses’ sub-heading.

Cumulative frequency distributions of the minimum size of captured fish pooling respondents by the three major management preference clusters. Results of the statistical tests of significance are given in Table 3.

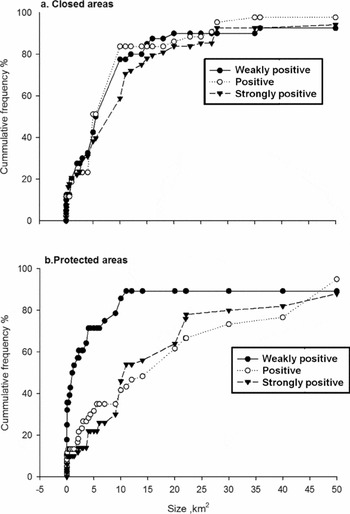
When respondents were asked about the acceptable sizes of closures and protected areas, a significant proportion of them were unable to estimate sizes, did not give suggested sizes, or gave zero as their answer, particularly in the positive and weakly positive clusters. For those that did answer with quantitative values, there was small spread in responses for closed areas, but a large spread for the size of protected areas among the three clusters (Fig. 3). Respondents in the weakly positive and positive groups that gave answers for closed areas, the mean values were between 3.0 and 4.4 km2, where as respondents in the strongly positive group gave a mean value of 13.8 km2. The size of protected areas ranged from 4.6 for the weakly positive group to 34.7 km2 for most positive group, indicating fairly large variation around these values, the strongly positive cluster having the most variation.
Cumulative frequency distributions of sizes of fisheries closures and sizes of marine protected areas based on the pooled responses of the three major management preference clusters. Results of the statistical tests of significance are given in Table 3.

Perceived benefits and disparities
Testing for differences in scaling of benefits for the six management restrictions by the three beneficiaries, self, community and government, indicated differences by the types of restrictions for the three management preference clusters (Fig. 4). One exception was gear restrictions, which were perceived to benefit all beneficiaries equally by all preference clusters. Minimum length restrictions were also seen to benefit most groups with the weakly positive cluster scaling the benefits higher than the positive and strongly positive cluster respondents for all beneficiaries. The weakly positive group also rated protected areas as a greater benefit to the government than the other clusters. Most respondents rated government as the main beneficiary to restrictions, followed by community, and self but the extent of this varied for the three preference clusters and restrictions. Generally, the least positive benefits to the self and community were associated with the weakly positive and positive clusters. Consequently, the weakly positive and positive cluster respondents generally rated the restrictions that they did not like as of lower benefit to themselves and their community, but they did recognize the benefits to the government.
Scaled perceived benefits for the three beneficiaries (self, community and government) of the management restriction options as rated by the respondents in the three clusters. Tests of significance compare differences between the three management preference clusters for the three beneficiaries. Error bars are standard errors of the mean.

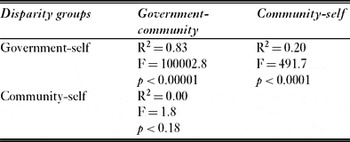
Pair-wise regression comparisons of the differences in perceived benefits to the three rates of beneficiaries suggest that the largest perceived disparities are seen between the government and individual ratings, but this is highly correlated with the government-community disparities (Table 4). In other words, the respondents perceived similar levels of benefits to restrictions to both themselves and their communities, but did perceive differences in benefits that accrued to the government. Consequently, in the evaluation of disparities below, we used the government-self as the metric of ‘perceived disparity’.
Bivariate regression analyses of the interrelationships between the disparities (differences between benefits for pair-wise comparisons) in the perceived benefits of management for the three different beneficiaries.

Associations of management preferences with socioeconomic variables
Respondents in the strongly positive preference cluster undertook all jobs except gleaning and c. 80% were involved in fishing but less than half rated it as their primary occupation (Appendix 1, Fig. S3, see supplementary material at Journals.cambridge.org/ENC). The most important job among the strongly positive cluster was salaried jobs: >50% of those involved rated a salaried job as their primary occupation. Other important jobs in this cluster were informal sector and subsistence jobs, where c 25% rated them as their primary job. Jobs in the positive cluster involved fishing (90%), informal sector (32%) and subsistence farming (28%); none were involved in mariculture or cash crop farming. Less than 20% were involved in tourism and salaried jobs, but >50% of those involved stated that it was their primary occupation. There were many jobs listed in the weakly positive cluster, but most were involved in fishing (81%) and cash crop farming (40%); other jobs had <20% involvement.
There were statistically significant differences in management preference clusters in the key descriptions of the respondents with the exception of the biweekly expenditures (Table 1). The group with the most negative view of restrictions had a lower level of education, a higher perception of disparity in benefits from restrictions, a lower material style of life, and was furthest from marine protected areas. This group and the positive group both had similar high rankings for fishing as importance to their household and the total number of jobs per household.
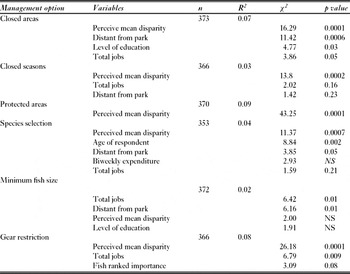
Logistic step-wise multiple regression analyses of the socio-economic variables and perceived disparity on the level of agreement with the six management restrictions indicate generally high variability and weak multivariate models but a number of statistically significant associations (Table 5). The most frequent statistically significant factor was perceived disparity, which was a significant predictor in all six restrictions; the greater the perceived disparity the weaker the level of agreement with the restriction. Distance to the park was significant for four of the restrictions, with higher levels of agreement with restrictions the closer the respondents were to the park for closed areas, closed season, minimum fish lengths, and species selection restrictions. The total number of jobs of the respondents was significant for three of the restrictions. Higher levels of agreement with closed areas, minimum size, and gear restrictions were associated with fewer reported numbers of jobs. Ranking of fishing as the number one occupation was more common in the weakly positive and positive clusters (Appendix 1, Fig. S3, see supplementary material at Journals.cambridge.org/ENC). Higher levels of agreement with closed area restrictions increased with the respondent's level of education. Higher levels of agreement for species restrictions declined with the age of the respondent.
Factors influencing a fisher's level of agreement with various management options based on logistic step-wise multiple regression analysis. Variables included are those that remained after the step-wise screening procedure. NS = not significant.

DISCUSSION
The results suggest that restrictions, such as gear and minimum length restrictions, had large-scale appeal but area, species and closure management had more limited support. These preferences were weakly associated with socioeconomics of the respondents as well as the spatial distribution and history of management. In general, restrictions were rated positively but three distinct groupings of management preferences were found among the landing sites and government offices. The majority of fishers and particularly those most dependent on fishing incomes were least supportive of closed area and species restrictions, partially generated from or justified by a perceived sense of disparity in the benefits of these forms of management. This sense of disparity is, however, probably not entirely based on direct experience, as the landing sites closest to the government managed areas had among the most positive views towards area and closure management. In addition, high dependence on fishing and low income and education are expected to heighten this sense of unease with closure management and lost fishing area and potential income (McClanahan et al. Reference McClanahan, Cinner, Kamukuru, Abunge and Ndagala2008; Cinner et al. Reference Cinner, Daw and McClanahan2009), although the per cent variance explained in this model was low.
If the assumption that restrictions are more likely to succeed where support is strong is correct, there is opportunity for greater compliance of some restrictions on a broad national scale where restrictions have widespread appeal. We suggest that gear and minimum size restrictions are best applied at the national level, while other restrictions may be more readily adopted and complied with at the community level. Gear restrictions are currently part of the fisheries law but not minimum fish sizes. Conversely, protected and closed areas have until very recently been considered the domain of the national government. Promoting community control of these restrictions by changing national laws and institutions is predicted to increase the rates of adoption and compliance. Additionally, there are other opportunities to influence communities through intercommunity relationships because of spatial heterogeneity in the perceptions of fishing communities. For example, fishers furthest from closed area management had the most negative views towards area management. Consequently, it may be possible to change their perceptions if fishers with different experiences share information about the costs and benefits of closure and area management. This is likely to involve community education and site-exchange programmes between fishing communities, enabling them to share their information and experience about closed and protected areas. Information and education in combination with greater financial wealth, stability and decreased dependence on fishing is expected to change restriction preferences and behaviours (McClanahan et al. Reference McClanahan, Cinner, Kamukuru, Abunge and Ndagala2008).
Positive views of closure and area management were shown to increase among Kenyan fishers with the age of closures and education for closures that ranged in age from a few to 35 years (McClanahan et al. Reference McClanahan, Mwaguni and Muthiga2005a). In the youngest closure of that study (Kenyatta Beach), which originally had the most negative views, there has been reduced level of conflict since the closures (McClanahan et al. Reference McClanahan, Mwaguni and Muthiga2005c). Evaluations of fishing income in Kenya showed that fishing grounds next to closures with gear restrictions had rising incomes associated with larger and more valuable fish (McClanahan Reference McClanahan2010). Consequently, changes in perception and reduced conflicts with time since closure may be stimulated by the increased incomes that may follow after some period of closure. In some cases, increased income may be associated with reduced effort associated with restrictions on gear and increases in catch for the remaining fishers (McClanahan Reference McClanahan2010). There is also an expected lag effect, where catch may drop shortly after the closure but may increase as migration of biomass out of the closures increases (Halpern et al. Reference Halpern, Lester and Kellner2010; Vandeperre et al. Reference Vandeperre, Higgins, Sánchez-Meca, Maynou, Goñi, Martín-Sosa, Pérez-Ruzafa, Afonso, Bertocci, Crec'hriou, D'Anna, Dimech, Dorta, Esparza, Falcón, Forcada, Guala, Le Direach, Marcos, Ojeda-Martínez, Pipitone, Schembri, Stelzenmüller, Stobart and Santos2010). Additionally, the creation of closures may stimulate the tourism economy, and fisher families and communities may receive some benefit from these developments (Hicks et al. Reference Hicks, McClanahan, Cinner and Hills2009; Cinner et al. Reference Cinner, McClanahan and Wamukota2010). Some of the initial negative perceptions towards closures may be balanced if information about these long-term case studies are shared, enabling better understanding of the initial costs but potential long-term benefits to closures.
The socioeconomic context in which fishers operate is critical to perceptions and compliance. Poorer fishers’ ability to change their behaviour and adapt to immediate disturbances may depend on their household economies. For example, Cinner et al. (Reference Cinner, Daw and McClanahan2009) found that fishers’ reporting their likelihood of exiting a fishery increased with their household wealth and job opportunities. If fishers do not perceive other livelihood alternatives, they may resist management efforts by continuing to fish, which can reinforce ecological degradation (Cinner et al. Reference Cinner, Folke, Daw and Hicks2011). A specific example of this response was reported in Mafia Island (Tanzania), where fishers in villages surrounding a c. 13 year-old closure had variable perceptions and compliance dependent on their economic alternatives, particularly the potential for agriculture and participation in the cash economy (McClanahan et al. Reference McClanahan, Cinner, Kamukuru, Abunge and Ndagala2008). Positive perceptions were associated with better cash and agricultural alternatives and not the numbers of jobs; the last is more likely a response to poverty, where many jobs are needed to sustain the poor households in areas with low agricultural and cash economy potentials (Walley Reference Walley2004; Cinner & Bodin Reference Cinner and Bodin2010). The causes and consequences of livelihood diversity in rural communities are complex (Ellis Reference Ellis1998, Reference Ellis2000; Barrett et al. Reference Barrett, Reardon and Webb2001). Consequently, attempts to indiscriminately add more jobs to already diverse livelihood portfolios in some fisher communities may have marginal or no benefits (Allison & Ellis Reference Allison and Ellis2001; Pomeroy et al. Reference Pomeroy, Ratner, Hall, Pimoljinda and Vivekanandan2006). More specifically, alternative foods, stability and wealth may influence perceptions towards losses in fishing grounds and lags in fish catch that can result from closures.
Restrictions on the size of fish caught and closures have been examined from the normative theoretical and empirical approaches of fisheries and conservation scientists (Halpern & Warner Reference Halpern and Warner2003; O'Connor et al. Reference O'Connor, Bruno, Gaines, Halpern, Lester, Kinlan and Weiss2007; Ault et al. Reference Ault, Smith, Luo, Monaco and Appeldoorn2008; White et al. Reference White, Kendall, Gaines, Siegel and Costello2008). These approaches are useful for understanding biophysical expectations based on these metrics and assumptions, but do not necessarily assure adoption and compliance, which may depend as much on local perceptions and knowledge. In the case of minimum fish lengths, the theoretical-empirical scientific approach produced mean values that differ from the local Kenyan suggestions. For example, the dominant three species in the fish catch, which compose 80% of the catch (Siganus sutor [rabbitfish], Leptoscarus vaigensis [seagrass parrotfish] and Lethrinus mahsena [pink-ear emperor]) have lengths of 32.7 cm, 22.7 cm, and 29.6 cm at estimated optimum yield, and 29.1 cm, 21.2 cm and 26.7 cm at estimated first maturity, respectively (see FishBase, URL http://www.fishbase.org). These scientific values generally lie above the mean values for minimum lengths given by fishers of 15.3–18.4 cm. The fisher suggestions are closer to the lengths at first maturity, which are more likely to be something that fishers can view and appreciate as important. Beyond these differences in means and metrics, the main practical difference between the scientific calculations and fishers’ expert opinions is the higher variability among fishers’ responses. High variability and weak consensus can lead to conflicts and low compliance. Consequently, we suggest that combining these two approaches and informing fishers of the fisheries science approach and recommendations will improve the chances for consensus and compliance.
The acceptable or minimum size of closures is more difficult to evaluate, as the responses were more variable and based on the respondent's ability to estimate sizes and willingness to answer this question. The mean number of years of education among fishers was 5.2 years, so this may have been a limitation to their responses, but this may also have arisen if the fisher did not see benefits from closure and area management, in which case they would not estimate the size. Among those who did answer the question, the preferred size of the closure varied from 3.0 km2 to 13.8 km2 and the preferred size of protected areas was 4.6–34.7 km2, increasing from the weakly positive to positive preference clusters. Conservation scientists have suggested that the minimum viable size of a closure is 3.1 km2 (Halpern & Warner Reference Halpern and Warner2003) and a preferable size is 12.5–28.5 km2 (Shanks et al. Reference Shanks, Grantham and Carr2003). Based on more than 4000 marine protected areas, the median size of marine protected areas globally is 4.6 km2 with a mean of 544 km2, which is greatly skewed by a few very large marine protected areas (Wood et al. Reference Wood, Fish, Laughren and Pauly2008). No-take closure areas comprise only c. 13% of these protected areas, and therefore are likely to be smaller. Nevertheless, excluding assumptions explaining the causes of the non-responses in our survey and the few very large protected areas in the global compilation, our respondents’ estimates of sizes for closure and protected areas were similar to those suggested by conservation scientists and seen globally. Consequently, among some fishing communities it should be possible to create and maintain closures that are above some suggested minimum viable size. Many closures created and maintained by communities are considerably smaller than the minimum viable size, yet show responses in fish abundance to closure if given sufficient time to recover (Russ & Alcala Reference Russ and Alcala2004). They may not be sufficient on their own to meet conservation needs but, if part of a larger network and some larger nationally protected areas, conservation and management goals can still be met (Weeks et al. Reference Weeks, Russ, Alcala and White2010).
CONCLUSIONS
Our findings can be seen as an opportunity to guide more context-appropriate management where technical biophysical and local knowledge approaches can be combined (Aswani & Hamilton Reference Aswani and Hamilton2004). Heterogeneity in perceptions and actual benefits of management restrictions can be considerable, and this potentially creates challenges for successfully implementing management, particularly where decisions and potential benefits are determined at the national level but considerable short-term costs can potentially accrue at the local level. The costs and benefits of specific restrictions may also be variable in space, time and individual economies, which can cause considerable disparity among stakeholders’ views. Poor consideration of these socioeconomic and perception considerations and the open-access nature of fisheries are arguably the reasons for poor compliance with fisheries management (Ostrom Reference Ostrom2007). Nevertheless, the findings provide support for planning management at multiple scales, where local management is a mix of national laws and local by-laws, and indicates many of the suggestions of the respondents concur with those provided by theoretical-empirical findings of conservation scientists.
ACKNOWLEDGEMENTS
The Western Indian Ocean Marine Science Association (WIOMSA) Marine Science for Management (MASMA) programme and the Wildlife Conservation Society, through support of the Tiffany and John D. and Catherine T. MacArthur Foundations, funded this research. We are grateful to the fishing communities and government officers for their help and participation in this survey. Kenya's Office of Science and Technology provided research clearance.