


1 Introduction
One of the promising methods for measuring the coefficients of viscosity and surface tension of a liquid is the observation of gravity–capillary waves propagating along its surface, which is plane in equilibrium. The perturbations of the surface are excited in a non-contact manner by means of the electrocapillary effect and are recorded by a laser interfering system (see, for example, Sohl, Miyano & Ketterson Reference Sohl, Miyano and Ketterson1978; Lee et al. Reference Lee, Chou, Chug and Mazur1993; Behroozi, Smith & Even Reference Behroozi, Smith and Even2010).
The theoretical basis for the contactless method presented here is a series of well-known results. Thus, in the simplest situation of a thick layer of an inviscid fluid, the frequency of undamped waves,
 $\unicode[STIX]{x1D714}_{0}$
, is given by the formula (see Lamb Reference Lamb1895, pp. 545–549)
 $$\begin{eqnarray}\unicode[STIX]{x1D714}_{0}=\sqrt{gk+\unicode[STIX]{x1D6FE}k^{3}/\unicode[STIX]{x1D70C}_{1}},\end{eqnarray}$$
which is a particular case of the result for the interface between two media,
 $$\begin{eqnarray}\unicode[STIX]{x1D714}_{0}=\sqrt{\frac{gk(\unicode[STIX]{x1D70C}_{1}-\unicode[STIX]{x1D70C}_{2})+\unicode[STIX]{x1D6FE}k^{3}}{\unicode[STIX]{x1D70C}_{1}+\unicode[STIX]{x1D70C}_{2}}}.\end{eqnarray}$$
Here,
 $g$
is the acceleration due to gravity;
 $\unicode[STIX]{x1D70C}_{1}$
is the density of a liquid;
 $\unicode[STIX]{x1D70C}_{2}$
is the density of air or another light medium surrounding the surface of the liquid;
 $\unicode[STIX]{x1D6FE}$
is the coefficient of surface tension;
 $k$
is the wavenumber of perturbations.
For the case of ‘deep water’ considered above, the contribution of the kinematic viscosity of the liquid,
 $\unicode[STIX]{x1D708}_{1}$
, can be given in the dispersion relation for the eigenfrequency
 $\unicode[STIX]{x1D714}$
obtained from (Lamb Reference Lamb1895, pp. 545–549),
 $$\begin{eqnarray}(\text{i}\unicode[STIX]{x1D714}+2\unicode[STIX]{x1D708}_{1}k^{2})^{2}+gk+\unicode[STIX]{x1D6FE}k^{3}/\unicode[STIX]{x1D70C}_{1}=4\unicode[STIX]{x1D708}_{1}^{2}k^{3}(k^{2}+\text{i}\unicode[STIX]{x1D714}\unicode[STIX]{x1D708}_{1})^{1/2}.\end{eqnarray}$$
Note that, in Martel & Knobloch (Reference Martel and Knobloch1997), the authors revealed a ‘viscous’ mode not describable by expression (1.3). It corresponds to aperiodic damping of perturbations and is absent in the case of inviscid fluids.
For low-viscosity liquids, such as water, the eigenfrequency shift
 $\unicode[STIX]{x0394}\unicode[STIX]{x1D714}=\unicode[STIX]{x1D714}-\unicode[STIX]{x1D714}_{0}$
turns out to be relatively small. Its major value at
 $\unicode[STIX]{x1D708}_{1}\rightarrow 0$
,
 $$\begin{eqnarray}\unicode[STIX]{x0394}\unicode[STIX]{x1D714}=2\text{i}\unicode[STIX]{x1D708}_{1}k^{2},\end{eqnarray}$$
is determined in the framework of the Lamb approximation (see Lamb Reference Lamb1895, pp. 544–545) from an integral for the rate of viscous dissipation in the fluid volume that is calculated from the solution of an inviscid problem.
In the literature, one can find a number of estimates general with respect to (1.4), which are associated with considering the subsequent orders of smallness in the kinematic viscosity
 $\unicode[STIX]{x1D708}_{1}$
and also such liquid layers that have small or finite thickness (see, for example, Hunt Reference Hunt1964; Jenkins & Jacobs Reference Jenkins and Jacobs1997; Antuono & Colagrossi Reference Antuono and Colagrossi2013). In the model of potential flow (see Joseph & Wang Reference Joseph and Wang2004), the viscous term in the condition of normal stress balance calculated from a potential flow in a liquid is considered to be responsible for the principal part of the viscosity effect. However, to make it consistent with limit (1.4) for the wave damping coefficient, the pressure correction using a boundary layer solution is required.
The general dispersion relation for a two-layer system (see, for example, Jeng et al.
Reference Jeng, Esibov, Crow and Steyerl1998), which, in addition to the kinematic viscosity of a liquid,
 $\unicode[STIX]{x1D708}_{1}$
, contains the viscosity of a light medium lying above it,
 $\unicode[STIX]{x1D708}_{2}$
, turns out to be quite cumbersome and difficult to analyse. The Lamb’s simplification, applied to this situation, leads to a similar (Dore Reference Dore1978) but incorrect estimate for the eigenfrequency shift
 $\unicode[STIX]{x0394}\unicode[STIX]{x1D714}$
, where the kinematic viscosity coefficients enter in an additive manner as
 $\unicode[STIX]{x1D708}_{1}+\unicode[STIX]{x1D708}_{2}$
. In fact, according to analysis (Dore Reference Dore1978), performed for water and air surrounding its surface, the viscosity effect of the latter is lower in order than the Lamb-type contribution for water and, therefore, can be comparable to and even exceed it, despite a significant difference in the dynamic viscosities of the two media. For a liquid–liquid interface, the major part of the correction
 $\unicode[STIX]{x0394}\unicode[STIX]{x1D714}$
is found as (see Harrison Reference Harrison1908; Johns Reference Johns1968; Jeng et al.
Reference Jeng, Esibov, Crow and Steyerl1998)
 $$\begin{eqnarray}\unicode[STIX]{x0394}\unicode[STIX]{x1D714}=2\text{i}^{3/2}\frac{\unicode[STIX]{x1D70C}_{1}\unicode[STIX]{x1D70C}_{2}\sqrt{\unicode[STIX]{x1D708}_{1}\unicode[STIX]{x1D708}_{2}}}{(\unicode[STIX]{x1D70C}_{1}+\unicode[STIX]{x1D70C}_{2})(\unicode[STIX]{x1D70C}_{1}\sqrt{\unicode[STIX]{x1D708}_{1}}+\unicode[STIX]{x1D70C}_{2}\sqrt{\unicode[STIX]{x1D708}_{2}})}k\sqrt{\unicode[STIX]{x1D714}_{0}},\end{eqnarray}$$
where the frequency of undamped waves,
 $\unicode[STIX]{x1D714}_{0}$
, is taken from relationship (1.2). Interestingly, the sum of the right-hand sides of expressions (1.4) and (1.5), where, in the latter, the condition
 $\unicode[STIX]{x1D70C}_{1}\sqrt{\unicode[STIX]{x1D708}_{1}}\gg \unicode[STIX]{x1D70C}_{2}\sqrt{\unicode[STIX]{x1D708}_{2}}$
is applied, just gives the result of Dore (Reference Dore1978),
 $$\begin{eqnarray}\unicode[STIX]{x0394}\unicode[STIX]{x1D714}=2\text{i}\unicode[STIX]{x1D708}_{1}k^{2}+2\text{i}^{3/2}\frac{\unicode[STIX]{x1D70C}_{2}\sqrt{\unicode[STIX]{x1D708}_{2}}}{(\unicode[STIX]{x1D70C}_{1}+\unicode[STIX]{x1D70C}_{2})}k\sqrt{\unicode[STIX]{x1D714}_{0}}.\end{eqnarray}$$
Additional viscous dissipation occurs in boundary layers, where a flow is characterized by a noticeable shear. This is also shown in the works on the Faraday instability under vertical vibrations, where the viscosity mechanism determines the threshold of the parametric resonance in a hydrodynamic system. So, as an example, one should cite Nevolin (Reference Nevolin1977), where, like in Dore (Reference Dore1978), the influence of a viscous gas on the dynamics of the surface of a liquid was considered. For the interface of two liquids, the approximate analysis of Cherepanov (Reference Cherepanov1984), pp. 12–53 (available as a chapter in Lyubimov, Lyubimova & Cherepanov (Reference Lyubimov, Lyubimova and Cherepanov2003), pp. 11–24) estimates the parametric instability threshold and precedes numerical calculations in Kumar & Tuckerman (Reference Kumar and Tuckerman1994).
Under certain conditions, the surface of a liquid may be in contact and balance with its saturated vapour. So, if the liquid is permanently underheated from below, and the vapour is permanently overheated from above, a stable base state without mass transfer is possible. Here, the interphase surface is at the saturation temperature, which depends on the total hydrostatic pressure established at this interface (see, for example, Berberan-Santos, Bodunov & Pogliani Reference Berberan-Santos, Bodunov and Pogliani2002). Its position and the temperature field in the phases are determined by solving a coupled problem of hydrostatics and one-dimensional stationary thermal conductivity. It becomes possible to measure material parameters of media taken in the state of thermodynamic equilibrium from characteristics of gravity–capillary waves propagating along their interphase surface. Here, it would be useful to adapt the previous methods without taking into account the phase transition factor, but only if an error introduced in this way is small.
The previous investigations have focused on the stabilizing effect of phase transition on the Rayleigh–Taylor instability taking place for the configuration when an externally heated vapour layer is below. After changing the sign of gravity acceleration, the dispersion relations obtained there describe gravity–capillary waves. The linear stability analysis was performed in Hsieh (Reference Hsieh1978) for inviscid fluids. The theory includes a phenomenological coefficient that relates the rate of phase transition to perturbations of the interface position. Its value was estimated in Hsieh (Reference Hsieh1978) by solving the problem of one-dimensional stationary thermal conductivity. The factor of viscosity was considered in Ho (Reference Ho1980), Adham-Khodaparast, Kawaji & Antar (Reference Adham-Khodaparast, Kawaji and Antar1995), Kim & Kim (Reference Kim and Kim2016) on the basis of the first principles. The results of the method of potential viscous flow (see Awasthi & Agrawal Reference Awasthi and Agrawal2011), including the viscous correction of pressure (see Awasthi Reference Awasthi2013), are inconsistent with Dore (Reference Dore1978) in terms of the magnitude of viscous dissipation in the vapour, obeying not a linear, but a square root law.
In Hsieh (Reference Hsieh1972), Ievlev & Son (Reference Ievlev and Son1980), Hsieh (Reference Hsieh2003), the phase transition rate was not specified phenomenologically as in Hsieh (Reference Hsieh1978), Ho (Reference Ho1980), Adham-Khodaparast et al. (Reference Adham-Khodaparast, Kawaji and Antar1995), Awasthi & Agrawal (Reference Awasthi and Agrawal2011), Awasthi (Reference Awasthi2013), Kim & Kim (Reference Kim and Kim2016) with the subsequent use of the quasi-equilibrium approximation from Hsieh (Reference Hsieh1978) but was associated with the solution of a non-stationary energy equation. In this case, both the liquid and its vapour were considered as non-viscous media, and this is a fundamental departure from the viscous approach in Ho (Reference Ho1980), Adham-Khodaparast et al. (Reference Adham-Khodaparast, Kawaji and Antar1995), Kim & Kim (Reference Kim and Kim2016). This excludes from consideration the mechanism of convective heat exchange in the viscous boundary layers surrounding the interphase boundary, where velocities of the phases undergo strong changes, that should lead to a significant error. Nevertheless, the dispersion relations presented in Hsieh (Reference Hsieh1972), Ievlev & Son (Reference Ievlev and Son1980) (before their subsequent simplification there) indicate a limitation of the strength of the phase transition effect in the limit of strong heating, which does not reveal the quasi-equilibrium approximation in Hsieh (Reference Hsieh1978).
In studies of real two-phase systems, such as water and water vapour, it makes sense to abandon the early assumptions and solve the full viscous and thermal problem, as it was done in Badratinova et al. (Reference Badratinova, Colinet, Hennenberg and Legros1996), Konovalov, Lyubimov & Lyubimova (Reference Konovalov, Lyubimov and Lyubimova2016, Reference Konovalov, Lyubimov and Lyubimova2017). The purpose of the present work is to obtain explicit estimates for the damping coefficient and eigenfrequency shift of gravity–capillary waves in the presence of heat and mass transfer and their numerical verification.
2 Statement of the problem
Let us consider a semi-bounded volume of a liquid and the same volume of its vapour (see figure 1). The phases differ from each other by their densities
 $\unicode[STIX]{x1D70C}_{j}$
and also by the coefficients of kinematic viscosity,
 $\unicode[STIX]{x1D708}_{j}$
, thermal conductivity,
 $\unicode[STIX]{x1D705}_{j}$
, and thermal diffusivity,
 $\unicode[STIX]{x1D712}_{j}$
. Hereinafter, the index
 $j$
refers to the liquid (
 $j=1$
), its vapour (
 $j=2$
), or both the phases. The main case studied in the present paper is water and water vapour at atmospheric pressure and the corresponding saturation temperature
 $100\,^{\circ }\text{C}$
(see table 1). So, the ratio of the liquid density to that of its vapour is taken much greater than the corresponding ratio of the coefficients of their kinematic viscosities, which is also large. The ratio of the thermal conductivity coefficients of the liquid and its vapour is much greater than unity. In addition to water, many substances, for example ethanol and its vapour, possess similar properties far from their critical point (see Vargaftik, Vinogradov & Yargin Reference Vargaftik, Vinogradov and Yargin1996).
The two-layer, two-phase system described above is subjected to a field of gravity with the acceleration vector
 $\boldsymbol{g}$
, which is directed down towards the volume occupied by the heavy liquid. The Rayleigh–Taylor instability is absent. Also, there is permanent, homogeneous subcooling from the side of the liquid and the same heating from the side of its vapour. As is well known, heating from above does not cause thermogravity convection. The formulation of the problem allows a stationary base state with a flat liquid–vapour interface under the pressure
 $p_{0}$
and at the saturation temperature
 $T_{s0}$
, characterized by the coefficient of surface tension,
 $\unicode[STIX]{x1D6FE}$
, and the specific heat of vapour formation,
 $L$
. Further, as a control parameter, we will use the heat flux
 $q$
transferred in the process of thermal conductivity through the unperturbed layers of the phases.
Configuration and parameters of the system.

A two-dimensional formulation of the problem would suffice to perform the linear analysis of stability of the base state, which is homogeneous in the horizontal directions. The origin of the Cartesian coordinate system
 $\{x,z\}$
is supposed to coincide with some point
 $O$
at the unperturbed surface of the liquid, aligned with the horizontal axis
 $x$
. The vertical axis
 $z$
is oriented along the normal to the surface toward the vapour volume.
In practice, the outer boundaries of thick layers of a liquid and its vapour exert a weak mechanical effect on perturbations of their interphase if their thicknesses
 $h_{j}\eqsim \unicode[STIX]{x1D705}_{j}\unicode[STIX]{x0394}T_{j}/q$
(related by the Fourier thermal conductivity law to the temperature drops
 $\unicode[STIX]{x0394}T_{j}$
on the boundaries of the layers) are greater than or of the order of the wavelength
 $\unicode[STIX]{x1D706}$
. This can be attributed to the fact that damping of perturbations inside the examined media (see, for example, Lamb Reference Lamb1895, pp. 370–374) is of an exponential nature. As a result, the following estimates are obtained:
 $$\begin{eqnarray}\unicode[STIX]{x0394}T_{j}\gtrsim \frac{q\unicode[STIX]{x1D706}}{\unicode[STIX]{x1D705}_{j}}.\end{eqnarray}$$
Thermal inhomogeneity, maintained in our system, generates buoyancy forces, on which, of course, characteristics of gravity–capillary waves depend. This was demonstrated in Dore (Reference Dore1969) for a configuration of two layers of stratified fluids located one above the other. The problem studied in the present paper is further complicated by the fact that the changes in phase densities are determined by the heat transfer process. It may require not the classical Boussinesq approximation, but its modification for the case of a deformable interface (see Lobov, Lyubimov & Lyubimova Reference Lobov, Lyubimov and Lyubimova1996), when the temperature dependence of density is preserved in the gravity term in the condition of normal stress balance. Leaving consideration of the buoyancy factor for the future, hereinafter the liquid and its vapour are considered to be homogeneous media. This will simplify our analysis and make a more convenient comparison with the results of Dore (Reference Dore1969). The temperature dependence of their material parameters can affect effectively perturbations only at a characteristic space scale of their damping equal to the wavelength
 $\unicode[STIX]{x1D706}$
. If the temperature drops calculated for the indicated interval as
 $\unicode[STIX]{x0394}T_{j}\eqsim q\unicode[STIX]{x1D706}/\unicode[STIX]{x1D705}_{j}$
are small in comparison with the reference temperature
 $T_{s0}$
at the unperturbed liquid–vapour interface, then preference should be given to the homogeneous model. Hence,
 $$\begin{eqnarray}q\ll \min \left(\frac{\unicode[STIX]{x1D705}_{j}T_{s0}}{\unicode[STIX]{x1D706}}\right).\end{eqnarray}$$
Requirements (2.1) and (2.2) are quite feasible in practice. Thus, from data for the water–water vapour system of table 1, the permissible heat flux is estimated as
 $q\ll 9\times 10^{2}~\text{W}~\text{m}^{-2}$
for perturbations with the wavelength
 $\unicode[STIX]{x1D706}=1~\text{cm}$
. Given
 $q=10^{2}~\text{W}~\text{m}^{-2}$
, the value of subcooling in water is
 $\unicode[STIX]{x0394}T_{1}\gtrsim 1.5~\text{K}$
, and the value of overheating in water vapour is
 $\unicode[STIX]{x0394}T_{2}\gtrsim 42~\text{K}$
.
Parameters for water and its vapour.

3 Perturbation problem
Let the gravity–capillary length
 $d_{\unicode[STIX]{x1D6FE}g}=\sqrt{\unicode[STIX]{x1D6FE}/(\unicode[STIX]{x1D70C}_{1}-\unicode[STIX]{x1D70C}_{2})g}$
be taken as a length scale; the gravity–capillary time
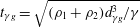 $t_{\unicode[STIX]{x1D6FE}g}=\sqrt{(\unicode[STIX]{x1D70C}_{1}+\unicode[STIX]{x1D70C}_{2})d_{\unicode[STIX]{x1D6FE}g}^{3}/\unicode[STIX]{x1D6FE}}$
is the time scale;
 $d_{\unicode[STIX]{x1D6FE}g}/t_{\unicode[STIX]{x1D6FE}g}$
is the scale for flow velocity;
 $(\unicode[STIX]{x1D70C}_{1}+\unicode[STIX]{x1D70C}_{2})d_{\unicode[STIX]{x1D6FE}g}^{2}/t_{\unicode[STIX]{x1D6FE}g}^{2}$
is the pressure scale;
 $qd_{\unicode[STIX]{x1D6FE}g}/(\unicode[STIX]{x1D705}_{1}+\unicode[STIX]{x1D705}_{2})$
is the temperature scale, and
 $(\unicode[STIX]{x1D70C}_{1}+\unicode[STIX]{x1D70C}_{2})d_{\unicode[STIX]{x1D6FE}g}/t_{\unicode[STIX]{x1D6FE}g}$
is the scale for the phase transition rate.
Our problem is characterized by the relative densities and coefficients of thermal conductivity of the liquid and its vapour,
 $$\begin{eqnarray}\tilde{\unicode[STIX]{x1D70C}}_{j}=\frac{\unicode[STIX]{x1D70C}_{j}}{\unicode[STIX]{x1D70C}_{1}+\unicode[STIX]{x1D70C}_{2}},\quad \tilde{\unicode[STIX]{x1D705}}_{j}=\frac{\unicode[STIX]{x1D705}_{j}}{\unicode[STIX]{x1D705}_{1}+\unicode[STIX]{x1D705}_{2}},\end{eqnarray}$$
by their Reynolds, Péclet and Prandtl numbers,
 $$\begin{eqnarray}Re_{j}=\frac{1}{\unicode[STIX]{x1D708}_{j}}\frac{d_{\unicode[STIX]{x1D6FE}g}^{2}}{t_{\unicode[STIX]{x1D6FE}g}},\quad Pe_{j}=\frac{1}{\unicode[STIX]{x1D712}_{j}}\frac{d_{\unicode[STIX]{x1D6FE}g}^{2}}{t_{\unicode[STIX]{x1D6FE}g}},\quad Pr_{j}=\frac{\unicode[STIX]{x1D708}_{j}}{\unicode[STIX]{x1D712}_{j}},\end{eqnarray}$$
and also by the dimensionless specific heat of phase transition,
 $$\begin{eqnarray}\unicode[STIX]{x1D6EC}=\frac{L(\unicode[STIX]{x1D70C}_{1}+\unicode[STIX]{x1D70C}_{2})}{q}\frac{d_{\unicode[STIX]{x1D6FE}g}}{t_{\unicode[STIX]{x1D6FE}g}}.\end{eqnarray}$$
For example, the values of the Reynolds, Péclet and Prandtl numbers for water and its vapour, calculated from the data of table 1, are
 $Re_{1}=1307.1$
,
 $Re_{2}=18.6$
,
 $Pe_{1}=2306.7$
,
 $Pe_{2}=19.6$
,
 $Pr_{1}=1.7$
and
 $Pr_{2}=1.05$
, respectively. The relative density and thermal conductivity of water vapour are
 $\tilde{\unicode[STIX]{x1D70C}}_{2}=6.2\times 10^{-4}$
and
 $\tilde{\unicode[STIX]{x1D705}}_{2}=3.4\times 10^{-2}$
, respectively. The corresponding values for water in the liquid state are found from the following expressions:
 $\tilde{\unicode[STIX]{x1D70C}}_{1}=1-\tilde{\unicode[STIX]{x1D70C}}_{2}$
and
 $\tilde{\unicode[STIX]{x1D705}}_{1}=1-\tilde{\unicode[STIX]{x1D705}}_{2}$
. The dimensionless specific heat of vapour generation is
 $\unicode[STIX]{x1D6EC}=3.4\times 10^{8}/q\;(\text{W}~\text{m}^{-2})$
, where the heat flux
 $q$
is measured in
 $\text{W}~\text{m}^{-2}$
.
The base state is characterized by the vertical gradients of pressure and temperature,
 $-\tilde{\unicode[STIX]{x1D70C}}_{j}\boldsymbol{e}_{z}/(\tilde{\unicode[STIX]{x1D70C}}_{1}-\tilde{\unicode[STIX]{x1D70C}}_{2})$
and
 $\boldsymbol{e}_{z}/\tilde{\unicode[STIX]{x1D705}}_{j}$
, where
 $\boldsymbol{e}_{z}$
is the unit vector of the vertical axis
 $z$
. In what follows, the gradients of hydrostatic pressure in the phases are taken into account in normal stress balance equation (3.14). There, along with the capillary pressure, they are included in the term proportional to the amplitude of shape perturbations of the surface,
 $F$
. The base temperature gradients are responsible for the presence of convective terms in the right-hand sides of energy equations (3.6).
The profiles
 $P_{j}(z)$
,
 $U_{jz}(z)$
and
 $\unicode[STIX]{x1D6E9}_{j}(z)$
specify the dependences of pressure, vertical velocity component, and temperature perturbations on the vertical coordinate
 $z$
, respectively. The relations for these quantities (see Konovalov et al.
Reference Konovalov, Lyubimov and Lyubimova2016), which were obtained from the linearized Navier–Stokes equations and also continuity and energy equations for homogeneous incompressible media, are written as
 $$\begin{eqnarray}\displaystyle & \displaystyle DP_{j}=0, & \displaystyle\end{eqnarray}$$
 $$\begin{eqnarray}\displaystyle & \displaystyle \left(\text{i}\unicode[STIX]{x1D714}-\frac{1}{Re_{j}}D\right)U_{jz}=-\frac{1}{\tilde{\unicode[STIX]{x1D70C}}_{j}}\frac{\text{d}P_{j}}{\text{d}z}, & \displaystyle\end{eqnarray}$$
 $$\begin{eqnarray}\displaystyle & \displaystyle \left(\text{i}\unicode[STIX]{x1D714}-\frac{1}{Pe_{j}}D\right)\unicode[STIX]{x1D6E9}_{j}=-\frac{U_{jz}}{\tilde{\unicode[STIX]{x1D705}}_{j}}. & \displaystyle\end{eqnarray}$$
Here,
 $\unicode[STIX]{x1D714}$
and
 $k$
are the eigenfrequency and wavenumber of perturbations, respectively.
The following notation is introduced:
 $$\begin{eqnarray}D\equiv \frac{\text{d}^{2}}{\text{d}z^{2}}-k^{2}.\end{eqnarray}$$
Velocity and temperature perturbations are damped in the layers of the liquid and its vapour at
 $z\rightarrow \pm \infty$
, respectively,
 $$\begin{eqnarray}\displaystyle & \displaystyle U_{jz}=0, & \displaystyle\end{eqnarray}$$
 $$\begin{eqnarray}\displaystyle & \displaystyle \unicode[STIX]{x1D6E9}_{j}=0. & \displaystyle\end{eqnarray}$$
Boundary conditions associated with the liquid–vapour interface are linearized and transported to the coordinate surface
 $z=0$
. These are conditions (3.10) and (3.11) below, which, when taken together, represent the mass balance of matter in the phases and define the rate of phase transition. Then follow the boundary conditions obtained from continuity of tangential velocity components (3.12), tangential stress continuity (3.13), normal stress balance (3.14), temperature continuity (3.15) and heat flux balance (3.16),
 $$\begin{eqnarray}\displaystyle & \displaystyle \text{i}\unicode[STIX]{x1D714}F=U_{1z}-\frac{\unicode[STIX]{x1D6EF}}{\tilde{\unicode[STIX]{x1D70C}}_{1}}, & \displaystyle\end{eqnarray}$$
 $$\begin{eqnarray}\displaystyle & \displaystyle \left[U_{z}-\frac{\unicode[STIX]{x1D6EF}}{\tilde{\unicode[STIX]{x1D70C}}}\right]=0, & \displaystyle\end{eqnarray}$$
 $$\begin{eqnarray}\displaystyle & \displaystyle \left[\frac{\text{d}U_{z}}{\text{d}z}\right]=0, & \displaystyle\end{eqnarray}$$
 $$\begin{eqnarray}\displaystyle & \displaystyle \left[\frac{\tilde{\unicode[STIX]{x1D70C}}}{Re}(D+2k^{2})U_{z}\right]=0, & \displaystyle\end{eqnarray}$$
 $$\begin{eqnarray}\displaystyle & \displaystyle \left[P-\frac{2\tilde{\unicode[STIX]{x1D70C}}}{Re}\frac{\text{d}U_{z}}{\text{d}z}\right]-(1+k^{2})F=0, & \displaystyle\end{eqnarray}$$
 $$\begin{eqnarray}\displaystyle & \displaystyle \left[\unicode[STIX]{x1D6E9}+\frac{F}{\tilde{\unicode[STIX]{x1D705}}}\right]=0, & \displaystyle\end{eqnarray}$$
 $$\begin{eqnarray}\displaystyle & \displaystyle \left[\tilde{\unicode[STIX]{x1D705}}\frac{\text{d}\unicode[STIX]{x1D6E9}}{\text{d}z}\right]=-\unicode[STIX]{x1D6EC}\unicode[STIX]{x1D6EF}. & \displaystyle\end{eqnarray}$$
Here,
 $F$
and
 $\unicode[STIX]{x1D6EF}$
are the amplitudes of the deviation of the interphase surface from the equilibrium position and rate of phase transition, respectively. The square brackets denote a jump of the corresponding quantities across the interface from the vapour to the liquid.
To close the boundary value problem, it is necessary to prescribe one more boundary condition, which will determine the thermodynamic state of the interface between the phases. Here, we restrict ourselves to its simplest approximate form, assuming that the temperature at the perturbed interface remains equal to the equilibrium saturation temperature
 $T_{s0}$
,
 $$\begin{eqnarray}\unicode[STIX]{x1D6E9}_{2}+\frac{F}{\tilde{\unicode[STIX]{x1D705}}_{2}}=0.\end{eqnarray}$$
This also allows us to ignore thermocapillary forces in condition (3.13). They will be considered in the appendix A of this paper with an emphasis on the weak effect produced by the relationship between the local saturation temperature and media pressure.
It is important to note that the deviation of the interface temperature from the equilibrium temperature occurs due to local temperature perturbations relative to the base state and also due to the displacement of the surface into regions in which the base temperature differs from the base temperature in the initial position. This is reflected in boundary conditions (3.15) and (3.17) containing both the fields
 $\unicode[STIX]{x1D6E9}_{j}$
and amplitude
 $F$
.
4 Modification of the problem
Before proceeding to derive an approximation relation for the eigenfrequency shift, we will modify equations (3.4)–(3.6) and boundary conditions (3.8)–(3.17), based on the approach proposed in Cerda & Tirapegui (Reference Cerda and Tirapegui1998), which is generalized here for solving the problem with heat and mass transfer.
General solutions for
 $U_{jz}$
can be represented in the form of the following sums:
 $$\begin{eqnarray}U_{jz}=U_{jz}^{I}+U_{jz}^{II}.\end{eqnarray}$$
Here,
 $U_{jz}^{I}$
are particular solutions of equations (3.5) for the corresponding
 $j$
, and
 $U_{jz}^{II}$
are general solutions of the homogeneous equations corresponding to (3.5),
 $$\begin{eqnarray}\left(\text{i}\unicode[STIX]{x1D714}-\frac{1}{Re_{j}}D\right)U_{jz}^{II}=0\end{eqnarray}$$
or, which is the same,
 $$\begin{eqnarray}DU_{jz}^{II}=\text{i}\unicode[STIX]{x1D714}Re_{j}U_{jz}^{II}.\end{eqnarray}$$
It is quite possible to assume that each of the solutions
 $U_{jz}^{I}$
corresponds to a potential viscous flow in an incompressible medium and
 $$\begin{eqnarray}DU_{jz}^{I}=0.\end{eqnarray}$$
Then relations (3.5) for
 $U_{jz}^{I}$
are reduced to the projections of the Euler equations on the vertical axis
 $z$
,
 $$\begin{eqnarray}U_{jz}^{I}=\frac{\text{i}}{\unicode[STIX]{x1D714}\tilde{\unicode[STIX]{x1D70C}}_{j}}\frac{\text{d}P_{j}}{\text{d}z}.\end{eqnarray}$$
Thus, it is possible not only to separate potential and rotational components of velocity from each other, that, in general, the well-known Helmholtz theorem allows, but also, in the framework of a linearized problem, we can associate the first with pressure perturbations in a unique way.
We write down a series of the transformations of boundary condition (3.13),
 $$\begin{eqnarray}\displaystyle \left[\frac{\tilde{\unicode[STIX]{x1D70C}}}{Re}(D+2k^{2})U_{z}\right] & \Rightarrow & \displaystyle \left[\frac{\tilde{\unicode[STIX]{x1D70C}}}{Re}(DU_{z}^{I}+DU_{z}^{II})+2k^{2}\frac{\tilde{\unicode[STIX]{x1D70C}}}{Re}U_{z}\right]\nonumber\\ \displaystyle & \Rightarrow & \displaystyle \left[\text{i}\unicode[STIX]{x1D714}\tilde{\unicode[STIX]{x1D70C}}U_{z}^{II}+2k^{2}\frac{\tilde{\unicode[STIX]{x1D70C}}}{Re}\left(\text{i}\unicode[STIX]{x1D714}F+\frac{\unicode[STIX]{x1D6EF}}{\tilde{\unicode[STIX]{x1D70C}}}\right)\right],\end{eqnarray}$$
associated with the sequential use of expressions (4.1), (4.3) and (4.4) as well as condition (3.10) and its analogue for the vapour (it comes from the replacements
 $U_{1z}\rightarrow U_{2z}$
and
 $\tilde{\unicode[STIX]{x1D70C}}_{1}\rightarrow \tilde{\unicode[STIX]{x1D70C}}_{2}$
). As a result, it reduces to the following form, fulfilled at
 $z=0$
and free of derivatives with respect to the vertical coordinate
 $z$
:
 $$\begin{eqnarray}\text{i}\unicode[STIX]{x1D714}[\tilde{\unicode[STIX]{x1D70C}}U_{z}^{II}]+2\text{i}\unicode[STIX]{x1D714}k^{2}\left[\frac{\tilde{\unicode[STIX]{x1D70C}}}{Re}\right]F+2k^{2}\left[\frac{1}{Re}\right]\unicode[STIX]{x1D6EF}=0.\end{eqnarray}$$
Using expressions (4.1) and condition (3.12), boundary condition (3.14), imposed at
 $z=0$
, can be rewritten as
 $$\begin{eqnarray}[P]-2\left[\frac{\tilde{\unicode[STIX]{x1D70C}}}{Re}\right]\left(\frac{\text{d}U_{1z}^{I}}{\text{d}z}+\frac{\text{d}U_{1z}^{II}}{\text{d}z}\right)-(1+k^{2})F=0.\end{eqnarray}$$
General solutions for
 $\unicode[STIX]{x1D6E9}_{j}$
can be represented as the following sums:
 $$\begin{eqnarray}\unicode[STIX]{x1D6E9}_{j}=\unicode[STIX]{x1D6E9}_{j}^{I}+\unicode[STIX]{x1D6E9}_{j}^{II}+\unicode[STIX]{x1D6E9}_{j}^{III}.\end{eqnarray}$$
Here,
 $\unicode[STIX]{x1D6E9}_{j}^{I}$
and
 $\unicode[STIX]{x1D6E9}_{j}^{II}$
are considered to be convective parts of temperature perturbations, which, by virtue of linearity of the problem, are set separately from each other by the corresponding velocity components,
 $U_{jz}^{I}$
and
 $U_{jz}^{II}$
, as
 $$\begin{eqnarray}\displaystyle & \displaystyle \left(\text{i}\unicode[STIX]{x1D714}-\frac{1}{Pe_{j}}D\right)\unicode[STIX]{x1D6E9}_{j}^{I}=-\frac{U_{jz}^{I}}{\tilde{\unicode[STIX]{x1D705}}_{j}}, & \displaystyle\end{eqnarray}$$
 $$\begin{eqnarray}\displaystyle & \displaystyle \left(\text{i}\unicode[STIX]{x1D714}-\frac{1}{Pe_{j}}D\right)\unicode[STIX]{x1D6E9}_{j}^{II}=-\frac{U_{jz}^{II}}{\tilde{\unicode[STIX]{x1D705}}_{j}}. & \displaystyle\end{eqnarray}$$
It is easy to verify that the sums
 $\unicode[STIX]{x1D6E9}_{j}^{I}+\unicode[STIX]{x1D6E9}_{j}^{II}$
are particular solutions of inhomogeneous equations (3.6), for this, it is enough to fold the left and right sides of expressions (4.10) and (4.11) and to use expressions (4.1). In turn,
 $\unicode[STIX]{x1D6E9}_{j}^{III}$
are general solutions of the homogeneous equations corresponding to (3.6),
 $$\begin{eqnarray}\left(\text{i}\unicode[STIX]{x1D714}-\frac{1}{Pe_{j}}D\right)\unicode[STIX]{x1D6E9}_{j}^{III}=0,\end{eqnarray}$$
and hereinafter are called the purely heat-conducting parts of temperature perturbations.
Owing to uniformity of the vertical temperature gradient in the base state, the convective-type perturbations of temperature,
 $\unicode[STIX]{x1D6E9}_{j}^{I}$
and
 $\unicode[STIX]{x1D6E9}_{j}^{II}$
, must repeat the dependences of the velocity components
 $U_{jz}^{I}$
and
 $U_{jz}^{II}$
on the vertical coordinate
 $z$
, that means
 $$\begin{eqnarray}\left.\begin{array}{@{}c@{}}\displaystyle D\unicode[STIX]{x1D6E9}_{j}^{I}=0,\\ \displaystyle \left(\text{i}\unicode[STIX]{x1D714}-\frac{1}{Re_{j}}D\right)\unicode[STIX]{x1D6E9}_{j}^{II}=0.\end{array}\right\}\end{eqnarray}$$
As a result, from (4.10) and (4.11), the following relations are obtained:
 $$\begin{eqnarray}\displaystyle & \displaystyle \unicode[STIX]{x1D6E9}_{j}^{I}=\frac{\text{i}U_{jz}^{I}}{\unicode[STIX]{x1D714}\tilde{\unicode[STIX]{x1D705}}_{j}}, & \displaystyle\end{eqnarray}$$
 $$\begin{eqnarray}\displaystyle & \displaystyle \unicode[STIX]{x1D6E9}_{j}^{II}=\frac{\text{i}}{\unicode[STIX]{x1D714}}\frac{Pr_{j}}{(Pr_{j}-1)}\frac{U_{jz}^{II}}{\tilde{\unicode[STIX]{x1D705}}_{j}}. & \displaystyle\end{eqnarray}$$
The non-potential flow in the boundary layers creates by convective heat transfer the corresponding thermal inhomogeneity (see (4.15)). It is interesting that, depending on values of the Prandtl number
 $Pr_{j}=Pe_{j}/Re_{j}$
, the thermal conductivity factor, leading to smoothing of the temperature field, can both weaken and strengthen the solutions of rotational type,
 $\unicode[STIX]{x1D6E9}_{j}^{II}$
, containing the combinations
 $Pr_{j}/(Pr_{j}-1)$
, without affecting the potential parts of temperature perturbations,
 $\unicode[STIX]{x1D6E9}_{j}^{I}$
. This mechanism introduces the viscosities of the phases in the thermal subtask, from which the intensity of the phase transition will be determined below.
By virtue of expressions (4.9), (4.14) and (4.15), boundary conditions (3.15)–(3.17), satisfied at
 $z=0$
, allow writing in the form that includes both the potential and rotational velocity components,
 $U_{jz}^{I}$
and
 $U_{jz}^{II}$
, and heat-conducting parts of temperature perturbations,
 $\unicode[STIX]{x1D6E9}_{j}^{III}$
, as well as their derivatives in the vertical coordinate
 $z$
. However, values of
 $U_{jz}^{I}$
and
 $\text{d}U_{jz}^{I}/\text{d}z$
can be expressed from the fields
 $U_{jz}^{II}$
and amplitudes
 $F$
and
 $\unicode[STIX]{x1D6EF}$
, using expressions (4.1) and conditions (3.10)–(3.12). The resulting relations
 $$\begin{eqnarray}\displaystyle & \displaystyle [\unicode[STIX]{x1D6E9}^{III}]+\frac{\text{i}}{\unicode[STIX]{x1D714}}\left[\frac{1}{\tilde{\unicode[STIX]{x1D70C}}\tilde{\unicode[STIX]{x1D705}}}\right]\unicode[STIX]{x1D6EF}=-\frac{\text{i}}{\unicode[STIX]{x1D714}}\left[\frac{1}{Pr-1}\frac{U_{z}^{II}}{\tilde{\unicode[STIX]{x1D705}}}\right], & \displaystyle\end{eqnarray}$$
 $$\begin{eqnarray}\displaystyle & \displaystyle \left[\tilde{\unicode[STIX]{x1D705}}\frac{\text{d}\unicode[STIX]{x1D6E9}^{III}}{\text{d}z}\right]+\unicode[STIX]{x1D6EC}\unicode[STIX]{x1D6EF}=-\frac{\text{i}}{\unicode[STIX]{x1D714}}\left[\frac{1}{Pr-1}\frac{\text{d}U_{z}^{II}}{\text{d}z}\right], & \displaystyle\end{eqnarray}$$
 $$\begin{eqnarray}\displaystyle & \displaystyle \unicode[STIX]{x1D6E9}_{2}^{III}+\frac{\text{i}}{\unicode[STIX]{x1D714}}\frac{1}{\tilde{\unicode[STIX]{x1D70C}}_{2}\tilde{\unicode[STIX]{x1D705}}_{2}}\unicode[STIX]{x1D6EF}=-\frac{\text{i}}{\unicode[STIX]{x1D714}}\frac{1}{Pr_{2}-1}\frac{U_{2z}^{II}}{\tilde{\unicode[STIX]{x1D705}}_{2}} & \displaystyle\end{eqnarray}$$
indicate a close relationship of the phase transition amplitude
 $\unicode[STIX]{x1D6EF}$
with the rotational solutions
 $U_{jz}^{II}$
and
 $\unicode[STIX]{x1D6E9}_{j}^{III}$
taken at
 $z=0$
. The heat flux imbalance at the interphase boundary is created by the process of non-stationary heat transfer in the viscous boundary layers. As was stated in Konovalov et al. (Reference Konovalov, Lyubimov and Lyubimova2017), the heat conduction factor plays an important role here. Indeed, in its absence, if we set
 $Pe_{j}\rightarrow \infty$
in energy equations (3.6), temperature and velocity perturbations are related as
 $\unicode[STIX]{x1D6E9}_{j}=\text{i}U_{jz}/\unicode[STIX]{x1D714}\tilde{\unicode[STIX]{x1D705}}_{j}$
. Hence, from conditions of continuity of horizontal velocity component (3.12) and heat flux balance (3.16), it follows that the phase transition rate is
 $\unicode[STIX]{x1D6EF}=0$
.
The solutions of (3.4), (4.2), (4.5) and (4.12) for perturbations in the liquid, which are damped at
 $z\rightarrow -\infty$
according to boundary conditions (3.8) and (3.9) and expressions (4.1), (4.9), (4.14) and (4.15), can be written as
 $$\begin{eqnarray}\displaystyle & \displaystyle P_{1}=-a_{1}\frac{\text{i}\unicode[STIX]{x1D714}\tilde{\unicode[STIX]{x1D70C}}_{1}}{k}\exp (kz), & \displaystyle\end{eqnarray}$$
 $$\begin{eqnarray}\displaystyle & \displaystyle U_{1z}^{I}=a_{1}\exp (kz), & \displaystyle\end{eqnarray}$$
 $$\begin{eqnarray}\displaystyle & \displaystyle U_{1z}^{II}=a_{2}\exp \left(\sqrt{k^{2}+\text{i}\unicode[STIX]{x1D714}Re_{1}}\times z\right), & \displaystyle\end{eqnarray}$$
 $$\begin{eqnarray}\displaystyle & \displaystyle \unicode[STIX]{x1D6E9}_{1}^{III}=a_{3}\exp \left(\sqrt{k^{2}+\text{i}\unicode[STIX]{x1D714}Pe_{1}}\times z\right). & \displaystyle\end{eqnarray}$$
For the vapour, it is necessary to use the following solutions, which go to zero at
 $z\rightarrow \infty$
:
 $$\begin{eqnarray}\displaystyle & \displaystyle P_{2}=b_{1}\frac{\text{i}\unicode[STIX]{x1D714}\tilde{\unicode[STIX]{x1D70C}}_{2}}{k}\exp (-kz), & \displaystyle\end{eqnarray}$$
 $$\begin{eqnarray}\displaystyle & \displaystyle U_{2z}^{I}=b_{1}\exp (-kz), & \displaystyle\end{eqnarray}$$
 $$\begin{eqnarray}\displaystyle & \displaystyle U_{2z}^{II}=b_{2}\exp \left(-\sqrt{k^{2}+\text{i}\unicode[STIX]{x1D714}Re_{2}}\times z\right), & \displaystyle\end{eqnarray}$$
 $$\begin{eqnarray}\displaystyle & \displaystyle \unicode[STIX]{x1D6E9}_{2}^{III}=b_{3}\exp \left(-\sqrt{k^{2}+\text{i}\unicode[STIX]{x1D714}Pe_{2}}\times z\right). & \displaystyle\end{eqnarray}$$
Substituting solutions (4.19)–(4.26) into boundary conditions (3.10)–(3.12), (4.7), (4.8) and (4.16)–(4.18), where, in the first three, expressions (4.1) are applied, we arrive at a system of homogeneous linear algebraic equations for the perturbation amplitudes
 $a_{1}$
,
 $a_{2}$
,
 $a_{3}$
,
 $b_{1}$
,
 $b_{2}$
,
 $b_{3}$
,
 $F$
and
 $\unicode[STIX]{x1D6EF}$
:
 $$\begin{eqnarray}\displaystyle & \displaystyle \text{i}\unicode[STIX]{x1D714}F=a_{1}+a_{2}-\frac{\unicode[STIX]{x1D6EF}}{\tilde{\unicode[STIX]{x1D70C}}_{1}}, & \displaystyle\end{eqnarray}$$
 $$\begin{eqnarray}\displaystyle & \displaystyle a_{1}+a_{2}-b_{1}-b_{2}-\left[\frac{1}{\tilde{\unicode[STIX]{x1D70C}}}\right]\unicode[STIX]{x1D6EF}=0, & \displaystyle\end{eqnarray}$$
 $$\begin{eqnarray}\displaystyle & \displaystyle ka_{1}+\sqrt{k^{2}+\text{i}\unicode[STIX]{x1D714}Re_{1}}\times a_{2}+kb_{1}+\sqrt{k^{2}+\text{i}\unicode[STIX]{x1D714}Re_{2}}\times b_{2}=0, & \displaystyle\end{eqnarray}$$
 $$\begin{eqnarray}\displaystyle & \displaystyle \text{i}\unicode[STIX]{x1D714}(\tilde{\unicode[STIX]{x1D70C}}_{1}a_{2}-\tilde{\unicode[STIX]{x1D70C}}_{2}b_{2})+2\text{i}\unicode[STIX]{x1D714}k^{2}\left[\frac{\tilde{\unicode[STIX]{x1D70C}}}{Re}\right]F+2k^{2}\left[\frac{1}{Re}\right]\unicode[STIX]{x1D6EF}=0, & \displaystyle\end{eqnarray}$$
 $$\begin{eqnarray}\displaystyle & \displaystyle -\frac{\text{i}\unicode[STIX]{x1D714}}{k}(\tilde{\unicode[STIX]{x1D70C}}_{1}a_{1}+\tilde{\unicode[STIX]{x1D70C}}_{2}b_{1})-2\left[\frac{\tilde{\unicode[STIX]{x1D70C}}}{Re}\right]\left(ka_{1}+\sqrt{k^{2}+\text{i}\unicode[STIX]{x1D714}Re_{1}}\times a_{2}\right)-(1+k^{2})F=0, & \displaystyle\end{eqnarray}$$
 $$\begin{eqnarray}\displaystyle & \displaystyle a_{3}-b_{3}+\frac{\text{i}}{\unicode[STIX]{x1D714}}\left[\frac{1}{\tilde{\unicode[STIX]{x1D70C}}\tilde{\unicode[STIX]{x1D705}}}\right]\unicode[STIX]{x1D6EF}=\frac{\text{i}}{\unicode[STIX]{x1D714}}\left(\frac{1}{Pr_{2}-1}\frac{b_{2}}{\tilde{\unicode[STIX]{x1D705}}_{2}}-\frac{1}{Pr_{1}-1}\frac{a_{2}}{\tilde{\unicode[STIX]{x1D705}}_{1}}\right), & \displaystyle\end{eqnarray}$$
 $$\begin{eqnarray}\displaystyle & & \displaystyle \sqrt{k^{2}+\text{i}\unicode[STIX]{x1D714}Pe_{1}}\times \tilde{\unicode[STIX]{x1D705}}_{1}a_{3}+\sqrt{k^{2}+\text{i}\unicode[STIX]{x1D714}Pe_{2}}\times \tilde{\unicode[STIX]{x1D705}}_{2}b_{3}+\unicode[STIX]{x1D6EC}\unicode[STIX]{x1D6EF}\nonumber\\ \displaystyle & & \displaystyle \quad =-\frac{\text{i}}{\unicode[STIX]{x1D714}}\left(\frac{\sqrt{k^{2}+\text{i}\unicode[STIX]{x1D714}Re_{2}}}{Pr_{2}-1}b_{2}+\frac{\sqrt{k^{2}+\text{i}\unicode[STIX]{x1D714}Re_{1}}}{Pr_{1}-1}a_{2}\right),\end{eqnarray}$$
 $$\begin{eqnarray}b_{3}-\frac{\text{i}}{\unicode[STIX]{x1D714}}\left[\frac{1}{\tilde{\unicode[STIX]{x1D70C}}\tilde{\unicode[STIX]{x1D705}}}\right]\unicode[STIX]{x1D6EF}=-\frac{\text{i}}{\unicode[STIX]{x1D714}}\frac{1}{Pr_{2}-1}\frac{b_{2}}{\tilde{\unicode[STIX]{x1D705}}_{2}}.\end{eqnarray}$$
5 A long-wave correction to the eigenfrequency
In order to obtain necessary estimates from the system of (4.27)–(4.34), it is proposed to divide it into a number of subsystems. The perturbation theory developed below corresponds to the case of a light vapour, weak viscous dissipation in a liquid and its vapour, and same phase transition. The first two requirements are quite obvious, and the last condition is satisfied in the range of heat flux values where the homogeneous model is correct (see (2.2)). This follows from the results of numerical calculations in Konovalov et al. (Reference Konovalov, Lyubimov and Lyubimova2017), considering the similar problem of the Rayleigh–Taylor instability for a configuration of thick layers of phases. Also, we imposed the additional requirement associated with small values of the wavenumber of perturbations.
The eigenfrequency is represented as
 $$\begin{eqnarray}\unicode[STIX]{x1D714}=\unicode[STIX]{x1D714}_{0}+\unicode[STIX]{x0394}\unicode[STIX]{x1D714}_{Re}+\unicode[STIX]{x0394}\unicode[STIX]{x1D714}_{\unicode[STIX]{x1D6EC}}.\end{eqnarray}$$
Here
 $\unicode[STIX]{x1D714}_{0}$
is its principal value in the absence of dissipation;
 $\unicode[STIX]{x0394}\unicode[STIX]{x1D714}_{Re}$
and
 $\unicode[STIX]{x0394}\unicode[STIX]{x1D714}_{\unicode[STIX]{x1D6EC}}$
are small corrections related to the influence of viscosity and phase transition, respectively.
Next, we introduce a phenomenological coefficient
 $\unicode[STIX]{x1D6FC}$
expressing the linear amplitude coupling
 $$\begin{eqnarray}\unicode[STIX]{x1D6EF}=-\unicode[STIX]{x1D6FC}F,\end{eqnarray}$$
which is a simple mathematical consequence of the existence of the base state of the system with a flat interphase boundary (
 $F=0$
) without phase transition (
 $\unicode[STIX]{x1D6EF}=0$
). This seems to be convenient if it is possible to separate solutions of the dynamic and thermal subtasks, as for example in the framework of the quasi-equilibrium approximation in Hsieh (Reference Hsieh1978). Generally speaking, the coefficient
 $\unicode[STIX]{x1D6FC}$
depends on all processes that take place in a perturbed two-layer, two-phase system (see Konovalov et al.
Reference Konovalov, Lyubimov and Lyubimova2017), namely the mechanisms of thermal conductivity, convective heat transfer, viscosity and phase transition.
The phase transition through its velocity
 $\unicode[STIX]{x1D6EF}$
, entering boundary conditions of mass balance (3.10) and (3.11), tends to smooth out the perturbed interface (see Hsieh Reference Hsieh1972, Reference Hsieh1978; Ievlev & Son Reference Ievlev and Son1980), regardless of the viscosities of the liquid and its vapour, which act through the viscous terms in normal stress balance (3.14) and the viscous correction to pressure (see Joseph & Wang Reference Joseph and Wang2004). This allows us to calculate the contribution of the phase transition for a given value of the phenomenological coefficient
 $\unicode[STIX]{x1D6FC}$
through solving the inviscid problem (see Hsieh Reference Hsieh1978). In doing so, we neglect the secondary effect of redistribution of matter in the phases on the pressure changes produced by viscous flow. According to Adham-Khodaparast et al. (Reference Adham-Khodaparast, Kawaji and Antar1995), it just causes the cut-off wavenumber shift for the Rayleigh–Taylor instability towards the long-wave range, that is controlled in our case by the product of two small quantities, namely the sum of the kinematic viscosities,
 $Re_{1}^{-1}+Re_{2}^{-1}$
, and the coefficient
 $\unicode[STIX]{x1D6FC}$
.
Taking into account the remarks of the previous paragraph, we temporarily exclude from consideration the effect of viscosities of the liquid and its vapour, solving the problem of an irrotational flow of inviscid media. The condition that the determinant of system (4.27), (4.28) and (4.31) is equal to zero, taking into account
 $a_{2}=b_{2}=0$
and
 $\tilde{\unicode[STIX]{x1D70C}}_{1}+\tilde{\unicode[STIX]{x1D70C}}_{2}=1$
, gives us the dispersion relation
 $$\begin{eqnarray}\unicode[STIX]{x1D714}^{2}+2\unicode[STIX]{x1D6FC}\text{i}\unicode[STIX]{x1D714}-k(1+k^{2})=0.\end{eqnarray}$$
At
 $\unicode[STIX]{x1D6FC}=0$
, the frequency of undamped waves in the absence of phase transition is found as
 $$\begin{eqnarray}\unicode[STIX]{x1D714}_{0}=\sqrt{k(1+k^{2})}.\end{eqnarray}$$
Under the condition
 $\unicode[STIX]{x1D6FC}\ll 1$
, the small contribution of the latter to the eigenfrequency
 $\unicode[STIX]{x1D714}=\unicode[STIX]{x1D714}_{0}+\unicode[STIX]{x0394}\unicode[STIX]{x1D714}_{\unicode[STIX]{x1D6EC}}$
is
 $$\begin{eqnarray}\unicode[STIX]{x0394}\unicode[STIX]{x1D714}_{\unicode[STIX]{x1D6EC}}\approx -\text{i}\unicode[STIX]{x1D6FC}.\end{eqnarray}$$
Let us return to consideration of the viscosities of the phases. The value
 $\unicode[STIX]{x0394}\unicode[STIX]{x1D714}_{Re}$
should be determined from system (4.27)–(4.31) in the absence of phase transition, when, in (4.27), (4.28) and (4.30), the amplitude
 $\unicode[STIX]{x1D6EF}$
is taken to be zero. Owing to the insignificance of the vapour density, the liquid–vapour interface is practically free. In the limit
 $\tilde{\unicode[STIX]{x1D70C}}_{2}\rightarrow 0$
and
 $\tilde{\unicode[STIX]{x1D70C}}_{1}\rightarrow 1$
, this allows us to estimate from (4.27) and (4.30) the amplitudes of velocity perturbations in the liquid as
 $$\begin{eqnarray}\displaystyle & \displaystyle a_{1}\approx \left(\text{i}\unicode[STIX]{x1D714}+\frac{2k^{2}}{Re_{1}}\right)F, & \displaystyle\end{eqnarray}$$
 $$\begin{eqnarray}\displaystyle & \displaystyle a_{2}\approx -\frac{2k^{2}}{Re_{1}}F. & \displaystyle\end{eqnarray}$$
Equations (4.28) and (4.29), where substitutions (5.6) and (5.7) are made, give the possibility to express the amplitudes of velocity perturbations in the vapour as
 $$\begin{eqnarray}\displaystyle \left.\begin{array}{@{}c@{}}\displaystyle b_{1}=\left\{\frac{\sqrt{k^{2}+\text{i}\unicode[STIX]{x1D714}Re_{2}}+k}{\sqrt{k^{2}+\text{i}\unicode[STIX]{x1D714}Re_{2}}-k}\left(\text{i}\unicode[STIX]{x1D714}+\frac{2k^{2}}{Re_{1}}\right)-\frac{\sqrt{k^{2}+\text{i}\unicode[STIX]{x1D714}Re_{1}}+\sqrt{k^{2}+\text{i}\unicode[STIX]{x1D714}Re_{2}}}{\sqrt{k^{2}+\text{i}\unicode[STIX]{x1D714}Re_{2}}-k}\frac{2k^{2}}{Re_{1}}\right\}F,\\ \displaystyle b_{2}=\left\{\frac{\sqrt{k^{2}+\text{i}\unicode[STIX]{x1D714}Re_{1}}+k}{\sqrt{k^{2}+\text{i}\unicode[STIX]{x1D714}Re_{2}}-k}\frac{2k^{2}}{Re_{1}}-\frac{2k}{\sqrt{k^{2}+\text{i}\unicode[STIX]{x1D714}Re_{2}}-k}\left(\text{i}\unicode[STIX]{x1D714}+\frac{2k^{2}}{Re_{1}}\right)\right\}F.\end{array}\right\} & & \displaystyle \nonumber\\ \displaystyle & & \displaystyle\end{eqnarray}$$
These relationships can be simplified by considering
 $k\ll 1$
,
 $Re_{2}\gg 1$
and
 $\sqrt{Re_{1}}\gg \sqrt{Re_{2}}$
. Recall that, for water and its vapour,
 $Re_{1}=1307.1$
and
 $Re_{2}=18.6$
. Then
 $$\begin{eqnarray}b_{1}\approx \text{i}\unicode[STIX]{x1D714}F\end{eqnarray}$$
and
 $$\begin{eqnarray}b_{2}\approx -2\text{i}^{1/2}k\sqrt{\frac{\unicode[STIX]{x1D714}}{Re_{2}}}F.\end{eqnarray}$$
Let us substitute expressions (5.9) and (5.10) in (4.27), (4.30) and (4.31), where the following simplifications are applied:
 $$\begin{eqnarray}\tilde{\unicode[STIX]{x1D70C}}_{1}\approx 1,\quad \left[\frac{\tilde{\unicode[STIX]{x1D70C}}}{Re}\right]\approx \frac{1}{Re_{1}},\end{eqnarray}$$
arising from the requirements for the properties of the liquid and its vapour when formulating the problem at the beginning of § 2. As a result, we obtain a system of homogeneous linear algebraic equations for the amplitudes
 $a_{1}$
,
 $a_{2}$
and
 $F$
. The condition that the determinant of this system is zero will lead us to the following dispersion relation (in which the first neglected term was of order
 $Re_{1}^{-3/2}$
):
 $$\begin{eqnarray}\unicode[STIX]{x1D714}^{2}-4\text{i}\unicode[STIX]{x1D714}\left(\frac{k^{2}}{Re_{1}}+\text{i}^{1/2}\tilde{\unicode[STIX]{x1D70C}}_{2}k\sqrt{\frac{\unicode[STIX]{x1D714}}{Re_{2}}}\right)-k(1+k^{2})+\cdots =0.\end{eqnarray}$$
Taking into account the principal eigenfrequency value
 $\unicode[STIX]{x1D714}_{0}$
(see (5.4)), we obtain its ‘viscous’ correction
 $$\begin{eqnarray}\unicode[STIX]{x0394}\unicode[STIX]{x1D714}_{Re}=\frac{2\text{i}k^{2}}{Re_{1}}+2\text{i}^{3/2}\tilde{\unicode[STIX]{x1D70C}}_{2}k\sqrt{\frac{\unicode[STIX]{x1D714}_{0}}{Re_{2}}}.\end{eqnarray}$$
This represents in a dimensionless form the result of Dore (Reference Dore1978) (accurate to capillary forces additionally taken into account) for the effects of viscosities of a liquid and gas (vapour) in the absence of phase transformation.
Let us calculate an approximate value of the phenomenological coefficient
 $\unicode[STIX]{x1D6FC}$
. To do this, we focus on (4.32)–(4.34), in which the viscous solution of the problem expressed by the amplitudes
 $a_{2}$
and
 $b_{2}$
is used (see (5.7) and (5.10)). In fact, it should itself depend on the phase transition. In neglecting this, we introduce an error of the second order of smallness in the coefficient
 $\unicode[STIX]{x1D6FC}$
. We arrive at a system of inhomogeneous linear algebraic equations for the amplitudes
 $a_{3}$
,
 $b_{3}$
and
 $\unicode[STIX]{x1D6EF}$
. Their inhomogeneous parts are proportional to the amplitude
 $F$
. Solving the system with respect to the amplitude
 $\unicode[STIX]{x1D6EF}$
, the approximate value of the phenomenological coefficient
 $\unicode[STIX]{x1D6FC}=-\unicode[STIX]{x1D6EF}/F$
is found as
 $$\begin{eqnarray}\unicode[STIX]{x1D6FC}\approx -\frac{2\tilde{\unicode[STIX]{x1D70C}}_{2}k}{\displaystyle \left(\sqrt{Pr_{2}}+1\right)\left(\text{i}^{-1/2}\sqrt{Pe_{2}/\unicode[STIX]{x1D714}_{0}}+\tilde{\unicode[STIX]{x1D70C}}_{2}\unicode[STIX]{x1D6EC}\right)}.\end{eqnarray}$$
Here, final expression (5.14) is simplified taking into account that
 $\tilde{\unicode[STIX]{x1D70C}}_{2}\ll \tilde{\unicode[STIX]{x1D70C}}_{1}\approx 1$
,
 $\tilde{\unicode[STIX]{x1D705}}_{2}\ll \tilde{\unicode[STIX]{x1D705}}_{1}\approx 1$
,
 $k\ll 1$
,
 $Re_{2}\gg 1$
,
 $\sqrt{Re_{1}}\gg \sqrt{Re_{2}}$
,
 $Pe_{1}\gg 1$
and
 $Pe_{2}\gg 1$
(see table 1).
Substituting relation (5.14) into (5.5) gives the following approximation for the correction to the principal eigenfrequency value,
 $\unicode[STIX]{x1D714}_{0}=\sqrt{k(1+k^{2})}$
, associated with the phase transition:
 $$\begin{eqnarray}\unicode[STIX]{x0394}\unicode[STIX]{x1D714}_{\unicode[STIX]{x1D6EC}}=\frac{2\text{i}\tilde{\unicode[STIX]{x1D70C}}_{2}k}{\displaystyle \left(\sqrt{Pr_{2}}+1\right)\left(\text{i}^{-1/2}\sqrt{Pe_{2}/\unicode[STIX]{x1D714}_{0}}+\tilde{\unicode[STIX]{x1D70C}}_{2}\unicode[STIX]{x1D6EC}\right)}.\end{eqnarray}$$
The quantity
 $\unicode[STIX]{x0394}\unicode[STIX]{x1D714}_{\unicode[STIX]{x1D6EC}}$
, or rather its real and imaginary parts, monotonically approach saturation in the limit of strong heating,
 $$\begin{eqnarray}\unicode[STIX]{x0394}\unicode[STIX]{x1D714}_{\unicode[STIX]{x1D6EC}}(\unicode[STIX]{x1D6EC}\rightarrow 0)=\frac{\sqrt{2}(\text{i}-1)\tilde{\unicode[STIX]{x1D70C}}_{2}k}{\sqrt{Pr_{2}}+1}\sqrt{\frac{\unicode[STIX]{x1D714}_{0}}{Pe_{2}}}.\end{eqnarray}$$
Estimate (5.16), like the increment due to the vapour viscosity (the second term in expression (5.13)), corresponds to an increase in the damping coefficient of gravity–capillary waves,
 $\text{Im}\,\unicode[STIX]{x1D714}$
, and equivalent decrease in their real frequency
 $\text{Re}\,\unicode[STIX]{x1D714}$
. In compliance with (5.16), taking into account
 $Pe_{2}=Pr_{2}Re_{2}$
, the changes in the wave characteristics caused by the phase transition are limited to the (
 $Pr_{2}+\sqrt{Pr_{2}}$
)-th parts of the corresponding contributions of the vapour viscosity.
The part of the dependence
 $\unicode[STIX]{x0394}\unicode[STIX]{x1D714}_{\unicode[STIX]{x1D6EC}}(\unicode[STIX]{x1D6EC})$
far from the limiting value (5.16) is approximated by the inverse proportionality of the parameter
 $\unicode[STIX]{x1D6EC}$
, provided that
 $\unicode[STIX]{x1D6EC}\gg \tilde{\unicode[STIX]{x1D70C}}_{2}^{-1}\sqrt{Pe_{2}/\unicode[STIX]{x1D714}_{0}}$
. This implies an increment to the damping coefficient of perturbations,
 $$\begin{eqnarray}\unicode[STIX]{x0394}\unicode[STIX]{x1D714}_{\unicode[STIX]{x1D6EC}}\left(\unicode[STIX]{x1D6EC}\gg \frac{\sqrt{Pe_{2}/\unicode[STIX]{x1D714}_{0}}}{\tilde{\unicode[STIX]{x1D70C}}_{2}}\right)=\frac{2\text{i}k}{\left(\sqrt{Pr_{2}}+1\right)\unicode[STIX]{x1D6EC}},\end{eqnarray}$$
at a slight variation in their real frequency. Note that, in contrast with (5.16), this result is more reliable in practice, since it can be approached not running the risk of violating homogeneity criterion (2.2).
6 Numerical results
For numerical verification of the estimates written above, one should return to amplitude system (4.27)–(4.34). It is worthwhile to evaluate its determinant numerically, for example by the method of Gaussian elimination with selection of a leading element. A requirement of equality to zero, applied to the real and imaginary parts of the complex determinant, yields a system of two dispersion relations. Its solutions for the real (real frequency) and imaginary (damping coefficient) parts of the eigenfrequency
 $\unicode[STIX]{x1D714}$
were also determined numerically by the coordinate descent method with the iteration starting point given by the sum of (5.4), (5.13) and (5.15). The particular cases without heat and mass transfer or vapour viscosity are considered in a similar way through a truncation of system (4.27)–(4.34).
The real (graphs on the left) and imaginary (graphs on the right) parts of the correction to the eigenfrequency of perturbations due to viscosity as a function of the wavenumber. The graphs are constructed in linear (a,b) and logarithmic (c,d) scales. Solid lines demonstrate numerical data for the general case. Dashed lines show the results of approximation (5.13). Long-dashed lines describe numerical data for the case of inviscid vapour.
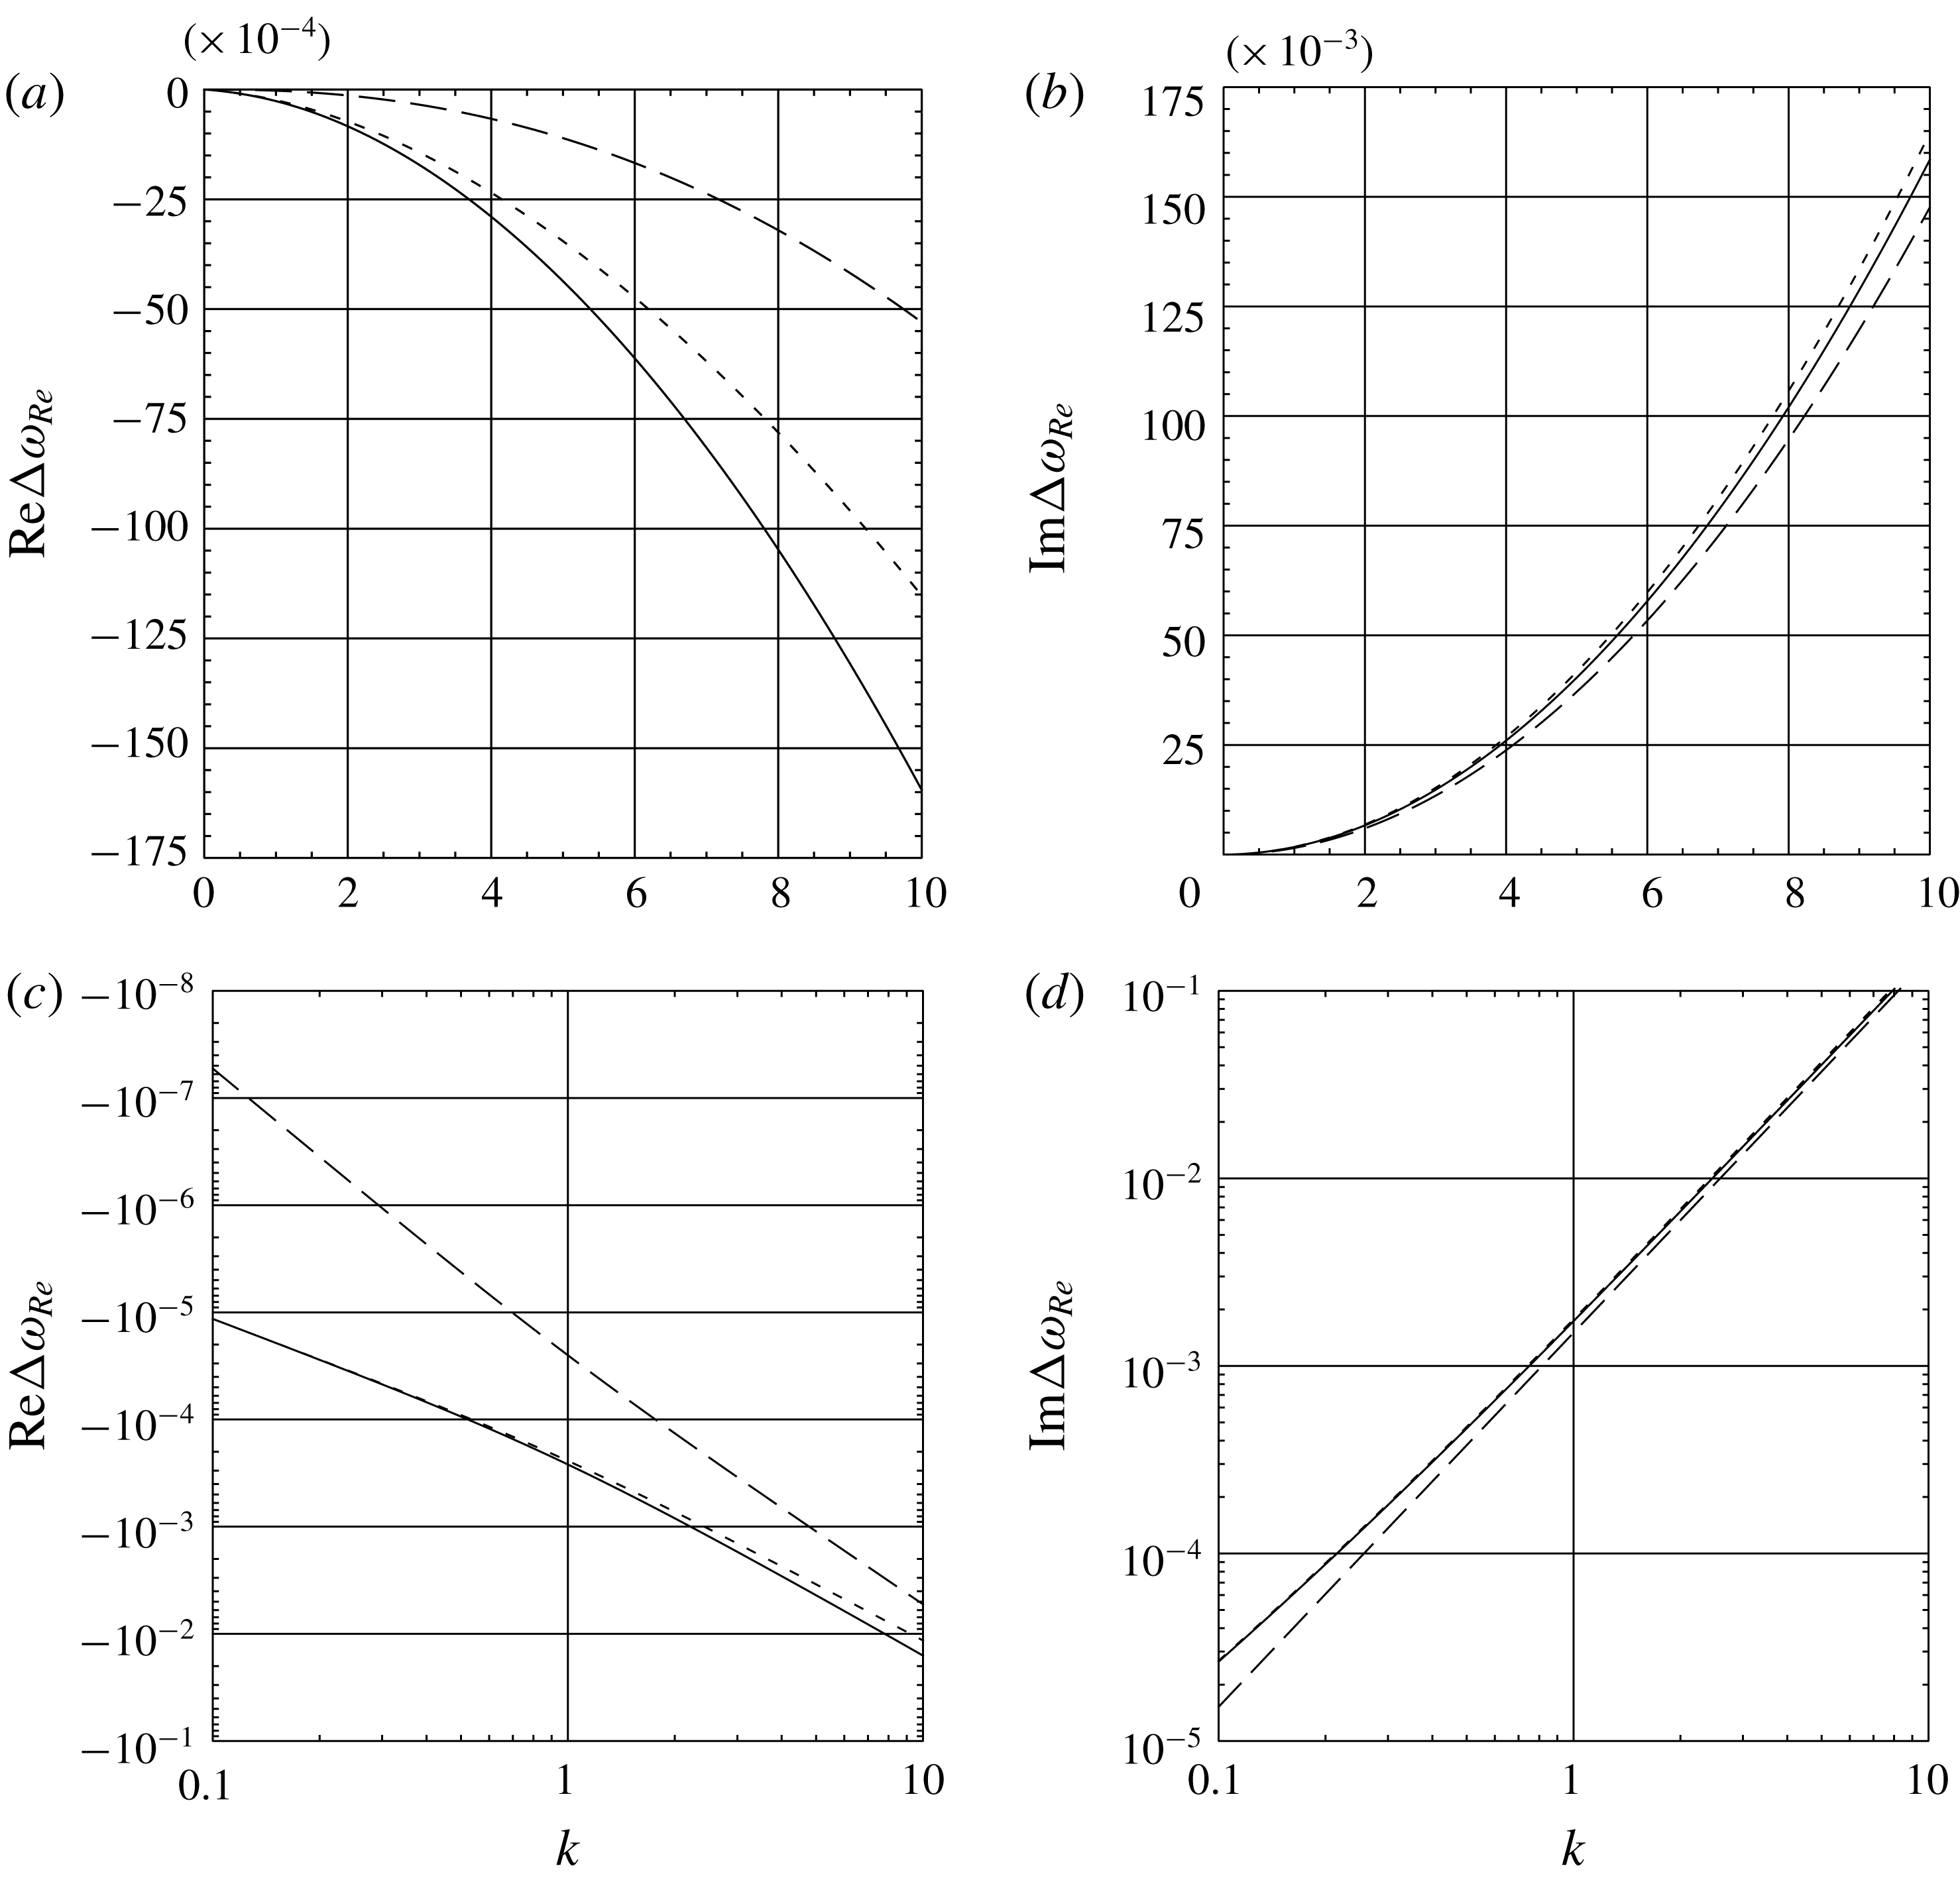
Calculations were carried out on the basis of the data of table 1 in § 2 for water and water vapour. This should be considered as a supplement to the approximate analysis in § 5, which is a generalization of Dore (Reference Dore1978), including capillarity and transfer of matter between the phases. Expression (5.13) (dashed lines in figure 2
a,c) estimates well the imaginary part of the correction
 $\unicode[STIX]{x0394}\unicode[STIX]{x1D714}_{Re}$
in a wide range of the wavenumber
 $k$
. Thus, at
 $k=10$
, the relative error is less than
 $4\,\%$
and decreases with increasing the perturbation wavelength. As for its real part
 $\text{Re}\,\unicode[STIX]{x0394}\unicode[STIX]{x1D714}_{Re}$
(see figure 2
a,c), this error already exceeds
 $7\,\%$
for
 $k=1$
but is also found to be much smaller in the long-wave range.
Viscous damping in the water–water vapour system.

The effect of phase transition in the water–water vapour system.

In full accordance with the conclusions of Dore (Reference Dore1978), the numerical calculations confirm the importance of considering the viscosity of the light vapour. The corresponding changes in the real and imaginary parts of the correction
 $\unicode[STIX]{x0394}\unicode[STIX]{x1D714}_{Re}$
as well as those related to the viscosity of the liquid (see solid and long-dashed lines in figure 2
a–d) increase with a growth of the wavenumber
 $k$
. But, the factor of vapour viscosity becomes of principal importance for sufficiently long waves.
The imaginary part of the correction to the eigenfrequency of perturbations due to the phase transition as a function of the parameter
 $\unicode[STIX]{x1D6EC}$
(graphs on (a)) and wavenumber (graphs on (b)). The graphs on the left are plotted for the following values of the wavenumber
 $k$
:
 $0.1$
(1),
 $1$
(2) and
 $10$
(3). The graphs on the right are plotted for the following values of the parameter
 $\unicode[STIX]{x1D6EC}$
:
 $10^{4}$
(1),
 $10^{6}$
(2) and
 $10^{8}$
(3). Solid lines demonstrate numerical data. Dashed lines correspond to the results of approximation (5.15). Long-dashed lines describe the numerically calculated contribution of media viscosities,
 $\text{Im}\unicode[STIX]{x0394}\unicode[STIX]{x1D714}_{Re}$
.

Move on to the effect of phase transition. There is a horizontal asymptote in the graph
 $\text{Re}\unicode[STIX]{x0394}\unicode[STIX]{x1D714}_{\unicode[STIX]{x1D6EC}}(\unicode[STIX]{x1D6EC})$
in figure 3(a), associated with the upper bound on the intensity of the phase transition (see Konovalov et al.
Reference Konovalov, Lyubimov and Lyubimova2016, Reference Konovalov, Lyubimov and Lyubimova2017). A passage to the asymptote begins at
 $\unicode[STIX]{x1D6EC}\lesssim 10^{3}\,k^{-1}$
(here the contributions of the phase transition and viscosity of the media differ at most by an order of magnitude). It should be emphasized once more that we use the model of homogeneous media, which is in reality correct only at
 $\unicode[STIX]{x1D6EC}\gg 6\times 10^{5}~\text{k}^{-1}$
(see (2.2)).
The ratio of the real and imaginary parts of the correction to the eigenfrequency of perturbations due to the phase transition as a function of the parameter
 $\unicode[STIX]{x1D6EC}$
. The graphs are constructed for the following values of the wavenumber
 $k$
:
 $0.1$
(1),
 $1$
(2) and
 $10$
(3), based on the results of numerical calculations (solid lines) and approximation (5.15) (dashed lines).

The smaller the wavenumber
 $k$
is, the closer to each other are the numerical and estimated (see (5.15)) data for the imaginary part of the correction
 $\unicode[STIX]{x0394}\unicode[STIX]{x1D714}_{\unicode[STIX]{x1D6EC}}$
(compare solid and dashed lines in figure 3
a,b). In general, we can observe a growth of
 $\text{Im}\unicode[STIX]{x0394}\unicode[STIX]{x1D714}_{\unicode[STIX]{x1D6EC}}$
with increasing
 $k$
. In figure 4, it is convenient to demonstrate the ratio of the real and imaginary parts,
 $\text{Re}\unicode[STIX]{x0394}\unicode[STIX]{x1D714}_{\unicode[STIX]{x1D6EC}}/\text{Im}\unicode[STIX]{x0394}\unicode[STIX]{x1D714}_{\unicode[STIX]{x1D6EC}}$
, which is also more accurately described by approximation (5.15) for the case of small
 $k$
. Note that the denominator
 $\text{Im}\unicode[STIX]{x0394}\unicode[STIX]{x1D714}_{\unicode[STIX]{x1D6EC}}$
is always positive. However, the quantity
 $\text{Re}\unicode[STIX]{x0394}\unicode[STIX]{x1D714}_{\unicode[STIX]{x1D6EC}}$
in the numerator can change its sign. By the way, this is not evident from the graphs corresponding to approximation (5.15). Estimate (5.17), which apparently requires smallness of
 $|\text{Re}\unicode[STIX]{x0394}\unicode[STIX]{x1D714}_{\unicode[STIX]{x1D6EC}}/\text{Im}\unicode[STIX]{x0394}\unicode[STIX]{x1D714}_{\unicode[STIX]{x1D6EC}}|$
, is not always correct.
Tables 2 and 3 represent examples of computations, which comply with possible experimental conditions. From these tables, it is clear that the phase transition as a factor of stability can be easily neglected at least for the interface between thick layers of a liquid and its vapour.
7 Conclusion
We have considered a two-layer system of a subcooled liquid, like water, lying beneath a layer of its vapour heated from above. The problem of linear stability of a stationary base state of the two phases in a field of gravity has been formulated. In this state, the phases are in mechanical equilibrium. Moreover, heat fluxes are balanced on the flat liquid–vapour interface that is kept at the saturation temperature, thus excluding the possibility of a phase transition in the absence of perturbations.
The theory developed has a potential significance in determining material parameters of a liquid that is in thermodynamic equilibrium with its vapour according to characteristics of waves propagating along the interface.
The model of thick layers of homogeneous media has been validated. The validity criteria for the above-mentioned assumption place an upper bound on the heat flux and, in the case when its value is specified, determine the required minimal temperature drops the in liquid and its vapour.
Dissipative and non-dissipative components of the problem solution have been separated. This allows us to relate in boundary conditions the rate of phase transition to heat-conducting parts of temperature perturbations and rotational parts of velocity perturbations.
The damping coefficient and correction to the eigenfrequency of undamped gravity–capillary waves have been estimated. The obtained approximations have been compared with the results of numerical calculations. It has been found that the lower the wavenumber is, the smaller the produced error is.
The part of our study that is devoted to the effect of media viscosity is an extension to the investigation made in Dore (Reference Dore1978), which offers an approximation for the case of gravity waves in the absence of heat and mass transfer. The calculations show that the given approximate theory adequately estimates the damping coefficient but is not as accurate regarding the eigenfrequency shift. With an increase of the wavelength, the contributions of the viscosities of the liquid and its vapour decrease, but the relative role of the latter increases. Hence, the numerical data obtained in this paper confirm the conclusions of Dore (Reference Dore1978).
It should not be supposed that the contribution of phase transformation can be comparable with the contribution associated with viscous dissipation. Even in the limit of strong heating, the effects of heat and mass transfer and viscosity of the vapour differ in magnitude by several times in favour of the latter. For heat fluxes acceptable in the model of thick layers of homogeneous media, this difference is as large as three orders of magnitude.
The effects of thermocapillarity and the relationship between the saturation temperature and media pressures are found to be rather small. They determine a non-zero increment to the coefficient of perturbation damping in the limit of very weak heating.
Appendix A. The role of media pressure and thermocapillarity
In the base part of this investigation, we neglected the thermocapillary forces generated by a difference between the temperature at the perturbed interface and equilibrium saturation temperature
 $T_{s0}$
. Their consideration results in the following condition for balance of tangential stresses, which should replace the condition of their continuity (3.13), prescribed at
 $z=0$
:
 $$\begin{eqnarray}\left[\frac{\tilde{\unicode[STIX]{x1D70C}}}{Re}\left(\frac{\text{d}^{2}}{\text{d}z^{2}}+k^{2}\right)U_{z}\right]=k\frac{M}{\unicode[STIX]{x1D6EC}}\left(\unicode[STIX]{x1D6E9}_{2}+\frac{F}{\tilde{\unicode[STIX]{x1D705}}_{2}}\right).\end{eqnarray}$$
Here, the dimensionless thermocapillarity parameter
 $$\begin{eqnarray}M=\frac{Lm}{(\unicode[STIX]{x1D705}_{1}+\unicode[STIX]{x1D705}_{2})}\frac{t_{\unicode[STIX]{x1D6FE}g}}{d_{\unicode[STIX]{x1D6FE}g}}\end{eqnarray}$$
contains the corresponding dimensional parameter
 $m$
and is estimated from the data of table 1 in § 2 for the water–water vapour system as
 $M=3.7\times 10^{3}$
.
It is quite reasonable to assume that the liquid–vapour interface is in the state of local thermodynamic equilibrium, which implies that its temperature directly depends on the pressure of the media. Under the crudest approximation, the above-mentioned dependence can be ignored, which leads to constant temperature condition (3.17) set at
 $z=0$
.
Another approximate approach (see, for example, Ievlev & Son Reference Ievlev and Son1980; Hsieh Reference Hsieh2003) is based on the use of the famous Clausius–Clapeyron equation relating temperature and pressure perturbations of a saturated vapour at
 $z=0$
as
 $$\begin{eqnarray}\unicode[STIX]{x1D6E9}_{2}+\frac{F}{\tilde{\unicode[STIX]{x1D705}}_{2}}=\unicode[STIX]{x1D6EC}\unicode[STIX]{x1D6F1}\left(\frac{1}{\tilde{\unicode[STIX]{x1D70C}}_{2}}-\frac{1}{\tilde{\unicode[STIX]{x1D70C}}_{1}}\right)\left(P_{2}-\frac{\tilde{\unicode[STIX]{x1D70C}}_{2}}{\tilde{\unicode[STIX]{x1D70C}}_{1}-\tilde{\unicode[STIX]{x1D70C}}_{2}}F\right).\end{eqnarray}$$
Here, the dimensionless parameter
 $$\begin{eqnarray}\unicode[STIX]{x1D6F1}=\frac{(\unicode[STIX]{x1D705}_{1}+\unicode[STIX]{x1D705}_{2})T_{s0}}{(\unicode[STIX]{x1D70C}_{1}+\unicode[STIX]{x1D70C}_{2})L^{2}}\frac{1}{t_{\unicode[STIX]{x1D6FE}g}}\end{eqnarray}$$
is calculated from the data of table 1 for the water–water vapour system as
 $\unicode[STIX]{x1D6F1}=3.2\times 10^{-12}$
. Expression (A 3) does not take into account the fact that the pressures of the liquid and its vapour in the vicinity of their perturbed interface differ in values of the normal viscous stresses and capillary forces (see (3.14)).
Substitution of boundary condition (A 3) into condition (A 1) indicates that the thermocapillary effect depends on the total vapour pressure (taking into account the hydrostatic component) with the factor
 $M\unicode[STIX]{x1D6F1}\sim 10^{-8}$
and must remain finite in the limit of strong heating at
 $\unicode[STIX]{x1D6EC}\rightarrow 0$
owing to the above-mentioned limitation on the rate of phase transition,
 $\unicode[STIX]{x1D6EF}$
. Clearly, the mechanism of thermocapillarity does not manifest itself in the inviscid approximation, when the condition of tangential stress balance (A 1) is not imposed. In the limit of weak heating, the perturbations of temperature,
 $\unicode[STIX]{x1D6E9}_{j}$
, should be considered as first-order quantities with respect to the parameter
 $\unicode[STIX]{x1D6EC}\rightarrow \infty$
. But, the terms with the amplitude of the interface deformation,
 $F$
, are smaller in order and must be dropped. Then, through boundary conditions (3.15), (3.16) and (A 3), the phase transition rate
 $\unicode[STIX]{x1D6EF}$
is determined by the vapour pressure with the factor
 $\unicode[STIX]{x1D6F1}\sim 10^{-12}$
.
The imaginary part of the correction to the eigenfrequency of perturbations due to the phase transition as a function of the parameter
 $\unicode[STIX]{x1D6EC}$
for the wavenumber
 $k=0.1$
. The graphs are plotted for the following choice of boundary condition: the Clausius–Clapeyron law (solid line) and its modifications from Badratinova et al. (Reference Badratinova, Colinet, Hennenberg and Legros1996) (dashed line) and (Delhaye, Giot & Riethmuller Reference Delhaye, Giot and Riethmuller1981, pp. 132–139) (long-dashed line).

A generalization of the Clausius–Clapeyron law to the case of a pressure jump was derived in Badratinova et al. (Reference Badratinova, Colinet, Hennenberg and Legros1996) from the requirement of equality of the chemical potentials of the media at their interface (both in the base and perturbed states) and an application of the Gibbs–Duhem equation to their small variations. Hence, at
 $z=0$
, the following relation holds true:
 $$\begin{eqnarray}\unicode[STIX]{x1D6E9}_{2}+\frac{F}{\tilde{\unicode[STIX]{x1D705}}_{2}}=\unicode[STIX]{x1D6EC}\unicode[STIX]{x1D6F1}\left(\frac{P_{2}}{\tilde{\unicode[STIX]{x1D70C}}_{2}}-\frac{P_{1}}{\tilde{\unicode[STIX]{x1D70C}}_{1}}\right).\end{eqnarray}$$
In the case of equality of the liquid and vapour pressures, when
 $P_{1}-\tilde{\unicode[STIX]{x1D70C}}_{1}F/(\tilde{\unicode[STIX]{x1D70C}}_{1}-\tilde{\unicode[STIX]{x1D70C}}_{2})=P_{2}-\tilde{\unicode[STIX]{x1D70C}}_{2}F/(\tilde{\unicode[STIX]{x1D70C}}_{1}-\tilde{\unicode[STIX]{x1D70C}}_{2})$
, boundary condition (A 5) is transformed to (A 3), which does not hold for the frequently applied (see, for example, Nikolaev Reference Nikolaev2010) variant proposed in (Delhaye et al.
Reference Delhaye, Giot and Riethmuller1981, pp. 132–139) and written here as
 $$\begin{eqnarray}\unicode[STIX]{x1D6E9}_{2}+\frac{F}{\tilde{\unicode[STIX]{x1D705}}_{2}}=\frac{\unicode[STIX]{x1D6EC}\unicode[STIX]{x1D6F1}}{\tilde{\unicode[STIX]{x1D70C}}_{1}}(P_{2}-P_{1}+F).\end{eqnarray}$$
The imaginary part of the correction to the eigenfrequency of perturbations due to the phase transition as a function of the parameter
 $\unicode[STIX]{x1D6EC}$
for the wavenumber
 $k=0.1$
. The modification of the Clausius–Clapeyron law from Badratinova et al. (Reference Badratinova, Colinet, Hennenberg and Legros1996) is applied. The graphs are plotted with account of viscosity and thermocapillarity (solid line) and without the latter (dashed line) and in the inviscid assumption (long-dashed line).

There is no need to decide which of boundary conditions (A 3), (A 5) and (A 6) is more correct. In any case, the choice between these three versions of the thermodynamic boundary condition cannot produce a qualitative change of the situation. This is evident from the curves in figure 5. The effect of media pressures on the phase transition is responsible for the appearance of the lower horizontal asymptote on the plot of the damping coefficient, the passage to which takes place at very weak heating. The position of the asymptote is determined by the presence of viscosity and thermocapillarity (see figure 6), and this allows us to interpret the result of Hsieh (Reference Hsieh2003) without considering the above factors as an idealization.



