


Introduction
The Himalayan mountain range exerts a dominant control over hydrological and meteorological conditions in the Indian peninsula. Most of the rivers on the Indo-Gangetic plains derive their runoff from seasonal snowmelt and/or glacier melt. The hydrology of these rivers is strongly influenced by the behaviour of glaciers, which act as natural regulators of water by storing it in winter as snow and releasing it in summer in the form of meltwater (Reference Vohra, Lal and ModdieVohra, 1981). In order to manage the water resources of these rivers judiciously, a proper understanding of the mass balance of the glaciers and their hydrological characteristics is important.
The mass balance of valley glaciers can be studied by various methods, including the stratigraphic or glaciological method, the geodetic method and the hydrological method (Reference Østrem and StanleyØstrem and Stanley, 1969; Reference MeierMeier, 1973). In the stratigraphic or glaciological method, the mass balance is determined directly from measurements of accumulation and ablation of mass at the glacier surface by taking point measurements (Reference Röthlisberger, Lang, Gurnell and ClarkRöthlisberger and Lang, 1987). The geodetic method is based on repeated photogrammetric or theodolite surveys of a glacier over a period of 5–10 years. The hydrological method determines the mass balance by subtracting the mass losses by evaporation and runoff from the mass gain from snowfall.
Unlike other methods, the hydrological method relies on indirect estimates of annual accumulation and ablation from snow-meteorological and discharge data. Mass-balance estimates using this method over short time periods (e.g. weekly or daily) have been extremely unreliable due, apparently, to the storage of liquid water within the glacier in its subglacial and englacial cavities, or the release of this liquid water (Reference Tangborn, Krimmel and MeierTangborn and others, 1975). It is observed that these cavities begin to open in mid-May and reach a maximum total volume by August, at which time they contain the maximum water volume. By the end of the ablation season (end of September), much of the water stored in these cavities is drained off (Reference Östling and HookeÖstling and Hooke, 1986). This variation often leads to significant errors in estimation of mass loss calculated by the hydrological method as compared to the loss for the same area measured by the glaciological method for short time periods. However, comparison of mass balance calculated by the glaciological and hydrological methods on South Cascade Glacier, Washington, U.S.A., for a longer duration of 3–7 years has generally shown that results from the hydrological method are within acceptable error limits (Reference Tangborn, Krimmel and MeierTangborn and others, 1975). Therefore, it can be assumed that changes in liquid-water storage within the glacier over short time periods, i.e. daily or weekly, are significant and cannot be ignored in estimation of mass loss, but over longer duration (annually or longer) they are insignificant and hence can be ignored.
Large expanses or the Karakoram Himalaya, and the Nubra valley in particular, are inaccessible throughout the year due to the extremely rugged and difficult nature of the terrain. Because of the dangers involved in working on them, most of the glaciers have been only partially explored. A few studies on geomorphological aspects (Reference Goudie and MillerGoudie and others, 1984) and the relationship between discharge variation and sediment transport in the Hunza Glacier basin (Reference Ferguson and MillerFerguson, 1984) have been reported in the literature, but no mass-balance data are available on any of the glaciers. Considerable manpower and logistic support is required to study the glaciers using stratigraphic and geodetic methods. These methods, however accurate, are suitable only for small glaciers, where periodic monitoring of accumulation and ablation measurements at different stakes is physically-possible. Because of their huge size, the glaciers in the Karakoram Himalaya can only be studied for longer periods by the hydrological method, although results may be less accurate than those obtained by other methods.
This paper, the first study of its kind in this part of the Himalaya, presents the results of mass-balance studies carried out on Siachen Glacier during the five hydrological years 1986–87 to 1990–91.
The Study Area
The Karakoram Himalaya is highly glacierized (about 37% glacier area) and is characterized by sleep slopes and an altitude range of 2800–7600 m. The Shyok river, with the Nubra river as a tributary, is a major river system in the area (Fig. 1). The northwest–southeast trending Siachen Glacier, the longest of the 33 glaciers in the Nubra valley, is a compound glacier about 74 km long. It is the source of the Nubra river.
Precipitation in the Karakoram Himalaya occurs under the influence of extratropical low-pressure systems called Western Disturbances (WDs) (Reference Rangachary and BandyopadhyayRangachary and Bandyopadhyay, 1987). Studies have shown that the higher altitudes of the area receive snowfall year-round, while the lower altitudes receive 95% of their total precipitation as snow and the other 5% as rain. About 40–50 WDs move over the Karakoram Himalaya every year, with an average frequency of four to five per month and a life expectancy of 2–4 days for each WD (Reference BhutiyaniBhutiyani, 1992). The lower altitudes receive about 75–150 cm a-1 of snowfall (snow depth), while higher altitudes can receive > 1000 cm a-1. The snow exhibits dry, powdery characteristics with a predominance of columns, needles and dendrites as snow-crystal types. Formation of depth-hoar crystals in the snowpack is fairly common. Minimum air temperatures ranging from –20° to –40°C have been recorded in December–February.
Location map.

A network of five manned snow-meteorological observatories (four on the glacier and one at the base station) was set up primarily for the purpose of avalanche forecasting at the locations shown in Figure 1. Snowfall amounts (in cm snow depth) were measured manually using standard snow stakes. and maximum, minimum and ambient air-temperature data were collected using standard thermometers. These data were recorded twice a day at 0830 and 1730 h (Indian Standard Time). Fresh snowfall density was measured at station A and at the base station. Assuming that station A is representative of the whole glacier basin (because of its geographical location in the central part of the basin), its fresh-snow density and air-temperature data were used to convert fresh-snow depths at other stations on the glacier into water equivalents and compute evaporation losses.
Discharge measurements were taken 200 m downstream of the glacier snout where the river has a more-or-less uniform cross-sectional area and negligible gradient for about 50 m. A vertical gauge was installed and calibrated by measuring discharge using the area–velocity method. Surface velocities at three places across the river channel were measured using light, wooden floats and their average was taken. Mean flow velocity was calculated using a conversion constant of 0.85 (Reference ØstremØstrem, 1964). Cross-sectional area was monitored twice a year and corrections were applied to the rating curve. The salt-dilution method (Reference ØstremØstrem, 1964) was also tried, but did not give the desired results because of high discharge and some practical problems.
Mass Balance By Hydrological Method: Discussion of Results
Net Accumulation
Variation of Precipitation with Altitude
Estimation of precipitation in a mountainous basin is one of the greatest problems in mountain hydrology, because significant spatial and altitudinal variations are common. Orography is important in the distribution of snowfall in the Himalaya. Studies in the Nepal Himalaya (Reference Higuchi, Yasunari and InoueHiguchi and others, 1982), in the Pirpanjal Himalaya (Reference BagchiBagchi, 1982) and in the Greater Himalaya (Reference SinghSingh, 1994) have indicated that snowfall increases with altitude on the windward side (southern slopes) up to a certain altitude and then decreases on the leeward side. Analysis of the precipitation data collected at the five stations located at different altitudes on Siachen Glacier (Fig. 2) shows that the lower elevations in the valley generally received low annual snowfall of 75–150 cm snow depth, while the higher elevations received moderate to heavy snowfall ranging up to 1000 cm snow-depth. Analysis (Fig. 2) suggests a power-law relation between precipitation and altitude in the Siachen Glacier valley, which is on the windward side of the Karakoram Himalaya. Using this relationship the precipitation at any desired location on the glacier is given by an expression:

where P b is precipitation at any desired location on the glacier, P r is precipitation measured at a known station, A b is altitude of the desired location where precipitation is to be estimated, A r is altitude of a known station where precipitation measurements are taken, and C is altitude factor with a value of 4.78.
Variation of precipitation with altitude in the Nubra valley.

A good correlation (R 2 = 0.89) is obtained during the study period (Fig. 3). The relationship does not take into consideration the local variation in deposition caused by the wind transport over different slope angles and aspects.
Accumulation
To estimate the total accumulation over the glacier surface, the entire glacier basin was divided into six altitude zones, each with an altitude interval of 500 m (Fig. 4a and b). The area within each zone was planimetered on the map, and the mean altitude calculated (Table 1). Zones 1–4 and part of zone 5 were observed to be in the ablation area, and zone 6 with part of zone 5 in the accumulation area. No precise data on year-to-year variation of equilibrium-line altitude (ELA) are available for the study period. The field visits undertaken during ablation periods in different years have indicated ELAs of 5400–5600 m during the study period. This shows that > 50% of the glacier area lies below the equilibrium line. Siachen Glacier is a rapidly retreating, debris-covered glacier which retreated by about 914 m during the period 1929–58 (Reference Vohra, Lal and ModdieVohra, 1981). The generalized accumulation area ratio (AAR) for the glaciers in this region has a value of 0.44 for zero mass balance (Reference KulkarniKulkarni, 1992).
Except for station A and one other station at an altitude of 5300 m, none of the stations was located near the mean altitudes of the corresponding zones. To make a representative assessment of precipitation estimates at mean hypsometric altitudes of different zones and to create uniformity in the calculation for each zone, base-station data were used because of the availability of a continuous year-round record for all years during the study period, and the minimal effect of wind-drift on precipitation measurements. Using the relationship given in Equation (1), total annual precipitation at different elevations during the five hydro-logical years 1986 –87 to 1990–91 were computed by taking the total annual precipitation recorded in respective years at the base station (3570 m a.s.l).
The contribution to the accumulation due to avalanches from non-glacierized areas in the basin was observed to be significant in all zones except 1 and 6. The non-glacierized parts of the basin consist mainly of steep slopes (angles > 50°) with smooth and rocky or scree-filled sliding surfaces. Most of the accumulation on these slopes is brought down to the glacier by the many dry, loose snow avalanches that occur immediately after every major snowfall event (Reference BhutiyaniBhutiyani, 1992). The precipitation in the catchment areas of the avalanche zones is calculated by applying the elevation–precipitation regression equation (Equation (1)). An average depth of snow retained on such slopes after an avalanche occurrence is taken as 0.15 m (Reference SchaererSchaerer, 1975). Assuming that all non-glacierized areas in zones 2–5 are catchment areas for avalanches, their contribution, weighted by their areas (in relation to the glacier areas of corresponding zones), is calculated after subtracting a residual of 0.15 m and this amount was added to accumulation estimates of corresponding zones. In glacierized areas, an altitude interval of 500 m was chosen so as to include the entire avalanche paths of these sites and their contribution to accumulation within the same altitude zone. Table 2 gives the details of estimated total annual precipitation at mean hypsometric altitudes of all altitude zones.
Relationship between observed and estimated values of precipitation at different altitudes.

The mean specific accumulation on the glacier surface during a particular year was computed by taking a weighted mean of total annual precipitation estimated at various altitudes by using the expression:

where, S a is mean specific accumulation in mm, P i is total annual precipitation estimated at mean altitude of ith zone in mm, A i is the area covered by ith zone, and A is the total glacier surface area (Σ A i = A).
Ablation
Meltwater Production
Meltwater produced on the glacier surface makes its way-through the body of the glacier to the stream at the snout of the glacier. Assuming that changes in the groundwater storage are insignificant over the computational periods, the measurement of discharge in a proglacial stream should give a reasonably good estimate of the total meltwater production on the glacier. The discharge of the Nubra river was measured continuously during the summers of 1987, 1988, 1989 and 1991. Figure 5 gives the temporal variation of daily runoff and air temperature during the ablation season. The data show variations in daily runoff values ranging from 2.6 × 10⁵ m3 d-1 at the start of the ablation season (first week of May) to about 2.3 × 10⁷ m3 d-1 at the peak of the ablation season (August to early September). Figure 6 gives the relation between average monthly discharge and mean monthly air temperature. The discharge during the 1990 summer was estimated from this relationship because of non-availability of data.

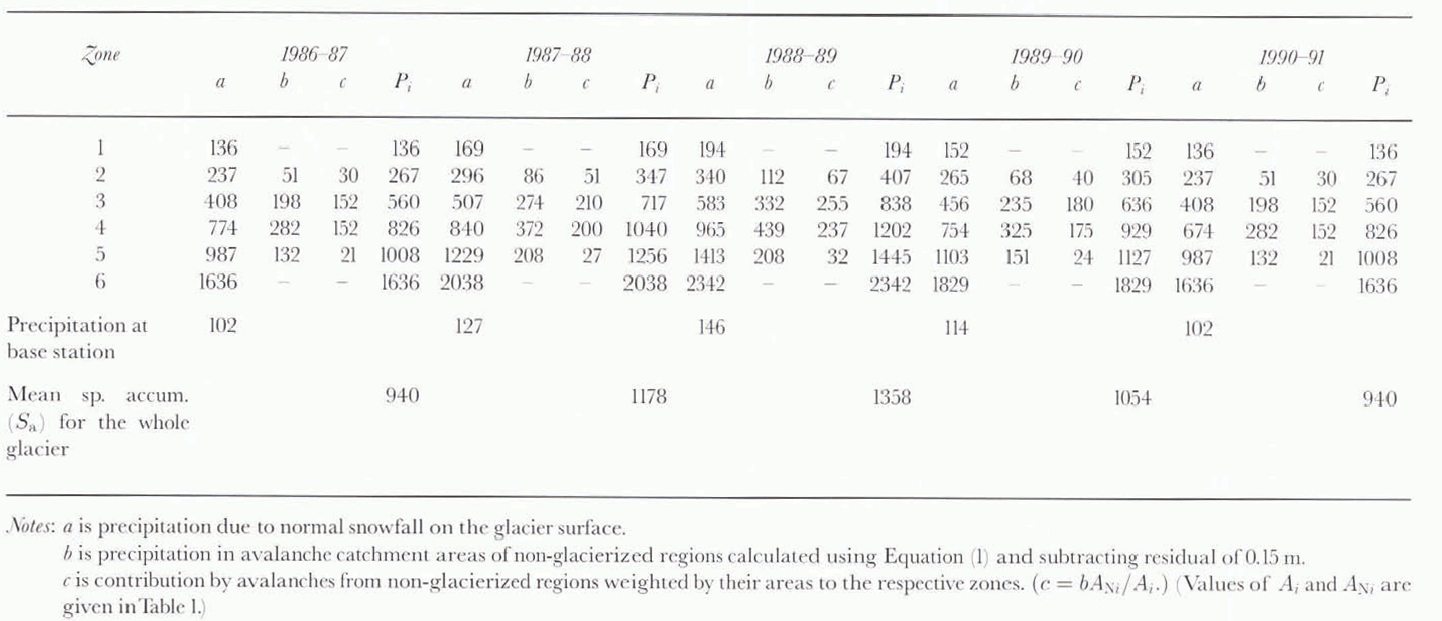
Details of altitude zones and mean hypsometric altitudes.

Variation of daily discharge and mean air temperature at station A, Nubra river valley (discharge — · —, air temperature – + –).

Evaporation Losses
The temperature data recorded at station A (4800 m a.s.l.) were used to estimate evaporation losses for the glacier. Mean annual air temperatures recorded at station A are given in Table 3. Evaporation losses on the snow surface are assumed to be negligible and hence are ignored. Due to surficial inciting, the snow and glacier surface is assumed to resemble a lake surface. Yearly evaporation losses over an exposed snow and glacier surface are estimated by an empirical expression suggested by the U.S. Geological Survey for a lake surface (Reference MutrejaMutreja, 1986).

where E s is evaporation in cm a-1 and T a is mean annual air temperature in °C.
Relationship between monthly average daily discharge and air temperature recorded at station A (4800 m a.s.l.).


Net Mass Balance
Mean specific mass-balance values of Siachen Glacier during the five hydrological years 1986–87 to 1990–91 are computed from:

where S c is mean specific mass balance. S a is mean specific accumulation, R is mean specific runoff, and E s is mean yearly evaporation loss.
S c values calculated by Equation (4) are given in Table 3.
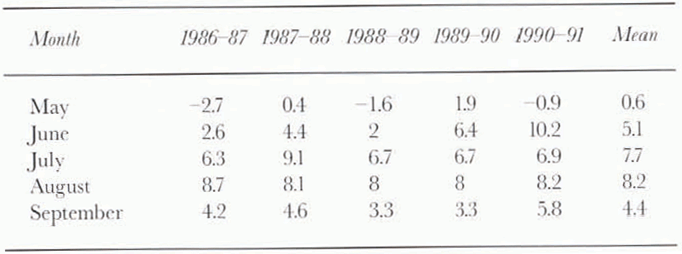
It is seen from these data that except in the year 1988–89, the mass-balance values of Siachen Glacier were negative. The year 1990–91 appears to have recorded the lowest value of mass balance (–1084 mm), which may be attributed to comparatively low accumulation and high ablation. Figure 7 shows the variation of snowfall recorded during the ablation months. It is seen from these data that during the ablation season of 1990–91, the month of May which marks the beginning of the ablation season being the exception, June and July experienced no snowfall, and August and September recorded below normal snowfall amounts. The temperature data given in Table 4 show that abnormally high temperatures (about 5°C higher than the normal values) prevailed during June, which led to extensive ablation of the exposed glacier surface.
The year 1988–89 registered a positive mass balance (+358 mm). Besides comparatively high accumulation recorded in the winter of this year, during the ablation season there were significant snowfall events, with snowfall amounts well above normal values, and air temperatures 1–3°C below normal values (Table 4). These factors were mainly responsible for substantially reduced ablation rates and positive mass balance.
Variation of snowfall (in cm snow depth) during ablation months at station A.

Error Analysis of Results
The main source of error in the glaciological method of determining mass balance is an error in measurement due to tilting and sinking of stakes in the glacier over a period of time. This may introduce a standard error of about 10% in annual mass-balance estimates (Reference Tangborn, Krimmel and MeierTangborn and others, 1975). In the hydrological method, due to errors in manual recording of snow-meteorological data, and significant spatial and altitudinal variation in precipitation in mountainous areas, errors are likely to occur in the estimation of accumulation. To obtain more reliable accumulation estimates for Siachen Glacier, in this study, instead of using precipitation data from a single index station located near the centre of the glacier (Reference Tangborn, Krimmel and MeierTangborn and others, 1975), data from five stations located at different altitudes were used and a relationship between altitude and precipitation was established. Observed and computed values of precipitation show good correlation (R 2 = 0.89). The standard error estimated in this approach is about 19%. The contribution by avalanches from non-glacierized areas surrounding the glacier has also been included to improve the accuracy of accumulation estimates. The reliability of the river discharge data cannot be ascertained, due to the non-availability of data measured by the salt-dilution method for comparison. However, the inherent standard error in the area–velocity method of discharge measurement is 10–15% (Reference MutrejaMutreja, 1986) and it is assumed those values are applicable in this study.
Evaporation measurements in the study region are few and far between. Data collected at Skardu on the banks of the Shyok river (2700 m a.s.l.) show that evaporation in valleys which are climatically arid in summer averages about 10 mm d-1 (Reference Goudie and MillerGoudie and others, 1984). No data are available from higher altitudes where glaciers are located. For calculating the mass balance of Siachen Glacier, evaporation losses were estimated indirectly by using an empirical relationship between mean air temperature and evaporation (Reference MutrejaMutreja, 1986). It is not possible to estimate standard error in these measurements, due to the lack of data collected by any other method, but an error of about 15–20% is assumed.
Considering the errors associated with accumulation, discharge and evaporation estimates, it is believed that net annual-balance estimates will also have the same standard error of about 15–20%.
Conclusions
The hydrological method, although not as accurate as the stratigraphic or geodetic method, can be used effectively to study mass balance of long glaciers like Siachen in the rugged and difficult terrain of the Karakoram Himalaya. The mass-balance computations for Siachen Glacier show that in every year except one (1988–89), negative mass-balance values have been recorded since 1986. This finding is consistent with observations that indicate that Siachen Glacier has been receding during the past 5 years, in conformity with the current trend of general retreat of all Himalayan glaciers (Reference Raina, Kaul and SinghRaina and others, 1977; Kulkarni, 1992). Higher mean air temperatures and a fairly continuous trend of negative values of mass balance indicate a period of warmer climate and excessive runoff and ablation during the study period. In the absence of any other scientific data, and particularly mass-balance data, by any method on any glacier in this region, the results of this study can be accepted with an error of about 15–20%.
Acknowledgements
The author is grateful to the Directorate of Military Intelligence, Army Headquarters, New Delhi, for granting security clearance and permission to publish the results of this study in the form of this paper. The encouragement received from Commandant, College of Military Engineering, Pune, Commander, Faculty of Civil Engineering and Head of Department of Survey, Brig. V. N. Nerikar is gratefully acknowledged. Thanks are also due to D. S. Thakur, R. C. Thakur and H. S. Thakur for their help during fieldwork.



