1 Introduction
The Earth, as well as certain other planets, moons and stars, is known to possess a self-sustaining magnetic field. Such magnetic fields are generated via fluid motion in a confined conductive interior through a process that is termed dynamo action (Moffatt Reference Moffatt1983). Mathematically, such dynamics can be modelled by a coupled system of differential equations referred to as magnetohydrodynamics (MHD). If we prescribe the flow field
 $\boldsymbol{U}$
and ignore the back-reaction from the magnetic field
 $\boldsymbol{B}$
on
 $\boldsymbol{U}$
, we obtain a simple system called the kinematic dynamo problem. In this reduced system, one can study how a flow field amplifies a seed magnetic field. Early numericists found flow fields that are capable of dynamo action in a sphere with electrically insulating boundary conditions (Backus Reference Backus1958; Gubbins Reference Gubbins1973; Pekeris, Accad & Shkoller Reference Pekeris, Accad and Shkoller1973; Kumar & Roberts Reference Kumar and Roberts1975; Dudley & James Reference Dudley and James1989). However, there is no universal recipe on how to obtain such flow fields; known dynamo solutions do not necessarily share similar spatial structures (Gubbins Reference Gubbins2008).
Optimization offers a tool to explore the many possible ways of getting dynamo action. Historically, optimization of dynamo models has taken place predominantly with a restricted type of velocity field: for example, working in a sphere, Love & Gubbins (Reference Love and Gubbins1996b ) optimized the flow proposed by Kumar & Roberts (Reference Kumar and Roberts1975, abbreviated as KR) while Holme (Reference Holme2003) optimized flows proposed by Dudley & James (Reference Dudley and James1989, abbreviated as DJ); later studies by Love & Gubbins (Reference Love and Gubbins1996a ), Holme (Reference Holme1997) and Gubbins et al. (Reference Gubbins, Barber, Gibbons and Love2000a ,Reference Gubbins, Barber, Gibbons and Love b ) yielded more efficient solutions using only poloidal flows of KR type. Allied work also includes the search for optimal dynamos driven by ABC flows in a periodic domain (Alexakis Reference Alexakis2011), maximization of helicity for the cylindrical Riga experiment (Stefani, Gerbeth & Gailitis Reference Stefani, Gerbeth and Gailitis1999), optimization of boundary driven flows for the spherical Madison plasma experiment (Khalzov et al. Reference Khalzov, Brown, Cooper, Weisberg and Forest2012), optimization of flow structures and conducting layers for the cylindrical VKS experiment (Marie et al. Reference Marie, Burguete, Daviaud and Léorat2003; Ravelet et al. Reference Ravelet, Chiffaudel, Daviaud and Léorat.2005), and, most recently, the study of optimal forcing for chaotic dynamos (Sadek, Alexakis & Fauve Reference Sadek, Alexakis and Fauve2016). From a more fundamental point of view, we want to ask: ‘Imposing no constraints other than the spherical boundaries, what is the most efficient dynamo, and what are its characteristics?’ Optimization that potentially covers an infinitely large parameter space of flow structures is needed to answer these questions.
A variational approach has successfully optimized kinematic dynamo models in a cube (Willis Reference Willis2012; Chen, Herreman & Jackson Reference Chen, Herreman and Jackson2015; Herreman Reference Herreman2016). This method sets up a Lagrangian consisting of an objective functional that usually measures the magnetic energy at later times, subject to a number of constraints, then searches for the optimal state, i.e. a stationary point of the Lagrangian in phase space with respect to the variation of each variable, including that of the velocity field and the seed magnetic field. The important control parameter in optimization is the magnetic Reynolds number
 $Rm$
. It measures the effects of advection and stretching of a magnetic field compared to the effects of Ohmic decay. In order to sustain dynamo action,
 $Rm$
must be sufficiently large such that field creation outweighs field destruction through dissipation, and indeed
 $Rm$
must exceed certain known lower bounds (Backus Reference Backus1958; Childress Reference Childress1969; Busse Reference Busse1975; Proctor Reference Proctor1977, Reference Proctor1979). Historically, different definitions of
 $Rm$
have been used, and one needs to be careful which measure to use. It has been proven that the kinetic energy-based magnetic Reynolds number (denoted by
 $Rm_{u}$
) has no lower bound (Proctor Reference Proctor2015), since a given flow field can be shrunk to a smaller region with a lower value of
 $Rm_{u}$
while dynamo action is retained through the increased shear. As a consequence, we use an enstrophy-based normalization to define
 $Rm$
in our optimization, which is equivalent to normalizing the global magnitude of shear.
In this work, we extend these previous studies to find the optimal kinematic dynamo in a sphere. As a first step, our aim is to look for optimal dynamo action among general steady and incompressible flows in a sphere with widely used electrically insulating and no-slip boundary conditions. This requires the use of an inner product defined over infinite space, which we refer to as an all-space norm, and a primitive formulation of the Lagrangian. The all-space norm removes all surface integrals during the derivation of the variations of the Lagrangian and is key to the successful application of our method. We also developed an adjoint model for this particular optimization problem, akin to those first written down by Namikawa & Matsushita (Reference Namikawa and Matsushita1970) and Li, Jackson & Livermore (Reference Li, Jackson and Livermore2011). Lastly, a specially constructed orthogonal Galerkin basis (Livermore Reference Livermore2010; Li, Livermore & Jackson Reference Li, Livermore and Jackson2010; Livermore & Ierley Reference Livermore and Ierley2010) for the vector fields ensures a rapid convergence in spectral space towards the optimal state.
The structure of this article is as follows. We introduce the methodology in § 2 and present the results in § 3, wherein we describe the optimal flow field, together with its magnetic eigenvector at the minimal critical magnetic Reynolds number for the onset of dynamo action
 $Rm_{c,min}=64.45$
. We discuss the characteristics of this optimal solution, contrasting them to theoretical bounds and other spherical dynamo models; we also compare
 $Rm_{c,min}$
directly with the optimized dynamo models in a cube (Chen et al.
Reference Chen, Herreman and Jackson2015) by rescaling typical length scales and volumes in § 3.8. We close with conclusions in § 4.
2 Methods
2.1 Definition of the optimization objective
Consider a sphere
 ${\mathcal{V}}^{\ast }$
filled with an electrically conducting fluid. Outside the sphere, we suppose a current-free region
 $\hat{{\mathcal{V}}}^{\ast }$
that extends to infinity. If
 $L^{\ast }$
denotes dimensional values for the spherical radius and
 $\unicode[STIX]{x1D702}^{\ast }$
denotes the fluid’s magnetic diffusivity, we then non-dimensionalize the flow field using units
 $[\boldsymbol{U}]=\unicode[STIX]{x1D714}^{\ast }L^{\ast }$
for velocity,
 $[\boldsymbol{x}]=L^{\ast }$
for length and
 $[t]={L^{\ast }}^{2}/\unicode[STIX]{x1D702}^{\ast }$
for time. Here
 $\unicode[STIX]{x1D714}^{\ast }$
is the dimensional root-mean enstrophy,
 $$\begin{eqnarray}\displaystyle & \displaystyle \unicode[STIX]{x1D714}^{\ast }=\sqrt{\frac{1}{V^{\ast }}\int _{{\mathcal{V}}^{\ast }}(\unicode[STIX]{x1D735}\times \boldsymbol{U}^{\ast })^{2}\,\text{d}V^{\ast }}. & \displaystyle\end{eqnarray}$$
Here
 $V^{\ast }$
is the dimensional volume of the sphere, and
 $\boldsymbol{U}^{\ast }$
is the dimensional velocity field; we set
 $\unicode[STIX]{x1D702}^{\ast }=1/(\unicode[STIX]{x1D707}_{0}^{\ast }\unicode[STIX]{x1D70E}^{\ast })$
, where
 $\unicode[STIX]{x1D707}_{0}^{\ast }$
is the permeability of free space and
 $\unicode[STIX]{x1D70E}^{\ast }$
is the electrical conductivity. The magnetic Reynolds number is then defined as
 $$\begin{eqnarray}\displaystyle & \displaystyle Rm=\frac{\unicode[STIX]{x1D714}^{\ast }{L^{\ast }}^{2}}{\unicode[STIX]{x1D702}^{\ast }}. & \displaystyle\end{eqnarray}$$
Note here that it is necessary to use the enstrophy measure of flow strength for reasons explained in the Introduction. In this model, we impose no-slip boundary conditions on the flow field
 $\boldsymbol{U}^{\ast }$
. This then leads to the condition that the root-mean enstrophy
 $\unicode[STIX]{x1D714}^{\ast }=S^{\ast }$
, where
 $S^{\ast }=\sqrt{(1/V^{\ast })\int _{{\mathcal{V}}^{\ast }}2\unicode[STIX]{x1D626}_{ij}^{\ast }\unicode[STIX]{x1D626}_{ij}^{\ast }\,\text{d}V^{\ast }}$
is the dimensional global shear magnitude, and
 $\unicode[STIX]{x1D626}_{ij}^{\ast }$
is the dimensional strain-rate tensor.
The non-dimensionalized flow field
 $\boldsymbol{U}=\boldsymbol{U}(\boldsymbol{x})$
lives within the parameter space
 ${\mathcal{E}}_{u}$
of all steady and incompressible fields with no-slip boundary conditions, i.e. for all
 $\boldsymbol{U}\in {\mathcal{E}}_{u}$
,
 $$\begin{eqnarray}\displaystyle & \displaystyle \unicode[STIX]{x1D735}\boldsymbol{\cdot }\boldsymbol{U}=0,\quad \boldsymbol{x}\in {\mathcal{V}}, & \displaystyle\end{eqnarray}$$
 $$\begin{eqnarray}\displaystyle & \displaystyle \boldsymbol{U}|_{\unicode[STIX]{x1D6F4}_{-}}=\mathbf{0}, & \displaystyle\end{eqnarray}$$
where we denote by
 $\unicode[STIX]{x1D6F4}_{\pm }$
either the outer surface (
 $+$
) or the inner surface (
 $-$
) of the sphere at the interface between non-dimensionalized domains
 ${\mathcal{V}}$
and
 $\hat{{\mathcal{V}}}$
. In a kinematic approach, the magnetic field
 $\boldsymbol{B}$
and the electric field
 $\boldsymbol{E}$
need to satisfy the non-dimensional equations,
 $$\begin{eqnarray}\displaystyle & \displaystyle \boldsymbol{E}=\unicode[STIX]{x1D735}\times \boldsymbol{B}-Rm\,\boldsymbol{U}\times \boldsymbol{B},\quad \boldsymbol{x}\in {\mathcal{V}}, & \displaystyle\end{eqnarray}$$
 $$\begin{eqnarray}\displaystyle & \displaystyle \unicode[STIX]{x2202}_{t}\boldsymbol{B}=-\unicode[STIX]{x1D735}\times \boldsymbol{E},\quad \boldsymbol{x}\in {\mathcal{V}}\cup \hat{{\mathcal{V}}}, & \displaystyle\end{eqnarray}$$
 $$\begin{eqnarray}\displaystyle & \displaystyle \unicode[STIX]{x1D735}\times \boldsymbol{B}=\mathbf{0},\quad \boldsymbol{x}\in \hat{{\mathcal{V}}}, & \displaystyle\end{eqnarray}$$
 $$\begin{eqnarray}\displaystyle & \displaystyle \unicode[STIX]{x1D735}\boldsymbol{\cdot }\boldsymbol{B}=0,\quad \boldsymbol{x}\in {\mathcal{V}}\cup \hat{{\mathcal{V}}}. & \displaystyle\end{eqnarray}$$
We have used an arbitrary scale
 $[\boldsymbol{B}]$
to non-dimensionalize the magnetic field, and
 $[\boldsymbol{E}]=\unicode[STIX]{x1D714}^{\ast }L^{\ast }[\boldsymbol{B}]$
to non-dimensionalize the electric field. Unlike in Willis (Reference Willis2012) and Chen et al. (Reference Chen, Herreman and Jackson2015), we introduce Ampère’s law (2.5) and Faraday’s law (2.6) separately as a primitive formalism rather than collectively as the induction (2.24), for reasons that we will discuss later in § 2.3. This step is needed to impose a truly current-free exterior region
 $\hat{{\mathcal{V}}}$
in the Lagrangian formalism discussed in § 2.2. Equation (2.7) is the current-free condition, (2.8) is Gauss’ law for magnetism, and we also impose the continuity conditions,
 $$\begin{eqnarray}\displaystyle & \displaystyle \boldsymbol{B}|_{\unicode[STIX]{x1D6F4}_{+}}-\boldsymbol{B}|_{\unicode[STIX]{x1D6F4}_{-}}=\mathbf{0},\quad \hat{\boldsymbol{r}}\times (\boldsymbol{E}|_{\unicode[STIX]{x1D6F4}_{+}}-\boldsymbol{E}|_{\unicode[STIX]{x1D6F4}_{-}})=\mathbf{0}, & \displaystyle\end{eqnarray}$$
where
 $\hat{\boldsymbol{r}}$
is the radial unit vector. Since the flow is steady, the kinematic dynamo problem admits exponential solutions for the magnetic field,
 $$\begin{eqnarray}\displaystyle & \displaystyle \boldsymbol{B}(\boldsymbol{x},t)\sim \boldsymbol{b}(\boldsymbol{x})\,\text{e}^{(\unicode[STIX]{x1D6FE}+\text{i}\unicode[STIX]{x1D6FA})t}, & \displaystyle\end{eqnarray}$$
where
 $\boldsymbol{b}(\boldsymbol{x})$
is an eigenvector,
 $\unicode[STIX]{x1D6FE}$
is the growth rate and
 $\unicode[STIX]{x1D6FA}$
is an oscillation frequency. As
 $t\rightarrow \infty$
, one can expect that the eigenvector with the largest growth rate will eventually dominate the solution, assuming an arbitrary noisy initial magnetic field
 $\boldsymbol{B}_{0}=\boldsymbol{B}(\boldsymbol{x},0)$
. In this optimization study, we want to identify the flow field
 $\boldsymbol{U}\in {\mathcal{E}}_{u}$
that maximizes the growth rate
 $\unicode[STIX]{x1D6FE}$
for a given value of
 $Rm$
, and subsequently find the lower bound on the critical magnetic Reynolds number, denoted by
 $Rm_{c,min}$
, below which no kinematic dynamo is possible for all
 $\boldsymbol{U}\in {\mathcal{E}}_{u}$
.
2.2 Euler–Lagrange formalism in primitive format
Since we want to optimize the growth rate
 $\unicode[STIX]{x1D6FE}$
, it seems most obvious to propose an optimization method that directly maximizes
 $\unicode[STIX]{x1D6FE}$
. This can indeed be done in low-dimensional optimization problems; see for example Holme (Reference Holme2003). However, considering the infinitely large dimension of the functional space
 ${\mathcal{E}}_{u}$
we have, optimizing the growth rate directly is not practicable. Instead, we adapt the optimization strategy of Willis (Reference Willis2012), Chen et al. (Reference Chen, Herreman and Jackson2015) and Herreman (Reference Herreman2016) that proved successful in a cube. These methods are designed to find the optimal flow field
 $\boldsymbol{U}$
and seed magnetic field
 $\boldsymbol{B}_{0}$
that maximize a specified global measure of
 $\boldsymbol{B}_{T}$
, where
 $\boldsymbol{B}_{T}=\boldsymbol{B}(\boldsymbol{x},T)$
is the magnetic field at some finite time
 $T$
that needs to be long enough to overcome initial transient growth phases. Optimizing
 $\boldsymbol{B}_{0}$
then allows us to reach this exponential regime faster. It is worth remarking that, in general, the initial field
 $\boldsymbol{B}_{0}$
that has greatest projection onto the most rapidly growing eigenvector
 $\boldsymbol{B}_{T}$
is the corresponding eigenvector of the related adjoint eigenvalue problem (Farrell & Ioannou Reference Farrell and Ioannou1996) (distinct from the adjoint formalism we will use). However, we opt to discover the structure of
 $\boldsymbol{B}_{0}$
directly by an optimizing scheme as we will set out below, rather than introducing the additional complexity of solving the adjoint eigenvalue problem.
The variational method we use is built on the following Lagrangian:
 $$\begin{eqnarray}\displaystyle {\mathcal{L}} & = & \displaystyle \ln \langle (\boldsymbol{B}_{T})^{2}\rangle -\,\unicode[STIX]{x1D706}_{1}\left(\frac{1}{V}\langle (\unicode[STIX]{x1D735}\times \boldsymbol{U})^{2}\rangle -1\right)-\unicode[STIX]{x1D706}_{2}\left(\langle (\boldsymbol{B}_{0})^{2}\rangle -1\right)\nonumber\\ \displaystyle & & \displaystyle -\,\langle \unicode[STIX]{x1D6F1}\unicode[STIX]{x1D735}\boldsymbol{\cdot }\boldsymbol{U}\rangle -\int _{0}^{T}\langle \unicode[STIX]{x1D713}^{\dagger }\unicode[STIX]{x1D735}\boldsymbol{\cdot }\boldsymbol{B}\rangle \,\text{d}t-\int _{0}^{T}\langle \boldsymbol{B}^{\dagger }\boldsymbol{\cdot }[\unicode[STIX]{x2202}_{t}\boldsymbol{B}+\unicode[STIX]{x1D735}\times \boldsymbol{E}]\rangle \,\text{d}t\nonumber\\ \displaystyle & & \displaystyle -\int _{0}^{T}\langle \boldsymbol{E}^{\dagger }\boldsymbol{\cdot }[\unicode[STIX]{x1D70E}_{r}\boldsymbol{E}+Rm\,\boldsymbol{U}\times \boldsymbol{B}-\unicode[STIX]{x1D735}\times \boldsymbol{B}]\rangle \,\text{d}t.\end{eqnarray}$$
We denote the volume of domain
 ${\mathcal{V}}$
by
 $V$
, the all-space integral
 $$\begin{eqnarray}\displaystyle & \displaystyle \langle \cdots \!\rangle =\int _{0}^{\infty }\!\int _{0}^{2\unicode[STIX]{x03C0}}\!\int _{0}^{\unicode[STIX]{x1D70B}}\cdots \,r^{2}\sin \unicode[STIX]{x1D703}\,\text{d}\unicode[STIX]{x1D703}\,\text{d}\unicode[STIX]{x1D719}\,\text{d}r, & \displaystyle\end{eqnarray}$$
and we suppose that all functions and fields are regular at
 $r=0$
and decay sufficiently quickly as
 $r\rightarrow \infty$
for this measure to make sense. The first term in (2.11) is the objective functional that we want to maximize, namely the logarithm of the energy of the magnetic field at time
 $T$
. From the second to the last term in (2.11), we impose a series of constraints in this model, namely the normalization constraint for
 $\boldsymbol{U}$
and
 $\boldsymbol{B}_{0}$
, the solenoidal conditions on
 $\boldsymbol{U}$
and
 $\boldsymbol{B}$
, Faraday’s law and Ampère’s law. Note that the flow field
 $\boldsymbol{U}$
is entirely confined to the sphere
 ${\mathcal{V}}$
, so there is no contribution to the enstrophy from
 $\hat{{\mathcal{V}}}$
. The variables
 $\unicode[STIX]{x1D706}_{1}$
,
 $\unicode[STIX]{x1D706}_{2}$
,
 $\unicode[STIX]{x1D6F1}(\boldsymbol{x})$
,
 $\unicode[STIX]{x1D713}^{\dagger }(\boldsymbol{x},t)$
,
 $\boldsymbol{B}^{\dagger }(\boldsymbol{x},t)$
and
 $\boldsymbol{E}^{\dagger }(\boldsymbol{x},t)$
are Lagrange multipliers;
 $\unicode[STIX]{x1D6F1}$
,
 $\unicode[STIX]{x1D713}^{\dagger }$
,
 $\boldsymbol{B}^{\dagger }$
,
 $\boldsymbol{E}^{\dagger }$
are often referred to subsequently as adjoint fields. The number
 $\unicode[STIX]{x1D70E}_{r}$
is a relative electrical conductivity:
 $$\begin{eqnarray}\displaystyle \unicode[STIX]{x1D70E}_{r}=\left\{\begin{array}{@{}cc@{}}1, & \boldsymbol{x}\in {\mathcal{V}},\\ 0, & \boldsymbol{x}\in \hat{{\mathcal{V}}}.\end{array}\right. & & \displaystyle\end{eqnarray}$$
At the optimum, the Lagrangian
 ${\mathcal{L}}(\boldsymbol{U},\boldsymbol{B},\boldsymbol{B}_{0},\boldsymbol{B}_{T},\boldsymbol{E},\unicode[STIX]{x1D706}_{1},\unicode[STIX]{x1D706}_{2},\unicode[STIX]{x1D6F1},\unicode[STIX]{x1D713}^{\dagger },\boldsymbol{B}^{\dagger },\boldsymbol{E}^{\dagger })$
must be stationary, meaning that
 $\unicode[STIX]{x1D6FF}{\mathcal{L}}=0$
for arbitrary variations in each of its variables. Each variational derivative needs to disappear separately, which defines 11 Euler–Lagrange (EL) equations in our optimization problem. The physical constraints define six equations: the solenoidal conditions as in (2.3) and (2.8), the normalization constraints on
 $\boldsymbol{B}_{0}$
and
 $\boldsymbol{U}$
, Ampère’s law and Faraday’s law. The remaining five non-trivial variational derivatives are
 $$\begin{eqnarray}\displaystyle & \displaystyle \frac{\unicode[STIX]{x1D6FF}{\mathcal{L}}}{\unicode[STIX]{x1D6FF}\boldsymbol{B}_{T}}=\frac{2\boldsymbol{B}_{T}}{\langle (\boldsymbol{B}_{T})^{2}\rangle }-\boldsymbol{B}_{T}^{\dagger }, & \displaystyle\end{eqnarray}$$
 $$\begin{eqnarray}\displaystyle & \displaystyle \frac{\unicode[STIX]{x1D6FF}{\mathcal{L}}}{\unicode[STIX]{x1D6FF}\boldsymbol{E}}=-\unicode[STIX]{x1D70E}_{r}\boldsymbol{E}^{\dagger }-\unicode[STIX]{x1D735}\times \boldsymbol{B}^{\dagger }, & \displaystyle\end{eqnarray}$$
 $$\begin{eqnarray}\displaystyle & \displaystyle \frac{\unicode[STIX]{x1D6FF}{\mathcal{L}}}{\unicode[STIX]{x1D6FF}\boldsymbol{B}}=\unicode[STIX]{x2202}_{t}\boldsymbol{B}^{\dagger }+Rm\,\boldsymbol{U}\times \boldsymbol{E}^{\dagger }+\unicode[STIX]{x1D735}\times \boldsymbol{E}^{\dagger }+\unicode[STIX]{x1D735}\unicode[STIX]{x1D713}^{\dagger }, & \displaystyle\end{eqnarray}$$
 $$\begin{eqnarray}\displaystyle & \displaystyle \frac{\unicode[STIX]{x1D6FF}{\mathcal{L}}}{\unicode[STIX]{x1D6FF}\boldsymbol{U}}=Rm\int _{0}^{T}\boldsymbol{B}\times (-\unicode[STIX]{x1D70E}_{r}\boldsymbol{E}^{\dagger })\,\text{d}t-2\unicode[STIX]{x1D706}_{1}\unicode[STIX]{x1D735}\times \unicode[STIX]{x1D735}\times \boldsymbol{U}+\unicode[STIX]{x1D735}\unicode[STIX]{x1D6F1}, & \displaystyle\end{eqnarray}$$
 $$\begin{eqnarray}\displaystyle & \displaystyle \frac{\unicode[STIX]{x1D6FF}{\mathcal{L}}}{\unicode[STIX]{x1D6FF}\boldsymbol{B}_{0}}=\boldsymbol{B}_{0}^{\dagger }-2\unicode[STIX]{x1D706}_{2}\boldsymbol{B}_{0}, & \displaystyle\end{eqnarray}$$
where
 $\boldsymbol{B}_{T}^{\dagger }=\boldsymbol{B}^{\dagger }(\boldsymbol{x},T)$
and
 $\boldsymbol{B}_{0}^{\dagger }=\boldsymbol{B}^{\dagger }(\boldsymbol{x},0)$
. A number of boundary terms arise during the derivation of these non-trivial variational derivatives by partial integration, and their sum needs to cancel at the optimum in order to have a consistent theory. In this model, the magnetic field
 $\boldsymbol{B}$
decays at least as fast as
 $r^{-3}$
in the insulating region
 $\hat{{\mathcal{V}}}$
, where
 $r$
is the distance to the origin, so all boundary variations on the surface of
 $\hat{{\mathcal{V}}}$
as
 $r\rightarrow \infty$
are negligible. We then need all boundary terms to cancel on
 $\unicode[STIX]{x1D6F4}_{\pm }$
:
 $$\begin{eqnarray}\displaystyle 0 & = & \displaystyle -\oint \unicode[STIX]{x1D6F1}(\hat{\boldsymbol{r}}\boldsymbol{\cdot }\unicode[STIX]{x1D6FF}\boldsymbol{U})|_{\unicode[STIX]{x1D6F4}_{-}}\,\text{d}S-\oint 2\unicode[STIX]{x1D706}_{1}[\unicode[STIX]{x1D6FF}\boldsymbol{U}\times (\unicode[STIX]{x1D735}\times \boldsymbol{U})]\boldsymbol{\cdot }\hat{\boldsymbol{r}}|_{\unicode[STIX]{x1D6F4}_{-}}\,\text{d}S\nonumber\\ \displaystyle & & \displaystyle +\int _{0}^{T}\!\oint [(\hat{\boldsymbol{r}}\times \boldsymbol{B}^{\dagger })\boldsymbol{\cdot }\unicode[STIX]{x1D6FF}\boldsymbol{E}|_{\unicode[STIX]{x1D6F4}_{-}}-(\hat{\boldsymbol{r}}\times \boldsymbol{B}^{\dagger })\boldsymbol{\cdot }\unicode[STIX]{x1D6FF}\boldsymbol{E}|_{\unicode[STIX]{x1D6F4}_{+}}]\,\text{d}S\,\text{d}t\nonumber\\ \displaystyle & & \displaystyle +\int _{0}^{T}\!\oint [(\hat{\boldsymbol{r}}\times \boldsymbol{E}^{\dagger })\boldsymbol{\cdot }\unicode[STIX]{x1D6FF}\boldsymbol{B}|_{\unicode[STIX]{x1D6F4}_{-}}-(\hat{\boldsymbol{r}}\times \boldsymbol{E}^{\dagger })\boldsymbol{\cdot }\unicode[STIX]{x1D6FF}\boldsymbol{B}|_{\unicode[STIX]{x1D6F4}_{+}}]\,\text{d}S\,\text{d}t\nonumber\\ \displaystyle & & \displaystyle -\int _{0}^{T}\!\oint [\unicode[STIX]{x1D713}^{\dagger }(\hat{\boldsymbol{r}}\boldsymbol{\cdot }\unicode[STIX]{x1D6FF}\boldsymbol{B})|_{\unicode[STIX]{x1D6F4}_{-}}-\unicode[STIX]{x1D713}^{\dagger }(\hat{\boldsymbol{r}}\boldsymbol{\cdot }\unicode[STIX]{x1D6FF}\boldsymbol{B})|_{\unicode[STIX]{x1D6F4}_{+}}]\,\text{d}S\,\text{d}t.\end{eqnarray}$$
If we suppose that the field variations
 $\unicode[STIX]{x1D6FF}\boldsymbol{U}$
satisfy no-slip conditions (2.4), the first two boundary terms are zero. Then, the inclusion of the external region
 $\hat{{\mathcal{V}}}$
allows us to cancel the remaining boundary terms by matching them from
 $\unicode[STIX]{x1D6F4}_{-}$
to
 $\unicode[STIX]{x1D6F4}_{+}$
. The primitive formalism also allows us to simplify the treatment of boundary terms on
 $\unicode[STIX]{x1D6F4}_{\pm }$
: using continuity of the magnetic field variations
 $\unicode[STIX]{x1D6FF}\boldsymbol{B}$
and the tangential electric field variations
 $\unicode[STIX]{x1D6FF}\boldsymbol{E}$
as in (2.9), we immediately obtain the boundary conditions for the adjoint fields:
 $$\begin{eqnarray}\displaystyle & \displaystyle \unicode[STIX]{x1D713}^{\dagger }|_{\unicode[STIX]{x1D6F4}_{+}}-\unicode[STIX]{x1D713}^{\dagger }|_{\unicode[STIX]{x1D6F4}_{-}}=0,\quad \hat{\boldsymbol{r}}\times (\boldsymbol{B}^{\dagger }|_{\unicode[STIX]{x1D6F4}_{+}}-\boldsymbol{B}^{\dagger }|_{\unicode[STIX]{x1D6F4}_{-}})=0,\quad \hat{\boldsymbol{r}}\times (\boldsymbol{E}^{\dagger }|_{\unicode[STIX]{x1D6F4}_{+}}-\boldsymbol{E}^{\dagger }|_{\unicode[STIX]{x1D6F4}_{-}})=0. & \displaystyle \nonumber\\ \displaystyle & & \displaystyle\end{eqnarray}$$
Because of (2.15) and the presence of
 $\unicode[STIX]{x1D735}\unicode[STIX]{x1D713}^{\dagger }$
in (2.16), the adjoint magnetic field has a gauge degree of freedom
 $\boldsymbol{B}^{\dagger }\rightarrow \boldsymbol{B}^{\dagger }+\unicode[STIX]{x1D735}\unicode[STIX]{x1D719}$
. Therefore, we can add a supplementary requirement that the adjoint magnetic field is also solenoidal,
 $$\begin{eqnarray}\displaystyle & \displaystyle \unicode[STIX]{x1D735}\boldsymbol{\cdot }\boldsymbol{B}^{\dagger }=0,\quad \boldsymbol{x}\in {\mathcal{V}}\cup \hat{{\mathcal{V}}}, & \displaystyle\end{eqnarray}$$
along with the boundary condition,
 $$\begin{eqnarray}\displaystyle & \displaystyle \hat{\boldsymbol{r}}\boldsymbol{\cdot }(\boldsymbol{B}^{\dagger }|_{\unicode[STIX]{x1D6F4}_{+}}-\boldsymbol{B}^{\dagger }|_{\unicode[STIX]{x1D6F4}_{-}})=0. & \displaystyle\end{eqnarray}$$
By requiring the sum of all boundary terms to vanish, we have just derived the continuity conditions for
 $\unicode[STIX]{x1D713}^{\dagger },\boldsymbol{B}^{\dagger }$
and
 $\boldsymbol{E}^{\dagger }$
. This brings us to the conclusion that, with a gauge degree of freedom, adjoint fields
 $\boldsymbol{B}^{\dagger }$
and
 $\boldsymbol{E}^{\dagger }$
satisfy exactly the same boundary conditions as the direct fields
 $\boldsymbol{B}$
and
 $\boldsymbol{E}$
. This is an eminently desirable property, since it allows us to use the same solenoidal Galerkin expansions for both direct field
 $\boldsymbol{B}$
and adjoint field
 $\boldsymbol{B}^{\dagger }$
later in § 2.4.
2.3 Reduced set of Euler–Lagrange equations
Now we have dealt with the boundary terms, we can eliminate the fields
 $\boldsymbol{E}$
and
 $\boldsymbol{E}^{\dagger }$
from the previous ‘primitive’ set of EL equations and present the reduced set of EL equations that we will actually solve. We build an optimization loop that will locate the stationary point of the Lagrangian (2.11) iteratively. Upon initialization (possibly combined with an update) and at each iteration in the optimization loop, the flow field
 $\boldsymbol{U}$
and the seed magnetic field
 $\boldsymbol{B}_{0}$
satisfy the normalization constraints,
 $$\begin{eqnarray}\displaystyle & \displaystyle \frac{1}{V}\langle (\unicode[STIX]{x1D735}\times \boldsymbol{U})^{2}\rangle =1,\quad \langle (\boldsymbol{B}_{0})^{2}\rangle =1, & \displaystyle\end{eqnarray}$$
the solenoidal conditions (2.3) and (2.8), and the boundary conditions (2.4) and (2.9).
In the optimization loop itself, there are three parts: a forward integration, a backward integration and an update, similar to the procedure described by Kerswell, Pringle & Willis (Reference Kerswell, Pringle and Willis2014). First we solve the forward/direct problem. In region
 $\hat{{\mathcal{V}}}$
, the magnetic field satisfies (2.7). In region
 ${\mathcal{V}}$
, by combining Ampère’s law and Faraday’s law, we solve the induction equation forward in time for
 $t:0\rightarrow T$
,
 $$\begin{eqnarray}\displaystyle & \displaystyle \unicode[STIX]{x2202}_{t}\boldsymbol{B}=Rm\,\unicode[STIX]{x1D735}\times (\boldsymbol{U}\times \boldsymbol{B})-\unicode[STIX]{x1D735}\times (\unicode[STIX]{x1D735}\times \boldsymbol{B}),\quad \boldsymbol{x}\in {\mathcal{V}}, & \displaystyle\end{eqnarray}$$
subject to the solenoidal condition (2.8) and continuity conditions (2.9). With the field
 $\boldsymbol{B}_{T}$
known, we then initialize the adjoint magnetic field at time
 $t=T$
as
 $$\begin{eqnarray}\displaystyle & \displaystyle \boldsymbol{B}_{T}^{\dagger }=\frac{2\boldsymbol{B}_{T}}{\langle (\boldsymbol{B}_{T})^{2}\rangle }. & \displaystyle\end{eqnarray}$$
Elimination of
 $\boldsymbol{E}^{\dagger }$
in the adjoint Ampère’s and Faraday’s laws derived from (2.15) and (2.16) yields the adjoint problem:
 $$\begin{eqnarray}\displaystyle & \displaystyle \unicode[STIX]{x2202}_{t}\boldsymbol{B}^{\dagger }=Rm\,\boldsymbol{U}\times (\unicode[STIX]{x1D735}\times \boldsymbol{B}^{\dagger })+\unicode[STIX]{x1D735}\times \unicode[STIX]{x1D735}\times \boldsymbol{B}^{\dagger }-\unicode[STIX]{x1D735}\unicode[STIX]{x1D713}^{\dagger },\quad \boldsymbol{x}\in {\mathcal{V}}, & \displaystyle\end{eqnarray}$$
 $$\begin{eqnarray}\displaystyle & \displaystyle \unicode[STIX]{x1D735}\times \boldsymbol{B}^{\dagger }=\mathbf{0},\quad \boldsymbol{x}\in \hat{{\mathcal{V}}}. & \displaystyle\end{eqnarray}$$
In the second part, we solve (2.26) backward in time for
 $t:T\rightarrow 0$
while respecting the solenoidal condition (2.21) and the boundary conditions (2.20) and (2.22). In the third part, we consider the update using variational derivatives (2.17) and (2.18), which lead to the only two EL equations that are not automatically satisfied. We iterate through the optimization loop so that
 $\unicode[STIX]{x1D6FF}{\mathcal{L}}/\unicode[STIX]{x1D6FF}\boldsymbol{U}\rightarrow 0$
and
 $\unicode[STIX]{x1D6FF}{\mathcal{L}}/\unicode[STIX]{x1D6FF}\boldsymbol{B}_{0}\rightarrow 0$
. To calculate the integral term in
 $\unicode[STIX]{x1D6FF}{\mathcal{L}}/\unicode[STIX]{x1D6FF}\boldsymbol{U}$
, we must know
 $\boldsymbol{B}$
and
 $\boldsymbol{B}^{\dagger }$
at all times. Lagrange multipliers
 $\unicode[STIX]{x1D706}_{1}$
,
 $\unicode[STIX]{x1D706}_{2}$
and
 $\unicode[STIX]{x1D6F1}$
are still undetermined at this stage. As in Pringle, Willis & Kerswell (Reference Pringle, Willis and Kerswell2012) and Chen et al. (Reference Chen, Herreman and Jackson2015), we use a preconditioned ascent method in which we use only part of the second variation,
 $$\begin{eqnarray}\displaystyle & \displaystyle \unicode[STIX]{x1D6FF}^{2}{\mathcal{L}}\approx 2\unicode[STIX]{x1D706}_{1}\langle \unicode[STIX]{x1D6FF}\boldsymbol{U}\boldsymbol{\cdot }\unicode[STIX]{x1D6FB}^{2}\unicode[STIX]{x1D6FF}\boldsymbol{U}\rangle -2\unicode[STIX]{x1D706}_{2}\langle \unicode[STIX]{x1D6FF}\boldsymbol{B}_{0}\boldsymbol{\cdot }\unicode[STIX]{x1D6FF}\boldsymbol{B}_{0}\rangle +\cdots \,, & \displaystyle\end{eqnarray}$$
with respect to variables
 $\boldsymbol{U}$
and
 $\boldsymbol{B}_{0}$
to allow faster convergence. To be more specific, let us denote the update as
 $$\begin{eqnarray}\displaystyle \left.\begin{array}{@{}c@{}}\boldsymbol{U}:=\boldsymbol{U}+\unicode[STIX]{x1D6FC}_{1}\,\unicode[STIX]{x0394}\boldsymbol{U},\\[3.0pt] \boldsymbol{B}_{0}:=\boldsymbol{B}_{0}+\unicode[STIX]{x1D6FC}_{2}\,\unicode[STIX]{x0394}\boldsymbol{B}_{0},\end{array}\right\} & & \displaystyle\end{eqnarray}$$
with
 $\unicode[STIX]{x1D6FC}_{1},\unicode[STIX]{x1D6FC}_{2}\ll 1$
being the two relaxation parameters. We calculate the increments
 $\unicode[STIX]{x0394}\boldsymbol{U}$
and
 $\unicode[STIX]{x0394}\boldsymbol{B}$
as if (2.28) were exact such that
 $\unicode[STIX]{x1D6FC}_{1}=\unicode[STIX]{x1D6FC}_{2}=1$
would correspond to a Newton step,
 $$\begin{eqnarray}\displaystyle & \displaystyle \frac{\unicode[STIX]{x1D6FF}{\mathcal{L}}}{\unicode[STIX]{x1D6FF}\boldsymbol{U}}+2\unicode[STIX]{x1D706}_{1}\unicode[STIX]{x1D6FB}^{2}\unicode[STIX]{x0394}\boldsymbol{U}=0,\quad \frac{\unicode[STIX]{x1D6FF}{\mathcal{L}}}{\unicode[STIX]{x1D6FF}\boldsymbol{ B}_{0}}-2\unicode[STIX]{x1D706}_{2}\unicode[STIX]{x0394}\boldsymbol{B}_{0}=0. & \displaystyle\end{eqnarray}$$
The magnetic field update is always rather trivial, since we can explicitly evaluate
 $\unicode[STIX]{x0394}\boldsymbol{B}_{0}$
, to arrive at
 $$\begin{eqnarray}\displaystyle & \displaystyle \boldsymbol{B}_{0}:=\boldsymbol{B}_{0}+\frac{\unicode[STIX]{x1D6FC}_{2}}{2\unicode[STIX]{x1D706}_{2}}\,\frac{\unicode[STIX]{x1D6FF}{\mathcal{L}}}{\unicode[STIX]{x1D6FF}\boldsymbol{B}_{0}}. & \displaystyle\end{eqnarray}$$
The value of
 $\unicode[STIX]{x1D706}_{2}$
is finally set by requiring that the updated
 $\boldsymbol{B}_{0}$
remains normalized as in (2.23). The supplementary requirement (2.21) is necessary for the updated
 $\boldsymbol{B}_{0}$
to remain within the same parameter space as
 $\boldsymbol{B}$
with the correct boundary conditions. The velocity field update is much less trivial. Owing to the presence of the Laplacian operator
 $\unicode[STIX]{x1D6FB}^{2}$
in front of
 $\unicode[STIX]{x0394}\boldsymbol{U}$
, we cannot write at this point an explicit update formula for the flow. There is also a second difficulty: owing to formula (2.17) for
 $\unicode[STIX]{x1D6FF}{\mathcal{L}}/\unicode[STIX]{x1D6FF}\boldsymbol{U}$
, there is no guarantee that the updated velocity field will automatically satisfy the no-slip boundary conditions. We tackle both issues by projecting
 $\boldsymbol{U}$
on a very particular vector field basis. The explicit equation for the velocity field update is given in § 2.5.
2.4 Galerkin expansions for
 $\boldsymbol{U}$
,
$\boldsymbol{B}$
and
$\boldsymbol{B}^{\dagger }$


We solve this optimization problem using a Galerkin method. This method builds the solenoidal condition and boundary conditions into the field expansions of
 $\boldsymbol{U}$
,
 $\boldsymbol{B}$
and
 $\boldsymbol{B}^{\dagger }$
. We denote
 $$\begin{eqnarray}\displaystyle \left[\begin{array}{@{}c@{}}\boldsymbol{U}\\[2.0pt] \boldsymbol{ B}\\[2.0pt] \boldsymbol{B}^{\dagger }\end{array}\right]=\mathop{\sum }_{l=1}^{l_{max}}\mathop{\sum }_{m=-l}^{l}\mathop{\sum }_{n=1}^{n_{max}}\left[\begin{array}{@{}c@{}}\unicode[STIX]{x1D635}_{nml}\boldsymbol{U}_{nml}^{t}+\unicode[STIX]{x1D634}_{nml}\boldsymbol{U}_{nml}^{p}\\[3.0pt] \unicode[STIX]{x1D61B}_{nml}\boldsymbol{B}_{nml}^{t}+\unicode[STIX]{x1D61A}_{nml}\boldsymbol{B}_{nml}^{p}\\[3.0pt] \unicode[STIX]{x1D61B}_{nml}^{\dagger }\boldsymbol{B}_{nml}^{t}+\unicode[STIX]{x1D61A}_{nml}^{\dagger }\boldsymbol{B}_{nml}^{p}\end{array}\right]. & & \displaystyle\end{eqnarray}$$
Here
 $\unicode[STIX]{x1D635}_{nml},~\unicode[STIX]{x1D634}_{nml},~\unicode[STIX]{x1D61B}_{nml}(t),~\unicode[STIX]{x1D61A}_{nml}(t),~\unicode[STIX]{x1D61B}_{nml}^{\dagger }(t)$
and
 $\unicode[STIX]{x1D61A}_{nml}^{\dagger }(t)$
are the spectral coefficients. We can use the same basis vector fields of
 $\boldsymbol{B}$
to represent
 $\boldsymbol{B}^{\dagger }$
since the adjoint magnetic field is solenoidal in the present gauge and has the same boundary conditions as
 $\boldsymbol{B}$
. We use the following as the toroidal (with a superscript
 $t$
) and poloidal (with a superscript
 $p$
) basis vector fields for
 $\boldsymbol{U}$
and
 $\boldsymbol{B}$
:
 $$\begin{eqnarray}\displaystyle \left.\begin{array}{@{}c@{}}\boldsymbol{U}_{nml}^{t}(r,\unicode[STIX]{x1D703},\unicode[STIX]{x1D719})=\unicode[STIX]{x1D735}\times \left(f_{n}^{l}(r)Y_{l}^{m}(\unicode[STIX]{x1D703},\unicode[STIX]{x1D719})\hat{\boldsymbol{r}}\right),\quad r\in {\mathcal{V}},\\[3.0pt] \boldsymbol{U}_{nml}^{p}(r,\unicode[STIX]{x1D703},\unicode[STIX]{x1D719})=\unicode[STIX]{x1D735}\times \unicode[STIX]{x1D735}\times \left(g_{n}^{l}(r)~Y_{l}^{m}(\unicode[STIX]{x1D703},\unicode[STIX]{x1D719})\hat{\boldsymbol{r}}\right),\quad r\in {\mathcal{V}},\end{array}\right\} & & \displaystyle\end{eqnarray}$$
 $$\begin{eqnarray}\displaystyle \boldsymbol{B}_{nml}^{t}(r,\unicode[STIX]{x1D703},\unicode[STIX]{x1D719})=\left\{\begin{array}{@{}l@{}}\unicode[STIX]{x1D735}\times \left(h_{n}^{l}(r)~Y_{l}^{m}(\unicode[STIX]{x1D703},\unicode[STIX]{x1D719})\hat{\boldsymbol{r}}\right),\quad r\in {\mathcal{V}},\quad \\[1.0pt] \mathbf{0},\quad r\in \hat{{\mathcal{V}}},\quad \end{array}\right. & & \displaystyle\end{eqnarray}$$
 $$\begin{eqnarray}\displaystyle \boldsymbol{B}_{nml}^{p}(r,\unicode[STIX]{x1D703},\unicode[STIX]{x1D719})=\left\{\begin{array}{@{}l@{}}\unicode[STIX]{x1D735}\times \unicode[STIX]{x1D735}\times \left(k_{n}^{l}(r)~Y_{l}^{m}(\unicode[STIX]{x1D703},\unicode[STIX]{x1D719})\hat{\boldsymbol{r}}\right),\quad r\in {\mathcal{V}},\quad \\[1.0pt] -lk_{n}^{l}(1)\unicode[STIX]{x1D735}\left(r^{-(l+1)}Y_{l}^{m}(\unicode[STIX]{x1D703},\unicode[STIX]{x1D719})\right),\quad r\in \hat{{\mathcal{V}}},\quad \end{array}\right. & & \displaystyle\end{eqnarray}$$
 $Y_{l}^{m}(\unicode[STIX]{x1D703},\unicode[STIX]{x1D719})$
are the spherical harmonics, and
 $f_{n}^{l}(r),~g_{n}^{l}(r),~h_{n}^{l}(r)$
and
 $k_{n}^{l}(r)$
are the radial basis functions. In appendix A we provide more technical details on how to use this basis. Here we only present the essential properties. All basis fields are infinitely differentiable at the origin
 $r=0$
. This gives the form of the polynomials as
 $r^{l+1}(a_{0}+a_{1}r^{2}+a_{2}r^{4}+\cdots \,)$
for each
 $l$
. All basis fields satisfy boundary conditions at
 $r=1$
. These are no-slip boundary conditions for the flow field and continuity conditions for the magnetic field. This requires
 $$\begin{eqnarray}\displaystyle & \displaystyle f_{n}^{l}(1)=0,\quad g_{n}^{l}(1)=~\frac{\unicode[STIX]{x2202}g_{n}^{l}}{\unicode[STIX]{x2202}r}(1)=0,\quad h_{n}^{l}(1)=0,\quad \frac{\unicode[STIX]{x2202}k_{n}^{l}(1)}{\unicode[STIX]{x2202}r}+l\,k_{n}^{l}(1)=0. & \displaystyle \nonumber\\ \displaystyle & & \displaystyle\end{eqnarray}$$
The vector field basis is orthonormal with respect to a predefined inner product. The radial functions for the velocity field and for the magnetic field are chosen such that
 $$\begin{eqnarray}\displaystyle \left.\begin{array}{@{}c@{}}{\displaystyle \frac{1}{V}}\langle (\unicode[STIX]{x1D735}\times \boldsymbol{U}_{nml}^{\unicode[STIX]{x1D70C}})\boldsymbol{\cdot }(\unicode[STIX]{x1D735}\times \boldsymbol{U}_{n^{\prime }m^{\prime }l^{\prime }}^{\unicode[STIX]{x1D70C}})\rangle =\unicode[STIX]{x1D6FF}_{nn^{\prime }}\unicode[STIX]{x1D6FF}_{mm^{\prime }}\unicode[STIX]{x1D6FF}_{ll^{\prime }},\\[3.0pt] \langle \boldsymbol{B}_{nml}^{\unicode[STIX]{x1D70C}}\boldsymbol{\cdot }\boldsymbol{B}_{n^{\prime }m^{\prime }l^{\prime }}^{\unicode[STIX]{x1D70C}}\rangle =\unicode[STIX]{x1D6FF}_{nn^{\prime }}\unicode[STIX]{x1D6FF}_{mm^{\prime }}\unicode[STIX]{x1D6FF}_{ll^{\prime }},\quad \unicode[STIX]{x1D70C}=t,p.\end{array}\right\} & & \displaystyle\end{eqnarray}$$
Using partial integration, the no-slip boundary conditions, and the solenoidal property of the basis functions, (2.36) are equivalent to
 $$\begin{eqnarray}\displaystyle & \displaystyle \frac{1}{V}\langle -\boldsymbol{U}_{nml}^{\unicode[STIX]{x1D70C}}\boldsymbol{\cdot }\unicode[STIX]{x1D6FB}^{2}\boldsymbol{U}_{n^{\prime }m^{\prime }l^{\prime }}^{\unicode[STIX]{x1D70C}}\rangle =\unicode[STIX]{x1D6FF}_{nn^{\prime }}\unicode[STIX]{x1D6FF}_{mm^{\prime }}\unicode[STIX]{x1D6FF}_{ll^{\prime }},\quad \unicode[STIX]{x1D70C}=t,p. & \displaystyle\end{eqnarray}$$
The orthonormal condition (2.37) simplifies the update step for the flow, which we will describe later in § 2.5. For the velocity field
 $\boldsymbol{U}$
, the radial functions are
 $$\begin{eqnarray}\displaystyle & \displaystyle \left.\begin{array}{@{}c@{}}\displaystyle f_{n}^{l}(r)=N_{n,l}^{f}\,r^{l+1}(P_{n}^{(0,l+1/2)}(2r^{2}-1)-P_{n-1}^{(0,l+1/2)}(2r^{2}-1)),\\[3.0pt] \displaystyle g_{n}^{l}(r)=N_{n,l}^{g}\,r^{l+1}\mathop{\sum }_{i=1}^{3}c_{i}\,P_{n+2-i}^{(0,l+1/2)}(2r^{2}-1),\\ \end{array}\right\} & \displaystyle\end{eqnarray}$$
 $$\begin{eqnarray}\displaystyle & \displaystyle \left.\begin{array}{@{}l@{}}c_{1}=2l+4n+1,\\[3.0pt] c_{2}=-2(2l+4n+3),\\[3.0pt] c_{3}=2l+4n+5,\end{array}\right\} & \displaystyle\end{eqnarray}$$
and for the magnetic field
 $\boldsymbol{B}$
the radial functions are
 $$\begin{eqnarray}\displaystyle & \displaystyle \left.\begin{array}{@{}c@{}}h_{n}^{l}(r)=N_{n,l}^{h}\,r^{l+1}(1-r^{2})P_{n-1}^{(2,l+1/2)}(2r^{2}-1),\\[3.0pt] k_{n}^{l}(r)=N_{n,l}^{k}\,r^{l+1}(c_{1}P_{n}^{(0,l+1/2)}(2r^{2}-1)+c_{2}P_{n-1}^{(0,l+1/2)}(2r^{2}-1)),\end{array}\right\} & \displaystyle\end{eqnarray}$$
 $$\begin{eqnarray}\displaystyle & \displaystyle \left.\begin{array}{@{}l@{}}c_{1}=n(2l+2n-1),\\[3.0pt] c_{2}=-(n+1)(2n+2l+1),\end{array}\right\} & \displaystyle\end{eqnarray}$$
where
 $P_{\unicode[STIX]{x1D706}}^{(\unicode[STIX]{x1D6FC},\unicode[STIX]{x1D6FD})}$
are Jacobi polynomials. The numbers
 $N_{n,l}^{j},~j=f,g,h,k$
, are normalization factors and they are chosen such that the basis is orthonormal as in (2.36). Without this factor, the basis is only orthogonal. The procedure of constructing this polynomial basis is described by Livermore (Reference Livermore2009, Reference Livermore2010) and Livermore & Ierley (Reference Livermore and Ierley2010). The scalar products are positive definite and symmetric and they have particular benefits when it comes to calculating norms:
 $$\begin{eqnarray}\displaystyle & \displaystyle \frac{1}{V}\langle (\unicode[STIX]{x1D735}\times \boldsymbol{U})^{2}\rangle =\mathop{\sum }_{l,m,n}\unicode[STIX]{x1D635}_{nml}^{2}+\unicode[STIX]{x1D634}_{nml}^{2},\quad \langle \boldsymbol{B}^{2}\rangle =\mathop{\sum }_{l,m,n}\unicode[STIX]{x1D61B}_{nml}^{2}+\unicode[STIX]{x1D61A}_{nml}^{2}. & \displaystyle\end{eqnarray}$$
2.5 The optimization algorithm
We initialize the algorithm with randomly distributed spectral coefficients or we restart from previously stored fields. In all cases the initial coefficients are normalized such that
 $$\begin{eqnarray}\displaystyle & \displaystyle \mathop{\sum }_{l,m,n}\unicode[STIX]{x1D635}_{nml}^{2}+\unicode[STIX]{x1D634}_{nml}^{2}=1,\quad \mathop{\sum }_{l,m,n}\unicode[STIX]{x1D61B}_{nml}(0)^{2}+\unicode[STIX]{x1D61A}_{nml}(0)^{2}=1. & \displaystyle\end{eqnarray}$$
We then enter the optimization loop. We inject the field expansion into the forward problem (2.24) and project it onto the magnetic field basis using the orthonormality condition. This gives a system of ordinary differential equations
 $$\begin{eqnarray}\displaystyle & \displaystyle \unicode[STIX]{x2202}_{t}\unicode[STIX]{x1D61B}_{nml}=Rm\,\langle \boldsymbol{B}_{nml}^{t}\boldsymbol{\cdot }[\unicode[STIX]{x1D735}\times (\boldsymbol{U}\times \boldsymbol{B})]\rangle +\mathop{\sum }_{n^{\prime }}\mathbb{T}_{nn^{\prime }}^{l}\unicode[STIX]{x1D61B}_{n^{\prime }ml}, & \displaystyle\end{eqnarray}$$
 $$\begin{eqnarray}\displaystyle & \displaystyle \unicode[STIX]{x2202}_{t}\unicode[STIX]{x1D61A}_{nml}=Rm\,\langle \boldsymbol{B}_{nml}^{p}\boldsymbol{\cdot }[\unicode[STIX]{x1D735}\times (\boldsymbol{U}\times \boldsymbol{B})]\rangle +\mathop{\sum }_{n^{\prime }}\mathbb{P}_{nn^{\prime }}^{l}\unicode[STIX]{x1D61A}_{n^{\prime }ml}, & \displaystyle\end{eqnarray}$$
to be integrated for
 $t:0\rightarrow T$
. On the right-hand side, the matrix elements
 $$\begin{eqnarray}\displaystyle & \displaystyle \mathbb{T}_{nn^{\prime }}^{l}=\langle \boldsymbol{B}_{nml}^{t},\unicode[STIX]{x1D6FB}^{2}\boldsymbol{B}_{n^{\prime }ml}^{t}\rangle ,\quad \mathbb{P}_{nn^{\prime }}^{l}=\langle \boldsymbol{B}_{nml}^{p},\unicode[STIX]{x1D6FB}^{2}\boldsymbol{B}_{n^{\prime }ml}^{p}\rangle & \displaystyle\end{eqnarray}$$
capture the effect of magnetic diffusion; they are precomputed in Mathematica. To calculate the nonlinear induction term in practice, we choose to introduce a physical space grid that is composed of Fourier grid points in
 $\unicode[STIX]{x1D719}$
and Gaussian quadrature points in
 $r$
and
 $\unicode[STIX]{x1D703}$
; more details are given in appendix A.3. The numerical scheme for time integration is Crank–Nicolson for the diffusive terms and second-order Adams–Bashforth for the induction terms. The initialization condition for the adjoint magnetic field is given by the magnetic field at time
 $T$
as in (2.25). In terms of spectral coefficients, we have
 $$\begin{eqnarray}\displaystyle & \displaystyle \unicode[STIX]{x1D61B}_{nml}^{\dagger }(T)=\frac{2\unicode[STIX]{x1D61B}_{nml}(T)}{\displaystyle \mathop{\sum }_{l,m,n}\unicode[STIX]{x1D61B}_{nml}(T)^{2}+\unicode[STIX]{x1D61A}_{nml}(T)^{2}},\quad \unicode[STIX]{x1D61A}_{nml}^{\dagger }(T)=\frac{2\unicode[STIX]{x1D61A}_{nml}(T)}{\displaystyle \mathop{\sum }_{l,m,n}\unicode[STIX]{x1D61B}_{nml}(T)^{2}+\unicode[STIX]{x1D61A}_{nml}(T)^{2}}. & \displaystyle \nonumber\\ \displaystyle & & \displaystyle\end{eqnarray}$$
A similar projection of the adjoint induction equation (2.26) onto the basis of toroidal magnetic field
 $\boldsymbol{B}^{t}$
yields
 $$\begin{eqnarray}\displaystyle & \displaystyle \unicode[STIX]{x2202}_{t}\unicode[STIX]{x1D61B}_{nml}^{\dagger }=Rm\,\langle \boldsymbol{B}_{nml}^{t}\boldsymbol{\cdot }[\boldsymbol{U}\times (\unicode[STIX]{x1D735}\times \boldsymbol{B}^{\dagger })]\rangle -\mathop{\sum }_{n^{\prime }}\mathbb{T}_{nn^{\prime }}^{l}\,\unicode[STIX]{x1D61B}_{n^{\prime }ml}^{\dagger }, & \displaystyle\end{eqnarray}$$
which we integrate backwards in time for
 $t:T\rightarrow 0$
; similarly for the poloidal magnetic field
 $\boldsymbol{B}^{p}$
, see appendix A.3. We also use a similar time discretization scheme as in the forward model. The diffusion matrices
 $\mathbb{T}_{nn^{\prime }}^{l}$
and
 $\mathbb{P}_{nn^{\prime }}^{l}$
are unchanged from (2.46). The field
 $\unicode[STIX]{x1D713}^{\dagger }$
is never used within our numerical scheme: when we use this Galerkin basis, the projection of
 $\unicode[STIX]{x1D713}^{\dagger }$
onto the basis of
 $\boldsymbol{B}$
gives
 $\langle \boldsymbol{B}_{nml}^{t}\boldsymbol{\cdot }\unicode[STIX]{x1D735}\unicode[STIX]{x1D713}^{\dagger }\rangle =\langle \boldsymbol{B}_{nml}^{p}\boldsymbol{\cdot }\unicode[STIX]{x1D735}\unicode[STIX]{x1D713}^{\dagger }\rangle =0$
.
The seed magnetic field update is simple, since we can directly project the update formula (2.31) onto the vector field basis. In terms of spectral coefficients, we have
 $$\begin{eqnarray}\displaystyle \unicode[STIX]{x1D61B}_{nml}(0) & := & \displaystyle \unicode[STIX]{x1D61B}_{nml}(0)+\frac{\unicode[STIX]{x1D6FC}_{2}}{2\unicode[STIX]{x1D706}_{2}}\left(\unicode[STIX]{x1D61B}_{nml}^{\dagger }(0)-2\unicode[STIX]{x1D706}_{2}~\unicode[STIX]{x1D61B}_{nml}(0)\right)\nonumber\\ \displaystyle & = & \displaystyle \unicode[STIX]{x1D61B}_{nml}(0)+\unicode[STIX]{x1D6FF}\unicode[STIX]{x1D61B}_{nml}(0),\end{eqnarray}$$
for the toroidal magnetic field, where
 $\unicode[STIX]{x1D6FF}\unicode[STIX]{x1D61B}_{nml}$
denotes the incremental change of spectral coefficient between consecutive iterations. We use the same update formula for the poloidal field. By requiring that the updated seed magnetic field remains normalized, we find a quadratic polynomial that sets
 $\unicode[STIX]{x1D706}_{2}$
:
 $$\begin{eqnarray}\displaystyle & & \displaystyle \mathop{\sum }_{l,m,n}4\unicode[STIX]{x1D706}_{2}^{2}(\unicode[STIX]{x1D6FC}_{2}-2)+4\unicode[STIX]{x1D706}_{2}(1-\unicode[STIX]{x1D6FC}_{2})\left(\unicode[STIX]{x1D61B}_{nml}(0)\unicode[STIX]{x1D61B}_{nml}^{\dagger }(0)+\unicode[STIX]{x1D61A}_{nml}(0)\unicode[STIX]{x1D61A}_{nml}^{\dagger }(0)\right)\nonumber\\ \displaystyle & & \displaystyle \quad +\,\unicode[STIX]{x1D6FC}_{2}\left(\unicode[STIX]{x1D61B}_{nml}^{\dagger }(0)^{2}+\unicode[STIX]{x1D61A}_{nml}^{\dagger }(0)^{2}\right)=0.\end{eqnarray}$$
Provided
 $\unicode[STIX]{x1D6FC}_{2}<2$
, there is always just one positive root of (2.50), which we choose.
To update the velocity field
 $\boldsymbol{U}$
, we must first calculate the integral term that appears in
 $\unicode[STIX]{x1D6FF}{\mathcal{L}}/\unicode[STIX]{x1D6FF}\boldsymbol{U}$
. We store the spectral coefficients
 $\unicode[STIX]{x1D61B}_{nml}(t_{i})$
and
 $\unicode[STIX]{x1D61A}_{nml}(t_{i})$
of
 $\boldsymbol{B}$
at all discrete times
 $t_{i}$
. Since the code is parallelized for a distributed memory architecture, a checkpointing strategy is not required. During the backward time integration, we then calculate the integral term projected on the vector basis of
 $\boldsymbol{U}$
using the trapezoidal rule,
 $$\begin{eqnarray}\displaystyle & \displaystyle \mathscr{I}_{nml}^{t,p}=\mathop{\sum }_{i=0}^{N}\unicode[STIX]{x1D6FD}_{i}\,\unicode[STIX]{x0394}t\,\langle \boldsymbol{U}_{nml}^{t,p}\boldsymbol{\cdot }[\boldsymbol{B}(\boldsymbol{x},t_{i})\times (\unicode[STIX]{x1D735}\times \boldsymbol{B}^{\dagger }(\boldsymbol{x},t_{i}))]\rangle , & \displaystyle\end{eqnarray}$$
with the superscript indicating either toroidal
 $t$
or poloidal
 $p$
components,
 $\unicode[STIX]{x0394}t$
is the time-step size,
 $N$
is the total number of time steps and
 $\unicode[STIX]{x1D6FD}_{0}=\unicode[STIX]{x1D6FD}_{N}=0.5$
,
 $\unicode[STIX]{x1D6FD}_{i}=1$
,
 $i=1,\ldots ,N-1$
are the integration weights. In a similar vein to the calculation of the induction terms, we need a transformation to physical space to calculate the nonlinear terms in (2.51); see appendix A.3. We expand the field
 $\unicode[STIX]{x0394}\boldsymbol{U}$
onto the vector field basis of
 $\boldsymbol{U}$
and project (2.30) onto the vector field basis. Using the property (2.37), we then find an explicit formula for the spectral coefficients of
 $\unicode[STIX]{x0394}\boldsymbol{U}$
that finally sets the update formula for the spectral coefficients of
 $\boldsymbol{U}$
. The toroidal coefficients are given by
 $$\begin{eqnarray}\displaystyle \unicode[STIX]{x1D635}_{nml} & := & \displaystyle \unicode[STIX]{x1D635}_{nml}+\frac{\unicode[STIX]{x1D6FC}_{1}}{2\unicode[STIX]{x1D706}_{1}}(\mathscr{I}_{nml}^{p}-2\unicode[STIX]{x1D706}_{1}\unicode[STIX]{x1D635}_{nml})\nonumber\\ \displaystyle & = & \displaystyle \unicode[STIX]{x1D635}_{nml}+\unicode[STIX]{x1D6FF}\unicode[STIX]{x1D635}_{nml},\end{eqnarray}$$
where
 $\unicode[STIX]{x1D6FF}\unicode[STIX]{x1D635}_{nml}$
denotes the incremental change; a similar formula applies for the update of poloidal coefficients. The value of
 $\unicode[STIX]{x1D706}_{1}$
is calculated in the same way as
 $\unicode[STIX]{x1D706}_{2}$
. Once this update is performed, we return to the forward integration and iterate through the whole loop until convergence. At each iteration in the optimization loop, we measure progress through the incremental change in the fields,
 $$\begin{eqnarray}\displaystyle & \displaystyle r_{B_{0}}^{2}=\mathop{\sum }_{l,m,n}\unicode[STIX]{x1D6FF}\unicode[STIX]{x1D61B}_{nml}(0)^{2}+\unicode[STIX]{x1D6FF}\unicode[STIX]{x1D61A}_{nml}(0)^{2},\quad r_{U}^{2}=\mathop{\sum }_{l,m,n}\unicode[STIX]{x1D6FF}\unicode[STIX]{x1D635}_{nml}^{2}+\unicode[STIX]{x1D6FF}\unicode[STIX]{x1D634}_{nml}^{2}, & \displaystyle\end{eqnarray}$$
and the total residue is
 $$\begin{eqnarray}\displaystyle & \displaystyle r_{t}=\sqrt{r_{U}^{2}+r_{B_{0}}^{2}}. & \displaystyle\end{eqnarray}$$
Besides tracking the residue, we also follow how
 $\langle (\boldsymbol{B}_{T})^{2}\rangle$
evolves. We terminate the optimization when
 $r_{t}$
is smaller than a fixed value and when
 $\langle (\boldsymbol{B}_{T})^{2}\rangle$
no longer changes significantly. The relaxation parameters
 $\unicode[STIX]{x1D6FC}_{1}$
and
 $\unicode[STIX]{x1D6FC}_{2}$
are prescribed and adjusted depending on the value of
 $r_{t}$
. We typically choose
 $0.1<\unicode[STIX]{x1D6FC}_{j}<0.5,~j=1,2$
, for the first five iterations if starting from random initial conditions, then sharply reduce
 $\unicode[STIX]{x1D6FC}_{j}$
to approximately
 $0.01$
. This reduction in
 $\unicode[STIX]{x1D6FC}_{j}$
is to prevent the optimizer from oscillating around a fixed point in the parameter space of
 $\boldsymbol{U}$
. If the residue
 $r_{t}<0.005$
, which indicates that we are close to the optimum, we increase the relaxation parameters again to
 $0.04<\unicode[STIX]{x1D6FC}_{j}<0.1$
to speed up convergence. We directly use step size
 $0.04<\unicode[STIX]{x1D6FC}_{j}<0.1$
if restarting from previously stored fields, which in general are moderately converged with a relatively small
 $r_{t}$
. This is close to the value of
 $0.05$
used in Duguet et al. (Reference Duguet, Monokrousos, Brandt and Henningson2013). We also repeated the optimizations with different choices of
 $\unicode[STIX]{x1D6FC}_{j}$
but nevertheless reached the same optimum.
2.6 Degeneracy of the optimum
This optimization problem does not have a unique solution due to an infinite but trivial degeneracy. The symmetry group of the sphere is the orthogonal group
 $O(3)$
, which includes rotational symmetries and reflection symmetries. Any particular transform in the group can be represented using an orthogonal matrix
 $\boldsymbol{{\mathcal{R}}}$
. For any given flow
 $\boldsymbol{U}$
or magnetic field
 $\boldsymbol{B}$
, we can define transformed fields as
 $$\begin{eqnarray}\displaystyle & \displaystyle \widetilde{\boldsymbol{U}}(\boldsymbol{x})=\boldsymbol{{\mathcal{R}}}^{T}\boldsymbol{U}(\boldsymbol{{\mathcal{R}}}\boldsymbol{x}),\quad \widetilde{\boldsymbol{B}}(\boldsymbol{x},t)=\boldsymbol{{\mathcal{R}}}^{T}\boldsymbol{B}(\boldsymbol{{\mathcal{R}}}\boldsymbol{x},t). & \displaystyle\end{eqnarray}$$
Under the proper transformation rules for the adjoint variables and multipliers, it is not difficult to show that our Lagrangian is invariant under rotations and reflections, meaning that
 $$\begin{eqnarray}\displaystyle & \displaystyle {\mathcal{L}}(\boldsymbol{U},\boldsymbol{B},\ldots )={\mathcal{L}}(\widetilde{\boldsymbol{U}},\widetilde{\boldsymbol{B}},\ldots ). & \displaystyle\end{eqnarray}$$
If
 $\boldsymbol{U}$
is an optimal dynamo that drives the field
 $\boldsymbol{B}$
, then any transformed field
 $\widetilde{\boldsymbol{U}}$
is also an optimal dynamo that drives the transformed field
 $\widetilde{\boldsymbol{B}}$
. Note that degeneracy should not be confused with symmetries within a particular solution – degeneracy is a general property of any optimal solution in our set-up.
Benchmark of the growth rate for the most unstable magnetic field eigenmode (
 $m=0$
) for the axisymmetric modified Dudley–James (MDJ)
 $t_{1}s_{2}$
flow at
 $Rm=545.9$
, compared with a previously reported value of
 $\unicode[STIX]{x1D6FE}=-6.92884871$
(Livermore & Jackson Reference Livermore and Jackson2005).

3 Results
3.1 Preliminary tests
Before running the optimization, we first benchmark our forward model using an axisymmetric flow termed the modified Dudley–James (MDJ)
 $t_{1}s_{1}$
flow, as studied by Livermore & Jackson (Reference Livermore and Jackson2005) and Li et al. (Reference Li, Livermore and Jackson2010); see appendix B. We use three different spectral resolutions, and the results are shown in table 1. We see that the highest resolution
 $(l_{max},n_{max})=(32,32)$
gives the best match with the known value, but a smaller resolution
 $(l_{max},n_{max})=(24,12)$
is good enough to give three decimal places of accuracy and has much less computational cost. For most of the optimization, we use either
 $(l_{max},n_{max})=(16,8)$
or
 $(24,12)$
; then for verification purposes we add one more optimization run with
 $(l_{max},n_{max})=(24,24)$
.
We also verify the projection of the variational derivative (2.17) onto the basis of
 $\boldsymbol{U}$
. This quantity contains information about the adjoint model at all time steps and is important for the update. We set
 $\unicode[STIX]{x1D706}_{1}=0$
in (2.17) for this test due to the convenient choice of orthonormal properties of the vector bases in (2.37), and also to remove the constraint on unity enstrophy in (2.23). We want to compare how the Lagrangian varies with respect to a small perturbation on the flow field
 $\boldsymbol{U}$
using two methods. First, we compute the variations using a forward model. Since we have all other constraints satisfied, each component of the variation
 $\unicode[STIX]{x1D6FF}{\mathcal{L}}$
is given by
 $$\begin{eqnarray}\displaystyle & \displaystyle \unicode[STIX]{x1D6FF}{\mathcal{L}}_{nml}^{\unicode[STIX]{x1D70C}}=\frac{\ln \langle (\boldsymbol{B}_{T_{per}})^{2}\rangle -\ln \langle (\boldsymbol{B}_{T})^{2}\rangle }{\unicode[STIX]{x1D700}}, & \displaystyle\end{eqnarray}$$
where
 ${\boldsymbol{B}_{T}}_{per}$
is the final magnetic field at time
 $T$
generated by a given random flow field plus a small perturbation,
 $\boldsymbol{U}+\unicode[STIX]{x1D700}\boldsymbol{U}_{nml}^{\unicode[STIX]{x1D70C}},~\unicode[STIX]{x1D70C}=t,p$
. Each component with a different index in
 $n,m,l$
needs to be calculated separately using a forward model, while
 $\boldsymbol{B}_{T}$
is computed once without adding perturbations in the random flow field
 $\boldsymbol{U}$
using a forward model. Second, we calculate the variational derivative
 $\unicode[STIX]{x1D6FF}{\mathcal{L}}/\unicode[STIX]{x1D6FF}\boldsymbol{U}$
projected onto the vector space of
 $\boldsymbol{U}$
as in (2.51) by launching the adjoint model only once. The two variations are related by taking the limit of the perturbation amplitude
 $\unicode[STIX]{x1D700}$
to zero:
 $$\begin{eqnarray}\displaystyle & \displaystyle \lim _{\unicode[STIX]{x1D700}\rightarrow 0}\unicode[STIX]{x1D6FF}{\mathcal{L}}_{nml}^{\unicode[STIX]{x1D70C}}=\left\langle \frac{\unicode[STIX]{x1D6FF}{\mathcal{L}}}{\unicode[STIX]{x1D6FF}\boldsymbol{U}}\boldsymbol{\cdot }\boldsymbol{U}_{nml}^{\unicode[STIX]{x1D70C}}\right\rangle ,\quad \unicode[STIX]{x1D70C}=t,p. & \displaystyle\end{eqnarray}$$
We then compare the right-hand sides of (3.1) and (3.2) in spectral space by setting
 $\unicode[STIX]{x1D700}$
to a very small value. All realizations used here have the same initial
 $\boldsymbol{B}_{0}$
and
 $\boldsymbol{U}$
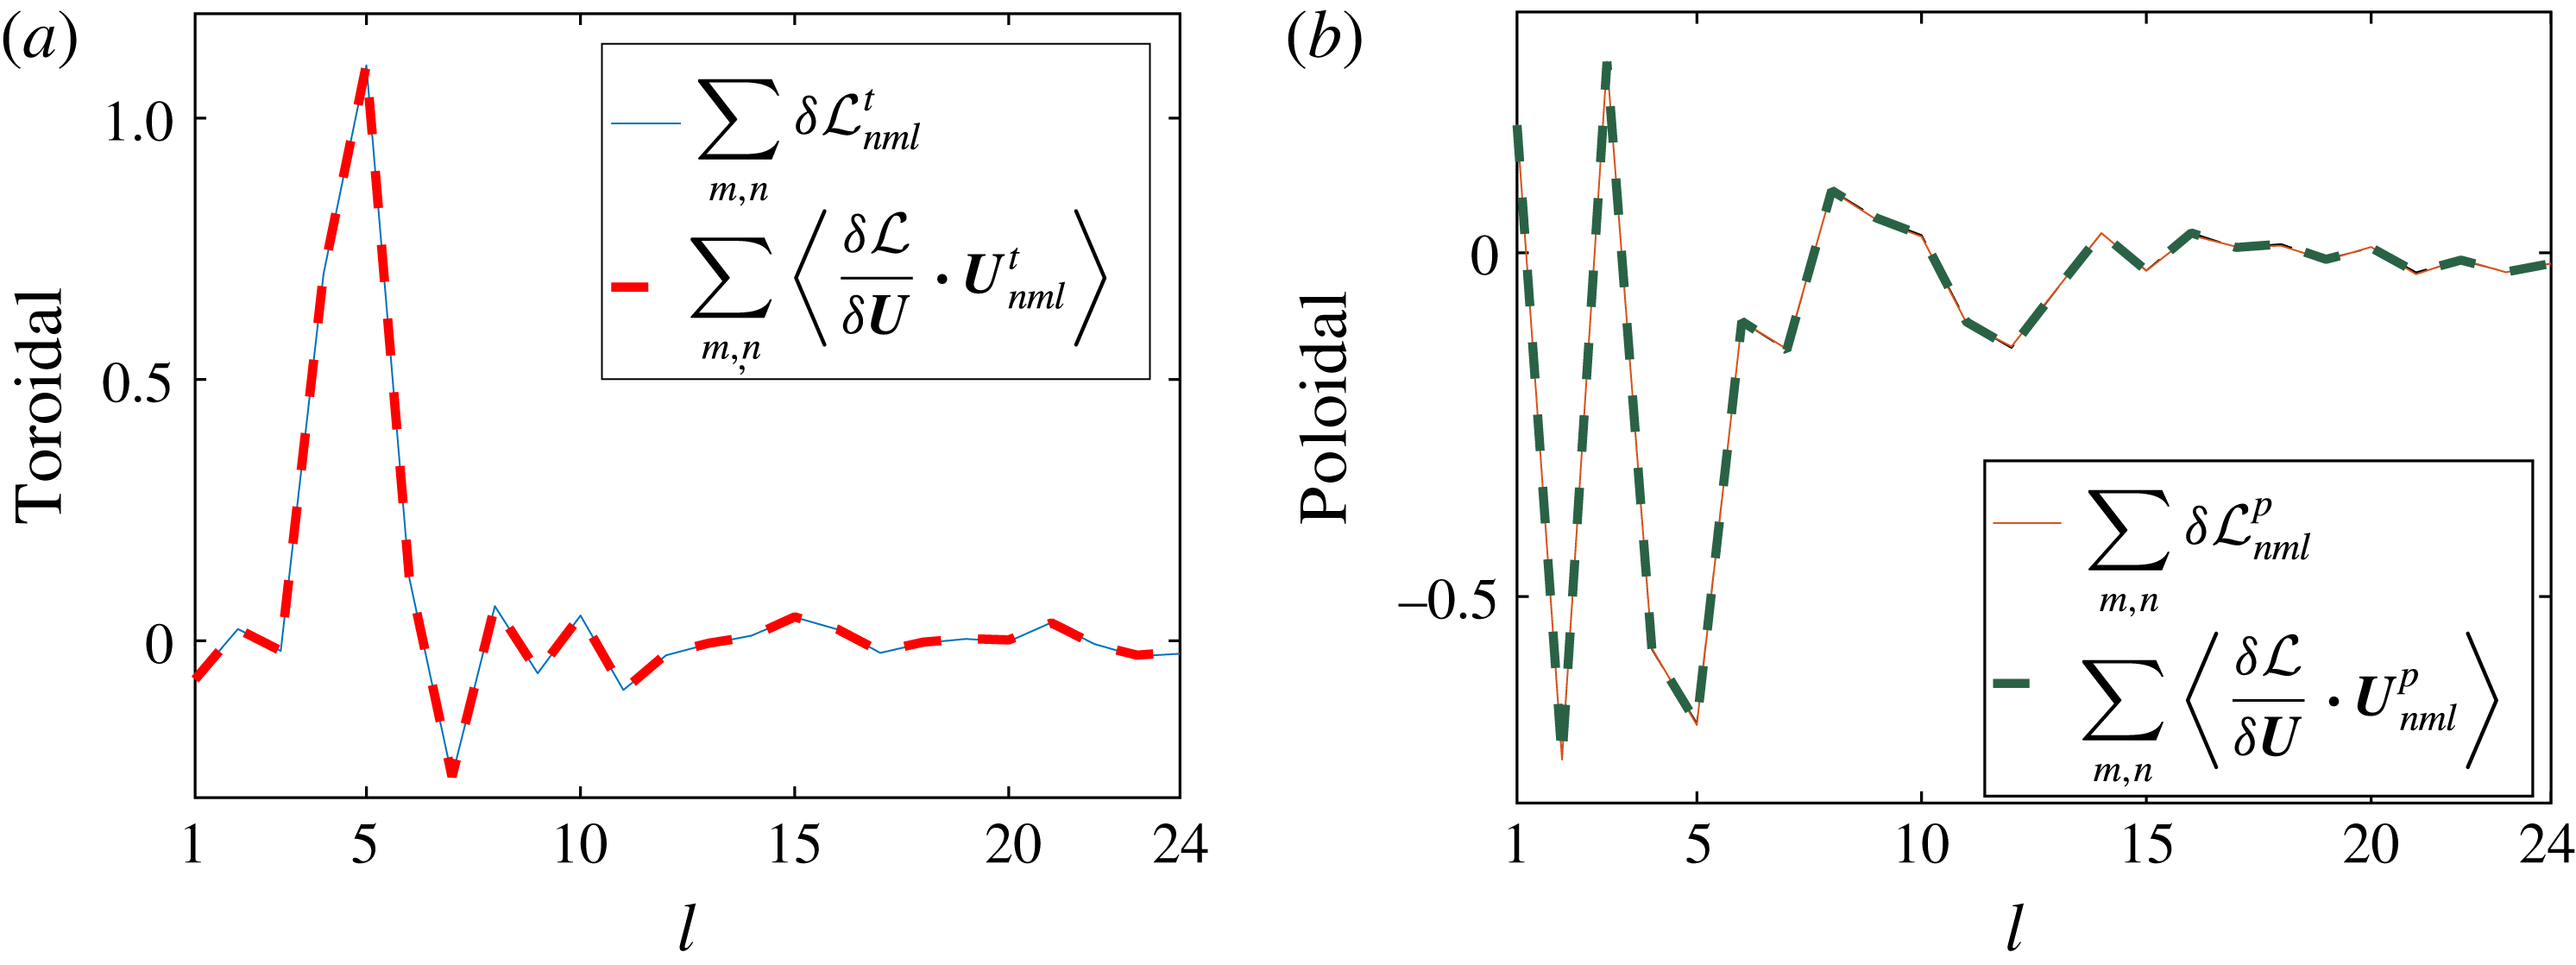
. The test result shows good agreement; see figure 1.
Verification of the adjoint model. Parameters used in the test:
 $Rm=60$
,
 $T=0.1$
,
 $\unicode[STIX]{x0394}t=10^{-4}$
,
 $\unicode[STIX]{x1D700}=10^{-4}$
and
 $(l_{max},n_{max})=(24,12)$
. (a) Toroidal flow coefficients. (b) Poloidal flow coefficients. There is almost exact overlay of the curves depicting the variations in
 ${\mathcal{L}}$
obtained through the two methods.

3.2 A systematic survey identifies the
$Rm_{c,min}$

In a systematic survey, we launch optimizations for various values of the control parameters. The time step
 $\unicode[STIX]{x0394}t$
is set to at most
 $10^{-4}$
. The total integration time is mainly
 $T=2$
except in one optimization where
 $T=2.5$
for verification. We have initiated the optimization loops from either random or previously stored fields. The tolerance level on
 $r_{t}$
gradually decreases in a refinement approach. For each of these runs, we measure the optimal growth rate
 $\unicode[STIX]{x1D6FE}$
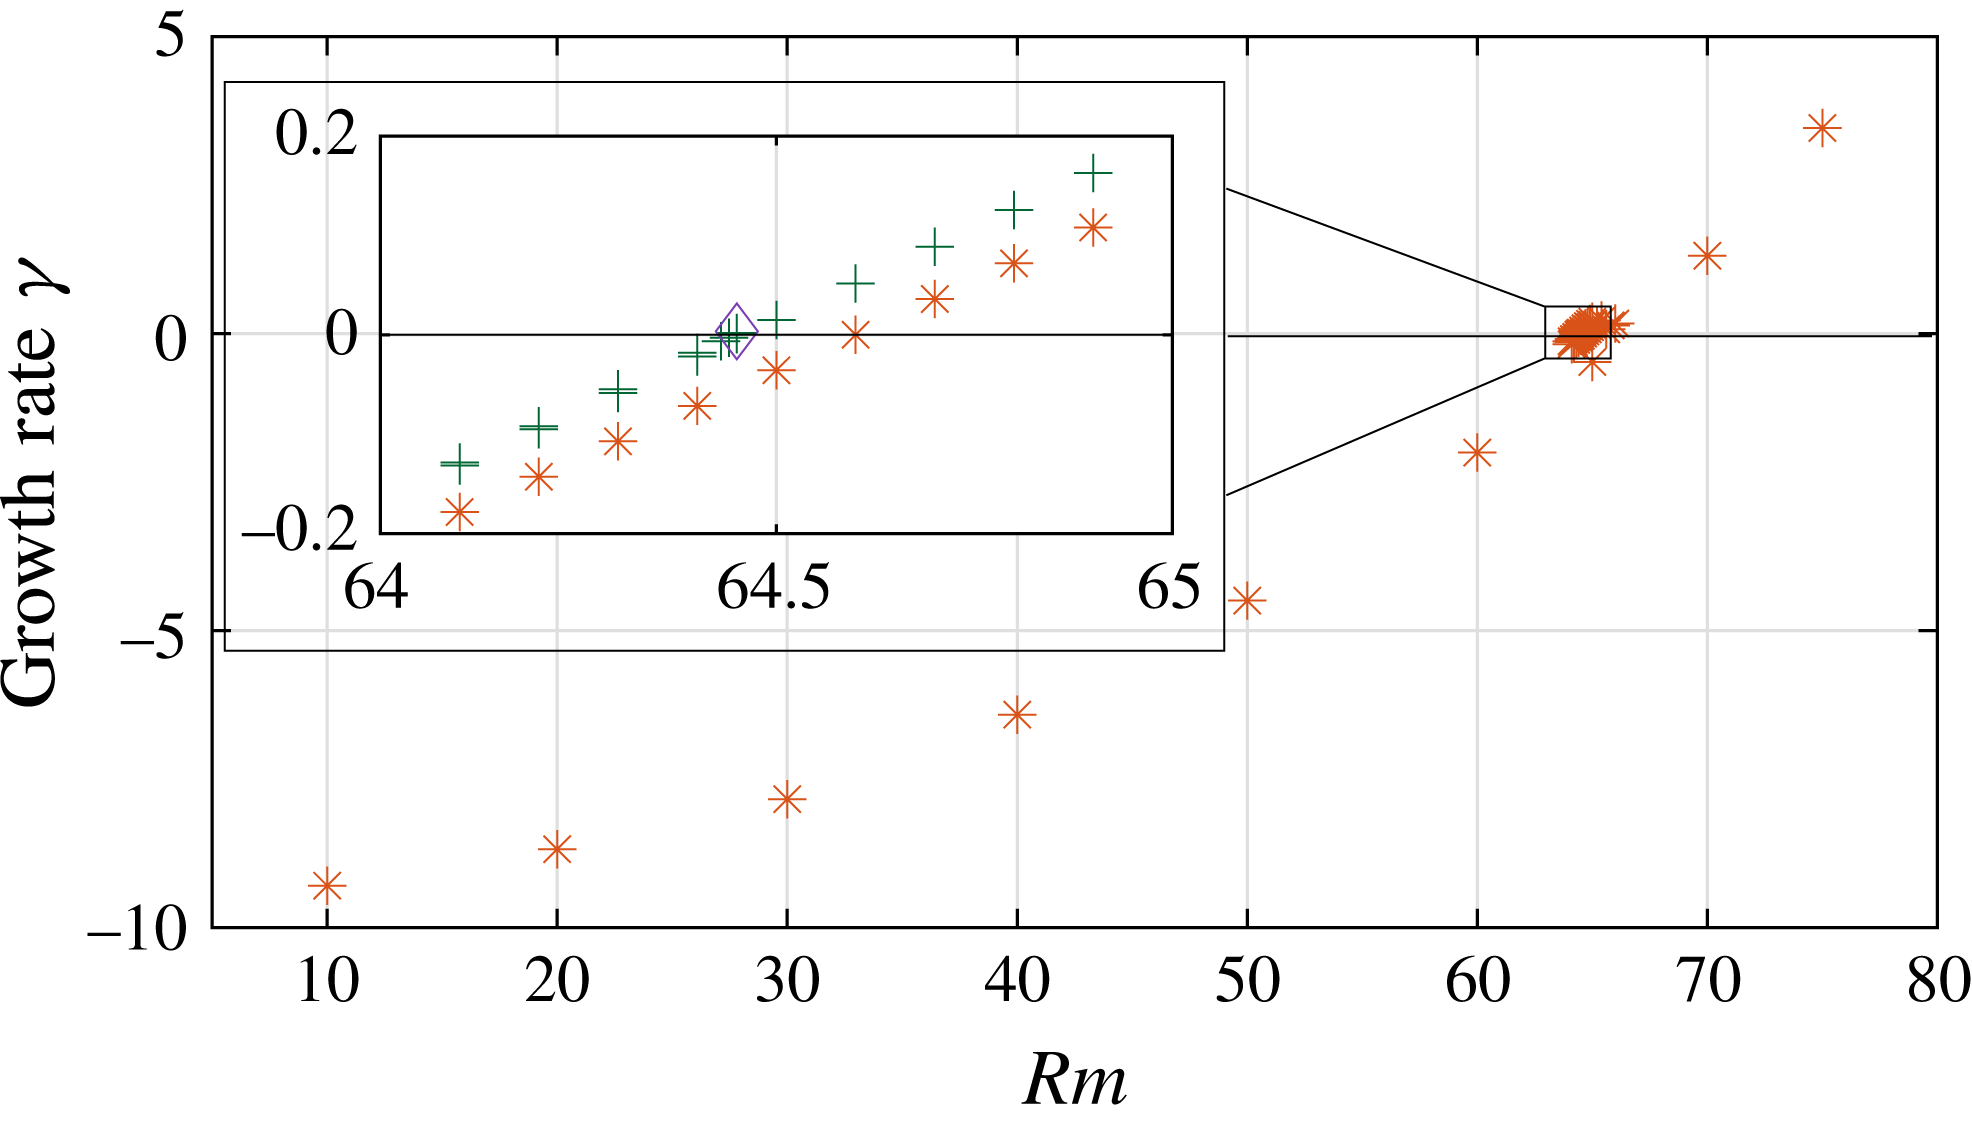
near the end of the time interval. Detailed information on all optimization runs is given in the supplementary materials available at https://doi.org/10.1017/jfm.2017.924. In figure 2, we show the growth rate from multiple optimization runs, performed at different resolutions in order to finally locate the optimal dynamo threshold at
 $$\begin{eqnarray}\displaystyle & \displaystyle Rm_{c,min}\approx 64.45. & \displaystyle\end{eqnarray}$$
We refer to this optimal solution as model R1. To ensure that we did not get stuck in a local optimum, we ran an independent optimization at this
 $Rm_{c,min}$
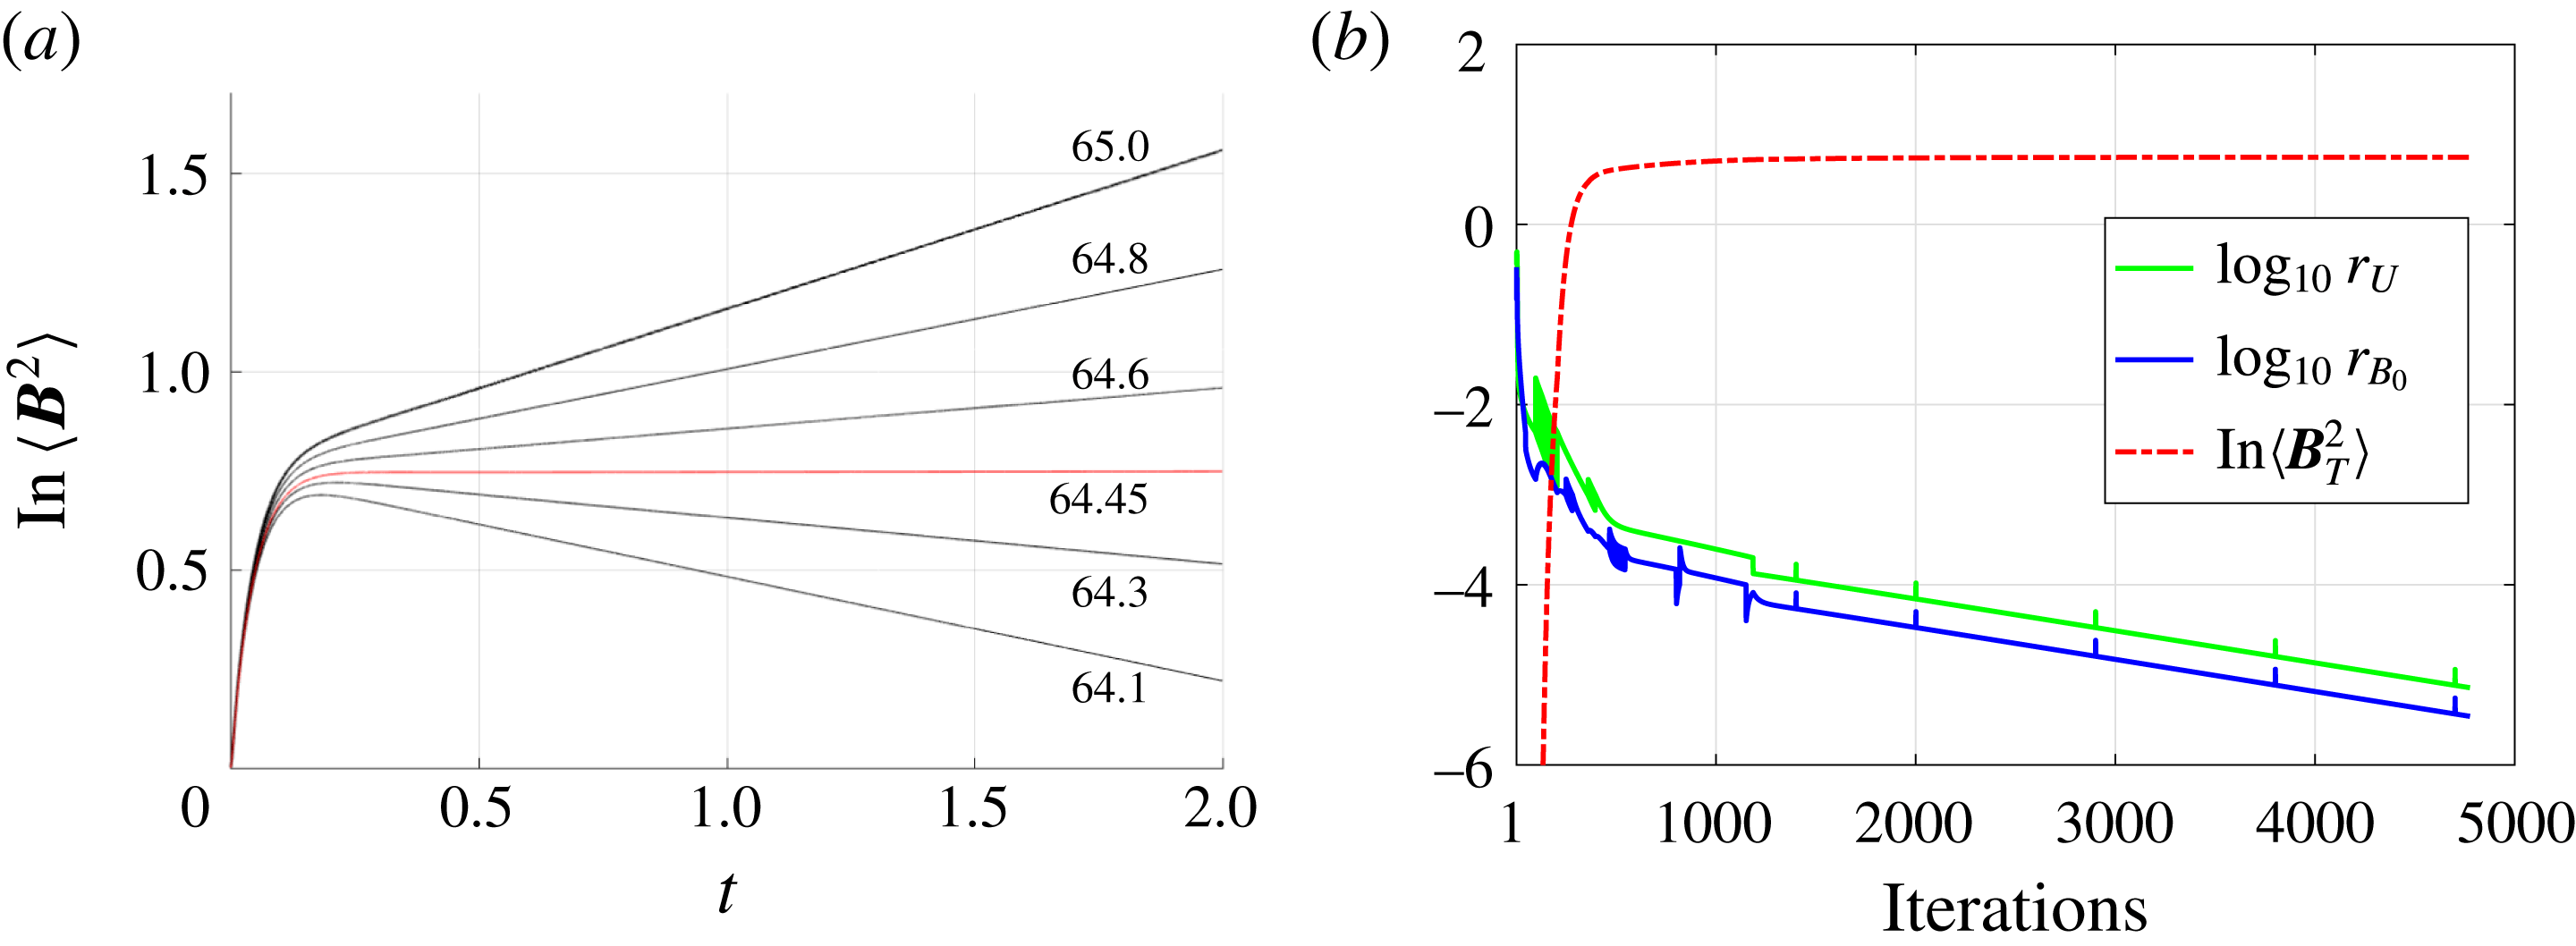
, without restarting from a previous optimum, which we labelled as model R2. This second independent optimization confirms the location of the threshold. In fact, model R2 is a degenerate solution (see § 2.6) of model R1. In figure 3(a), we show the logarithm of the magnetic energy as a function of time for optimized solutions near the minimal onset of dynamos at
 $Rm_{c,min}$
. We clearly see that the exponential regime is well established and that the optimal dynamos are non-oscillatory (
 $\unicode[STIX]{x1D6FA}=0$
in (2.10)). This indicates that
 $T=2$
is long enough to overcome the initial transient. The red curve highlights the run at the optimal dynamo threshold. An optimization run generally needs a few thousand iterations to converge from random initial conditions. It takes approximately two minutes per iteration on
 $24$
cores for
 $(l_{max},n_{max})=(24,12)$
resolution,
 $\unicode[STIX]{x0394}t=10^{-4}$
,
 $T=2$
. In figure 3(b), we show an example of the convergence as a function of iterations from a random start at
 $Rm=64.45$
using model R2. Clearly, most of the improvement happens in the first thousand iterations.
Main panel: the growth rate as a function of
 $Rm$
for multiple optimization runs. Inset: the near-zero growth rate as a function of
 $Rm$
coloured by different resolutions: orange stars,
 $(l_{max},n_{max})=(16,8)$
; green crosses,
 $(l_{max},n_{max})=(24,12)$
; purple diamond,
 $(l_{max},n_{max})=(24,24)$
.

(a) Logarithm of the magnetic energy
 $\langle \boldsymbol{B}^{2}\rangle$
as a function of time. Red line: data from the optimal solution at
 $Rm_{c,min}=64.45$
. Both models R1 and R2 give the same line. Black lines: all models with resolution
 $(l_{max},n_{max})=(24,12)$
and
 $r_{t}<10^{-4}$
for
 $Rm\in [64.1,65.0]$
. (b) The residues and change in the objective as a function of iteration numbers at
 $Rm=64.45$
in model R2. Resolutions:
 $(l_{max},n_{max})=(24,12)$
. Green (middle line): residue for flow field
 $\boldsymbol{U}$
. Blue (bottom line): residue for seed magnetic field
 $\boldsymbol{B}_{0}$
. Red (dashed line): the logarithm of final magnetic energy as a function of iterations.

3.3 The spatial structure of the optimal solution at
$Rm_{c,min}$

In order to have a complete picture of the optimal dynamo, we analyse the spatial structure of the optimal fields
 $\boldsymbol{U}$
and
 $\boldsymbol{B}_{T}$
at
 $Rm_{c,min}$
in both physical and spectral space.
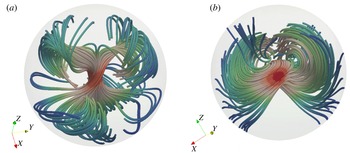
Spatial structures at
 $Rm_{c,min}$
from model R1: (a) streamlines of
 $\boldsymbol{U}$
and (b) streamlines of
 $\boldsymbol{B}_{T}$
. Field lines are coloured by local field intensity (red = intense, blue = weak) and indicate a localized structure near the centre. Structures with very small field intensity are not shown here. The plotted domain is
 $r\in [0,1]$
.

3.3.1 Analysis in physical space
In physical space, we show the three-dimensional structure of the streamlines of
 $\boldsymbol{U}$
and
 $\boldsymbol{B}_{T}$
from model R1 in figure 4(a,b), where field lines are coloured by the local field intensity; small-amplitude structures are not shown in the plots for clarity. In figure 4(a), the field lines appear to be twisting in a twofold manner. We see a drastic increase in the flow speed in the centre. Correspondingly, we also see a strong magnetic field close to the origin in figure 4(b). Overall, we find a quite complex structure in both
 $\boldsymbol{U}$
and
 $\boldsymbol{B}_{T}$
that apparently lacks reflectional symmetry. This lack of reflectional symmetry was also observed in the optimal dynamos in cubes with perfectly conducting or pseudo-vacuum boundaries (homogeneous cases NNN and TTT in Chen et al. (Reference Chen, Herreman and Jackson2015)). However, we observe a rotational symmetry of
 $\unicode[STIX]{x03C0}$
that the cubic models lack, i.e. only even-
 $m$
modes are present when the symmetry axis is aligned with the
 $\hat{\boldsymbol{z}}$
direction.
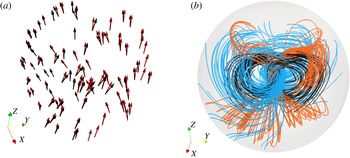
We also observe that the velocity and vorticity fields are nearly parallel in the centre, which gives a strong helical motion, shown in figure 5(a). The magnetic field seems to be enhanced strongly next to the spiral. This is evident when we combine figures 4(a,b) and 5(b), where we show the interaction of the flow field
 $\boldsymbol{U}$
and the magnetic field
 $\boldsymbol{B}_{T}$
, together with the structure of the vorticity field
 $\unicode[STIX]{x1D735}\times \boldsymbol{U}$
. We found the field structure of
 $\boldsymbol{B}_{T}$
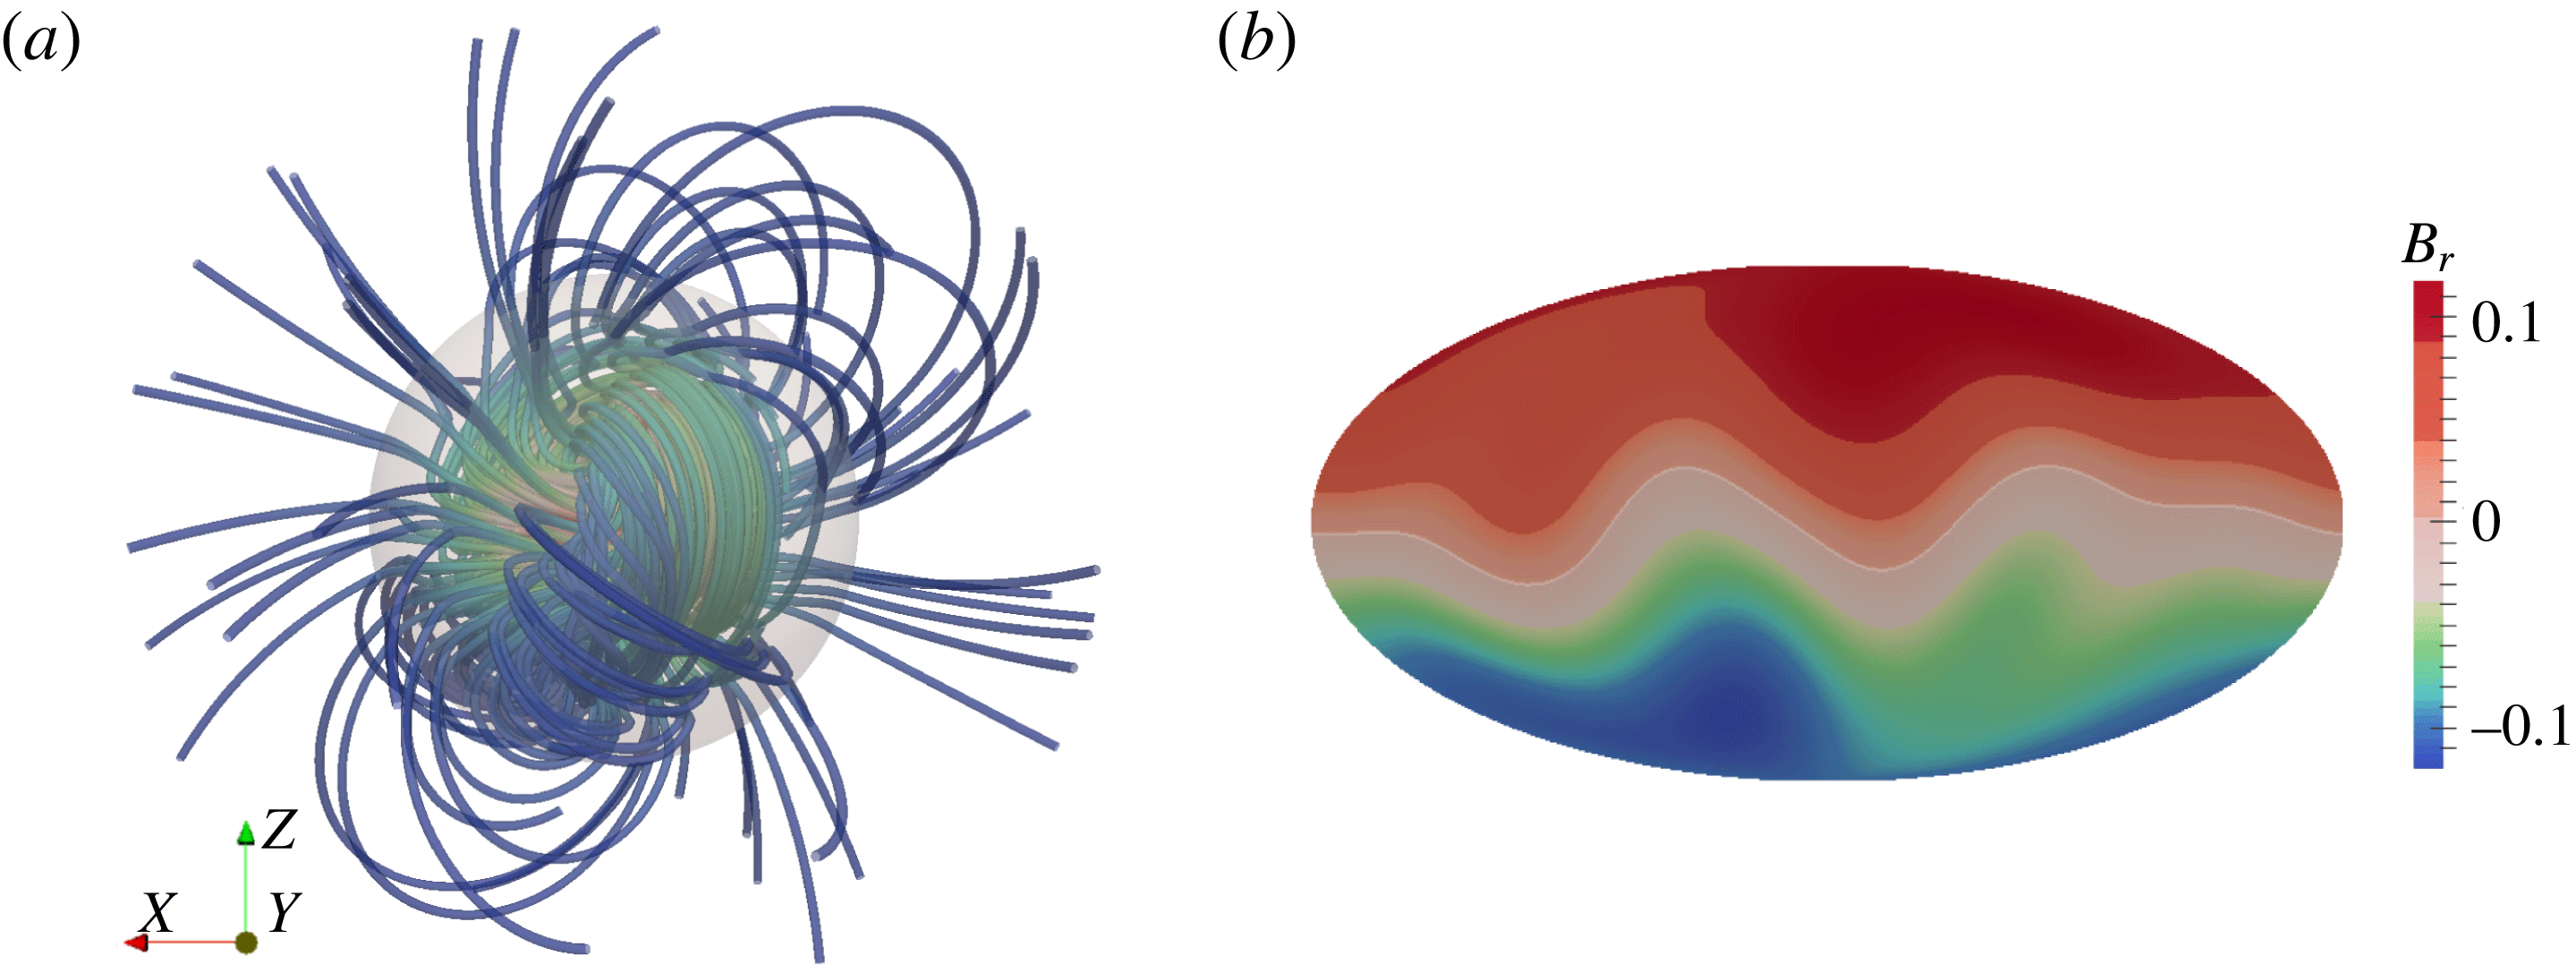
is mostly dipolar outside the sphere, shown in figure 6(a), where streamlines of the magnetic field extend to two radii. The Mollweide map of the radial magnetic field at the sphere surface also confirms that the dominant component is dipolar in figure 6(b). All plots mentioned in this paragraph are based on model R1; model R2 has the same spatial structures up to a rotation.
(a) The velocity field direction (red) and vorticity field direction (black) are nearly parallel within
 $r\leqslant 0.1$
. (b) Streamlines of the velocity field (orange), the vorticity field (black) and the magnetic field
 $\boldsymbol{B}_{T}$
(blue) within
 $r\leqslant 1$
. The magnetic field is strongest next to the helical fluid motion.

(a) Streamlines of
 $\boldsymbol{B}_{T}$
extended to one radius outside the sphere. (b) The Mollweide projection of the radial component
 $B_{r}$
of
 $\boldsymbol{B}_{T}$
at the surface of the sphere. The vector field
 $\boldsymbol{B}_{T}$
has been rotated such that the dominant dipole axis is vertical.

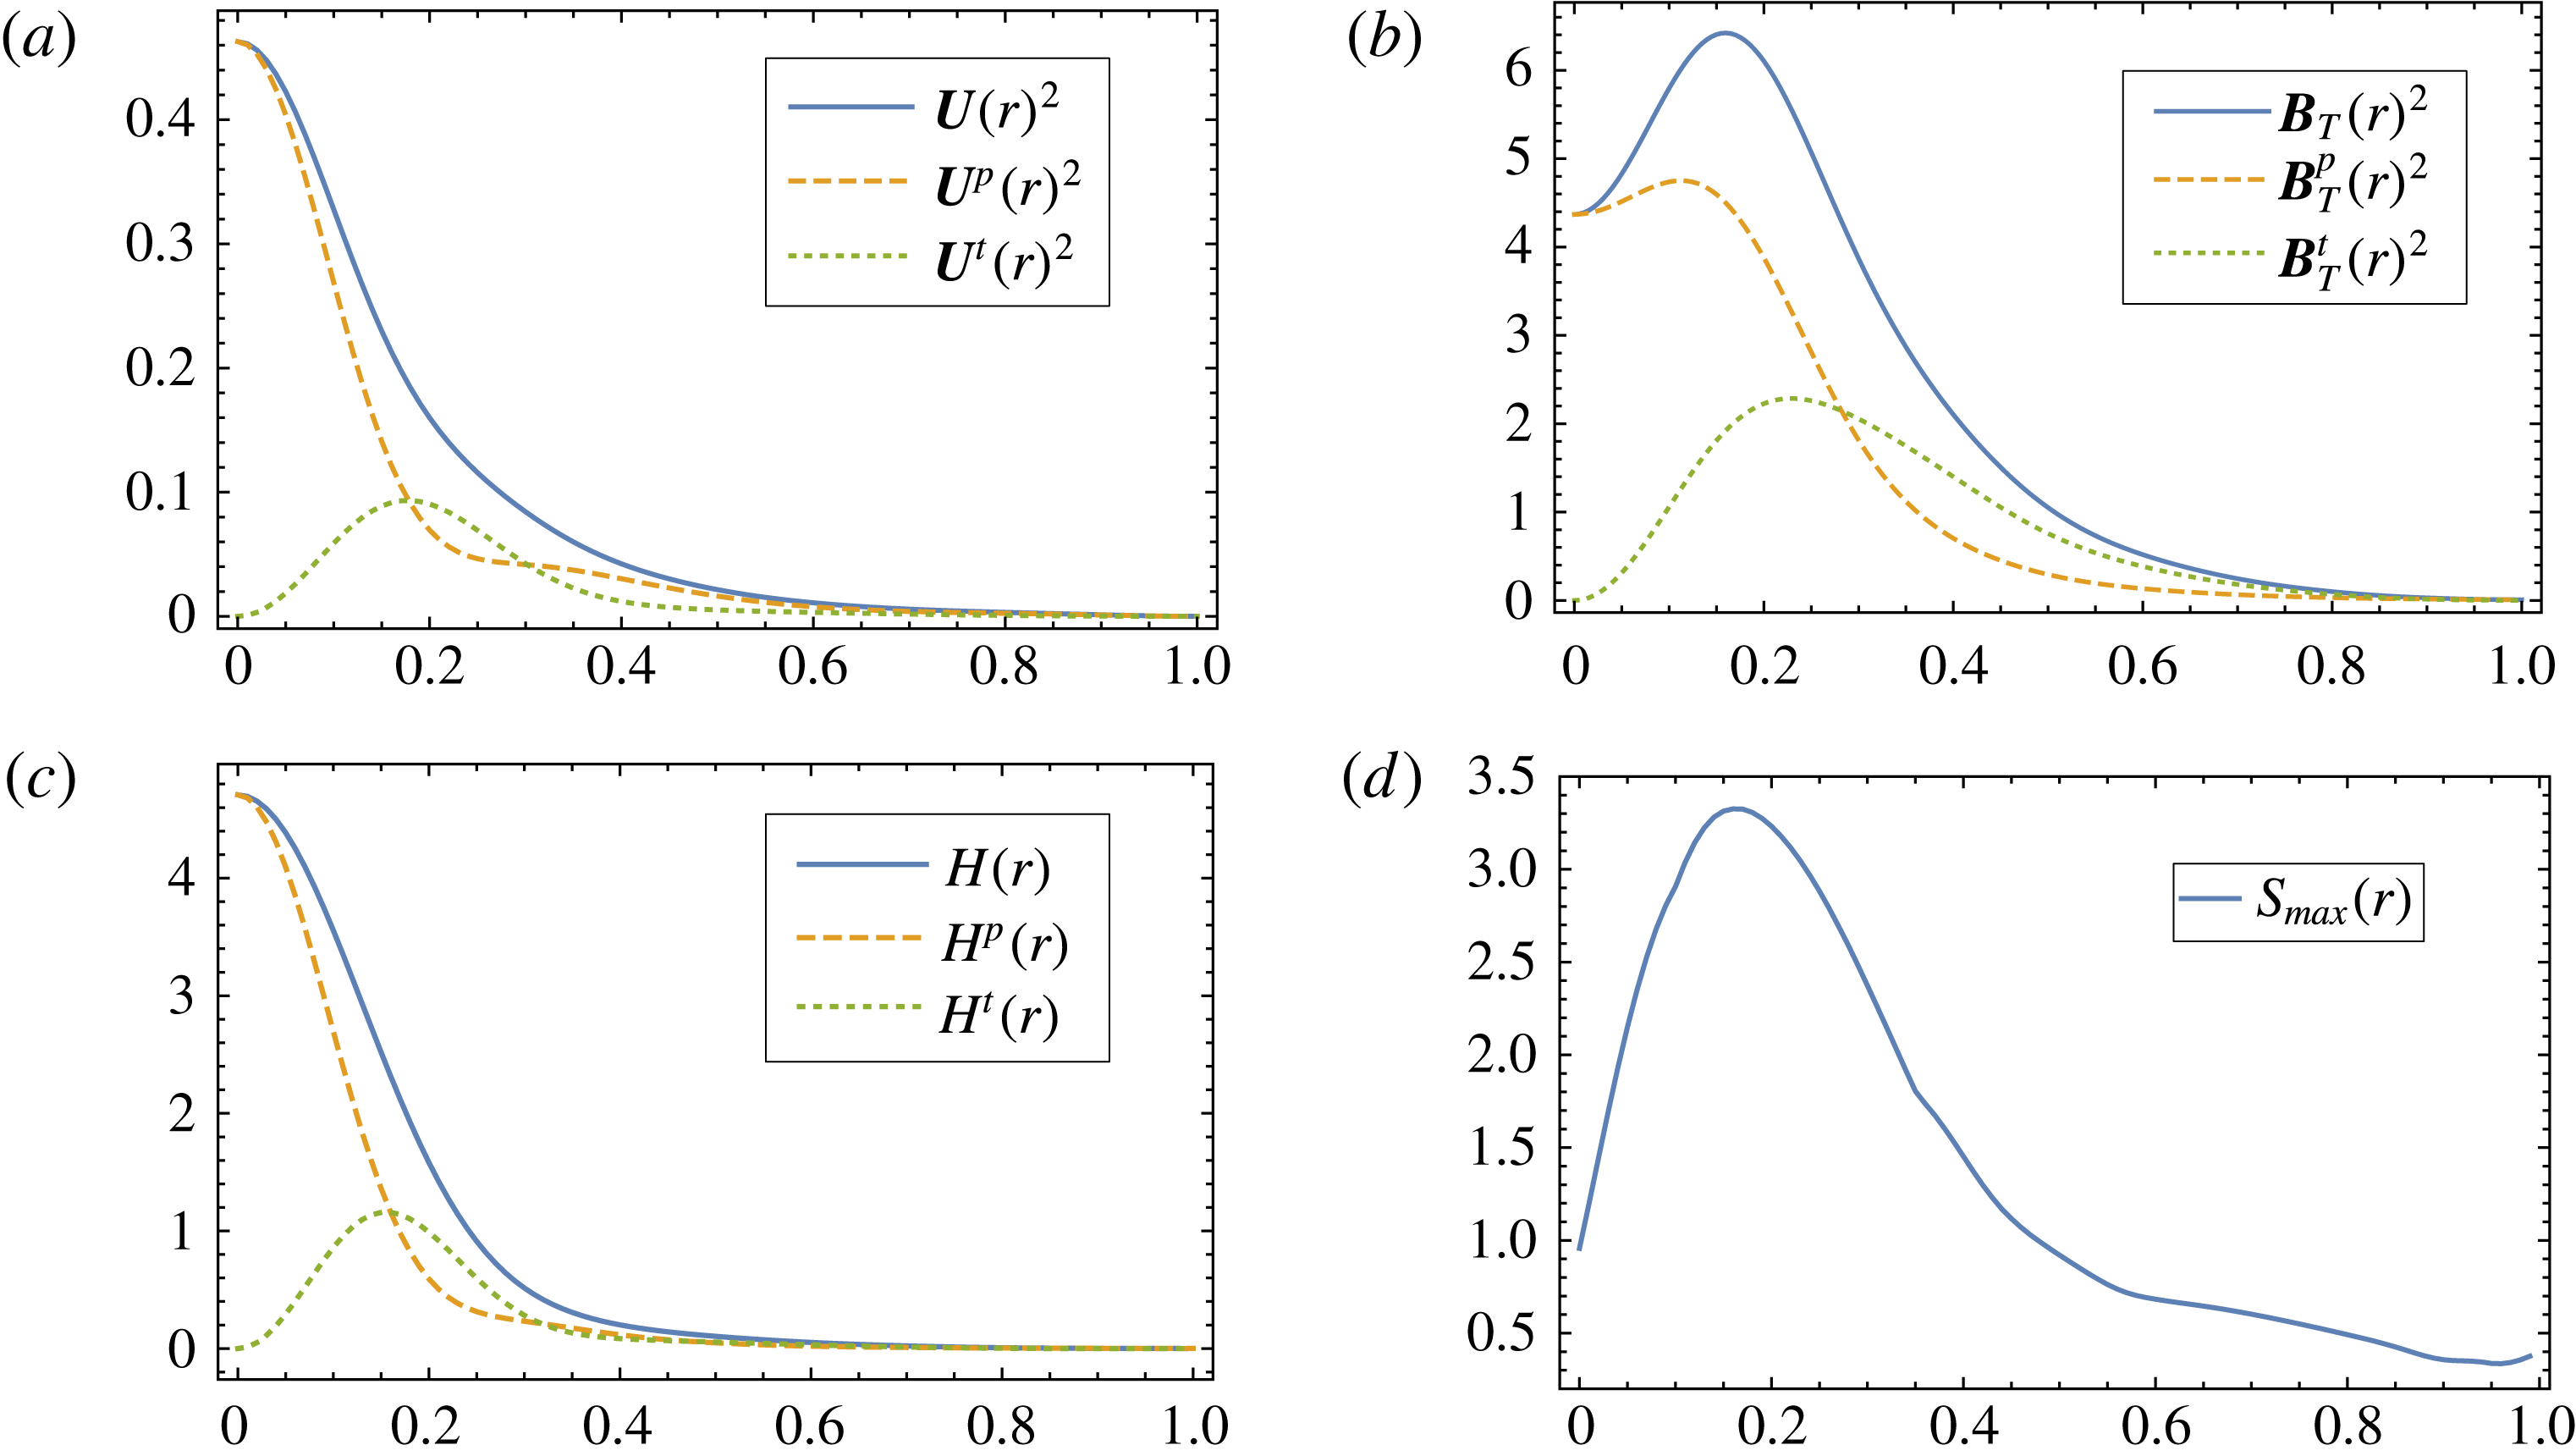
Besides looking directly at the optimal fields, we also want to understand what are the averaged spatial distributions. We introduce a radial distribution of kinetic energy,
 $$\begin{eqnarray}\displaystyle & \displaystyle U(r)^{2}=U^{t}(r)^{2}+U^{p}(r)^{2},\quad U^{\unicode[STIX]{x1D70C}}(r)^{2}=\frac{1}{4\unicode[STIX]{x03C0}}\int _{0}^{2\unicode[STIX]{x03C0}}\!\int _{0}^{\unicode[STIX]{x03C0}}(\boldsymbol{U}^{\unicode[STIX]{x1D70C}})^{2}\sin \unicode[STIX]{x1D703}\,\text{d}\unicode[STIX]{x1D703}\,\text{d}\unicode[STIX]{x1D719},\quad \unicode[STIX]{x1D70C}=t,p, & \displaystyle \nonumber\\ \displaystyle & & \displaystyle\end{eqnarray}$$
for the optimal flow
 $\boldsymbol{U}$
, toroidal part
 $\boldsymbol{U}^{t}$
and poloidal part
 $\boldsymbol{U}^{p}$
. Similarly, we define
 $B_{T}(r)^{2},~B_{T}^{t}(r)^{2}$
and
 $B_{T}^{p}(r)^{2}$
for the magnetic eigenvector. We also show the radial distribution of two important quantities: helicity and shear (measured by the absolute maximal strain rate). The toroidal part of the radially varying helicity is given by
 $$\begin{eqnarray}\displaystyle & \displaystyle H^{t}(r)=\frac{1}{4\unicode[STIX]{x03C0}}\int _{0}^{2\unicode[STIX]{x03C0}}\!\int _{0}^{\unicode[STIX]{x03C0}}\boldsymbol{U}^{t}\boldsymbol{\cdot }\unicode[STIX]{x1D735}\times \boldsymbol{U}^{p}\sin \unicode[STIX]{x1D703}\,\text{d}\unicode[STIX]{x1D703}\,\text{d}\unicode[STIX]{x1D719}. & \displaystyle\end{eqnarray}$$
Similarly,
 $H^{p}(r)$
measures the poloidal part. In total, the radial distribution of helicity is
 $H(r)=H^{t}(r)+H^{p}(r)$
. The radial profile of shear is given by
 $$\begin{eqnarray}\displaystyle & \displaystyle S_{max}(r)=\max _{\unicode[STIX]{x1D719}\in [0,2\unicode[STIX]{x03C0}],\,\unicode[STIX]{x1D703}\in [0,\unicode[STIX]{x03C0}]}~\big|\text{eig}(\unicode[STIX]{x1D735}\boldsymbol{U}+\unicode[STIX]{x1D735}\boldsymbol{U}^{\intercal })/2\big|. & \displaystyle\end{eqnarray}$$
The results are shown in figure 7(a–d). It is clear from figure 7(a) that the flow is concentrated in the centre; near the boundary the fluid is almost stagnant. Bullard & Gubbins (Reference Bullard and Gubbins1977) have shown that a stagnant conducting layer can reduce the magnetic energy loss by diffusion, thereby promoting dynamo action. Perhaps it is not a surprise to see this behaviour again in our model. The helicity distribution in figure 7(c) is no longer approximately proportional to the kinetic energy distribution in figure 7(a) for
 $r>0.1$
, again showing that the alignment of
 $\boldsymbol{U}$
and
 $\unicode[STIX]{x1D735}\times \boldsymbol{U}$
breaks down within a certain range of
 $r$
. We also observe that the magnetic energy in figure 7(b) almost follows the shear distribution in figure 7(d). This may at first seem to point to the Omega effect (Moffatt Reference Moffatt1983), although in our model the relation between shear and flow is more complex so there is no easy way to relate
 $\boldsymbol{U}$
and
 $\boldsymbol{B}_{T}$
through
 $S_{max}$
. For this reason, we cannot give a definite answer regarding the physics involved in the optimal dynamo. What we can say is that shear (as measured by the absolute maximal strain rate) plays an important role in amplifying the magnetic field.
Radial distributions of the optimal solution: (a) kinetic energy; (b) magnetic energy; (c) helicity; and (d) absolute maximal strain rate over all angles
 $\unicode[STIX]{x1D703},\unicode[STIX]{x1D719}$
.

3.3.2 Analysis in spectral space
In spectral space, we report global measures for
 $\boldsymbol{U}$
and
 $\boldsymbol{B}_{T}$
as functions of rotationally invariant spherical harmonic degree
 $l$
in table 2. We introduce the partial sums for the flow
 $\boldsymbol{U}$
as
 $$\begin{eqnarray}\displaystyle & \displaystyle \boldsymbol{U}_{l}=\mathop{\sum }_{m,n}\unicode[STIX]{x1D635}_{nml}\,\boldsymbol{U}_{nml}^{t}+\unicode[STIX]{x1D634}_{nml}\,\boldsymbol{U}_{nml}^{p}, & \displaystyle\end{eqnarray}$$
and similarly for
 ${\boldsymbol{B}_{T}}_{l}$
. We note that the
 $l=1$
and
 $l=3$
modes dominate the enstrophy, and
 $94\,\%$
of the enstrophy (squared value) comes from the first three spherical harmonic degrees. The dominant flow field with only these three degrees with
 $l_{max}=3$
has a critical magnetic Reynolds number
 $Rm_{c}=66.29$
when the non-dimensional root-mean enstrophy is rescaled to
 $1$
. This slight increase in the critical point indicates very little influence from higher spherical harmonic degrees in the optimal
 $\boldsymbol{U}$
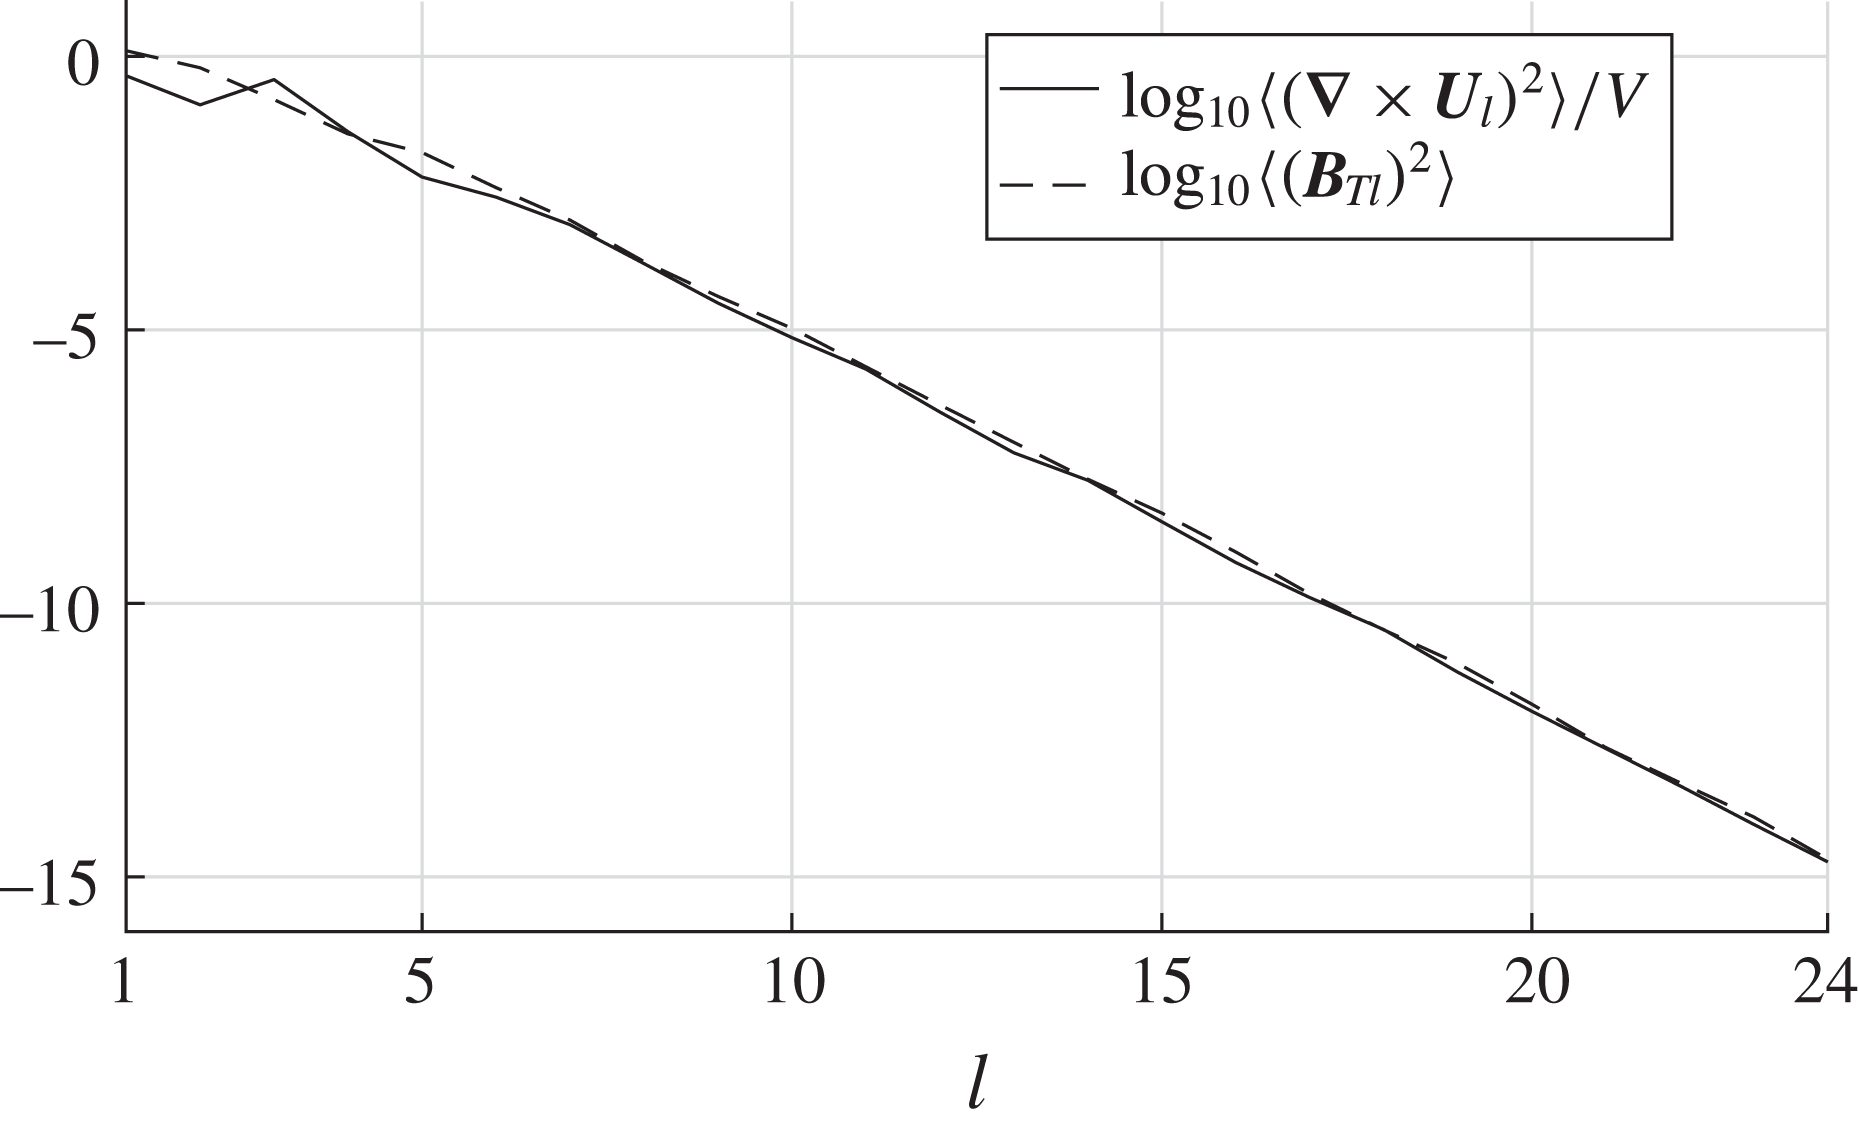
. We also note that the fields have low root-mean square (r.m.s.) velocities compared to the root-mean enstrophy. This indicates that we have strong shear in our optimal flow. In figure 8, we show power spectra of the optimal root-mean enstrophy and magnetic energy as functions of spherical harmonic degree
 $l$
at
 $Rm_{c,min}$
. Both models R1 and R2 give the same power spectra. They are rapidly decaying, which confirms that the spatial resolution we have used is sufficient.
Power spectra of the optimal enstrophy
 $\langle (\unicode[STIX]{x1D735}\times \boldsymbol{U}_{l})^{2}\rangle /V$
and the magnetic energy
 $\langle ({\boldsymbol{B}_{T}}_{l})^{2}\rangle$
as a function of the spherical harmonic degree
 $l$
.

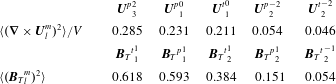
The partial enstrophy, kinetic energy and magnetic energy for the first five spherical harmonic degrees
 $l$
from models R1 and R2, both giving the same value up to three digits.

Alternatively, we can also analyse each spherical harmonic mode with index
 $l,m$
by summing over indices
 $n$
. We define the partial sums as
 $$\begin{eqnarray}\displaystyle & \displaystyle {\boldsymbol{U}^{t}}_{l}^{m}=\mathop{\sum }_{n}\unicode[STIX]{x1D635}_{nml}\boldsymbol{U}_{nml}^{t},\quad {\boldsymbol{U}^{p}}_{l}^{m}=\mathop{\sum }_{n}\unicode[STIX]{x1D634}_{nml}\boldsymbol{U}_{nml}^{p}. & \displaystyle\end{eqnarray}$$
Since the amplitude of each
 $m$
mode changes with rotation, we must fix an orientation for the optimal
 $\boldsymbol{U}$
. We rotate the field in spectral space using Wigner
 $D$
-matrices such that the rotational symmetry axis is along the
 $\hat{\boldsymbol{z}}$
direction and the sum of root-mean enstrophy of
 $\cos (m\unicode[STIX]{x1D719})$
modes is maximized. We impose a cut-off of absolute value
 $0.01$
for all spectral coefficients after rotation. The leading spherical harmonic modes are given in table 3. After a further reduction to keep only
 $l\leqslant 3$
, the critical magnetic Reynolds number becomes
 $66.34$
when the root-mean enstrophy is rescaled to
 $1$
, which shows that the reduced flow is a good approximation to the full optimum. Capturing
 $83\,\%$
of the enstrophy, the optimal flow can be approximated by five spherical harmonic modes:
 $$\begin{eqnarray}\displaystyle & \displaystyle \boldsymbol{U}\approx {\boldsymbol{U}^{t}}_{1}^{0}+{\boldsymbol{U}^{p}}_{1}^{0}+{\boldsymbol{U}^{t}}_{2}^{-2}+{\boldsymbol{U}^{p}}_{2}^{-2}+{\boldsymbol{U}^{p}}_{3}^{2}. & \displaystyle\end{eqnarray}$$
Positive
 $m$
corresponds to cosine modes and negative
 $m$
corresponds to sine modes. We see the dominant modes in (3.9) mostly describe large-scale structures. We also see here an even-
 $m$
symmetry for the optimal flow that matches with the spatial structures in figure 4(a). Owing to the selection rules of Bullard & Gellman (Reference Bullard and Gellman1954), the magnetic field can only have either all even-
 $m$
or all odd-
 $m$
modes when
 $\boldsymbol{U}$
has only even-
 $m$
modes. In this model, only the odd-
 $m$
modes of
 $\boldsymbol{B}_{T}$
are present.
Leading components of enstrophy for
 $\boldsymbol{U}_{l}^{m}$
and magnetic energy for
 ${\boldsymbol{B}_{T}}_{l}^{m}$
from model R1 after rotation and reduction. A summation over
 $n$
has been performed for the comparison.
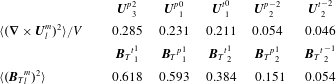
At the level of individual spherical harmonic modes, we notice from table 3 that the first spherical harmonic mode
 $(l,m)=(1,0)$
after rotation and reduction has approximately the same enstrophy for both poloidal and toroidal components. It turns out this mode has a normalized helicity
 $\widetilde{H_{1}^{0}}=0.95$
, where
 $$\begin{eqnarray}\displaystyle & \displaystyle \widetilde{H_{l}^{m}}=\langle \boldsymbol{U}_{l}^{m}\boldsymbol{\cdot }\unicode[STIX]{x1D735}\times \boldsymbol{U}_{l}^{m}\rangle \left/\sqrt{\langle {\boldsymbol{U}_{l}^{m}}^{2}\rangle \langle (\unicode[STIX]{x1D735}\times \boldsymbol{ U}_{l}^{m})^{2}\rangle }.\right. & \displaystyle\end{eqnarray}$$
This corresponds to the strong central flow we have shown in figures 4(a) and 6(a). Other secondary structures are weaker, so the overall normalized helicity for the optimal flow
 $\boldsymbol{U}$
is only
 ${\sim}0.65$
. Helicity is an important measure in fluid dynamics and its significance for dynamo action has been discussed in many places; for example, see the reviews by Moffatt (Reference Moffatt1983) and Gubbins (Reference Gubbins2008), as well as specific examples given by Livermore, Hughes & Tobias (Reference Livermore, Hughes and Tobias2007). While our optimal dynamo does have large helicity for some dominant components, helicity alone cannot explain all the optimal structures we have. We also find in table 3 that the equatorial dipole component of
 $\boldsymbol{B}_{T}$
is relatively large.
3.4 Perturbation study
In this section, we perform a perturbation study to verify the optimality of the growth rate at
 $Rm_{c,min}$
. A perturbed field
 $\boldsymbol{U}_{per}$
is the optimal field
 $\boldsymbol{U}$
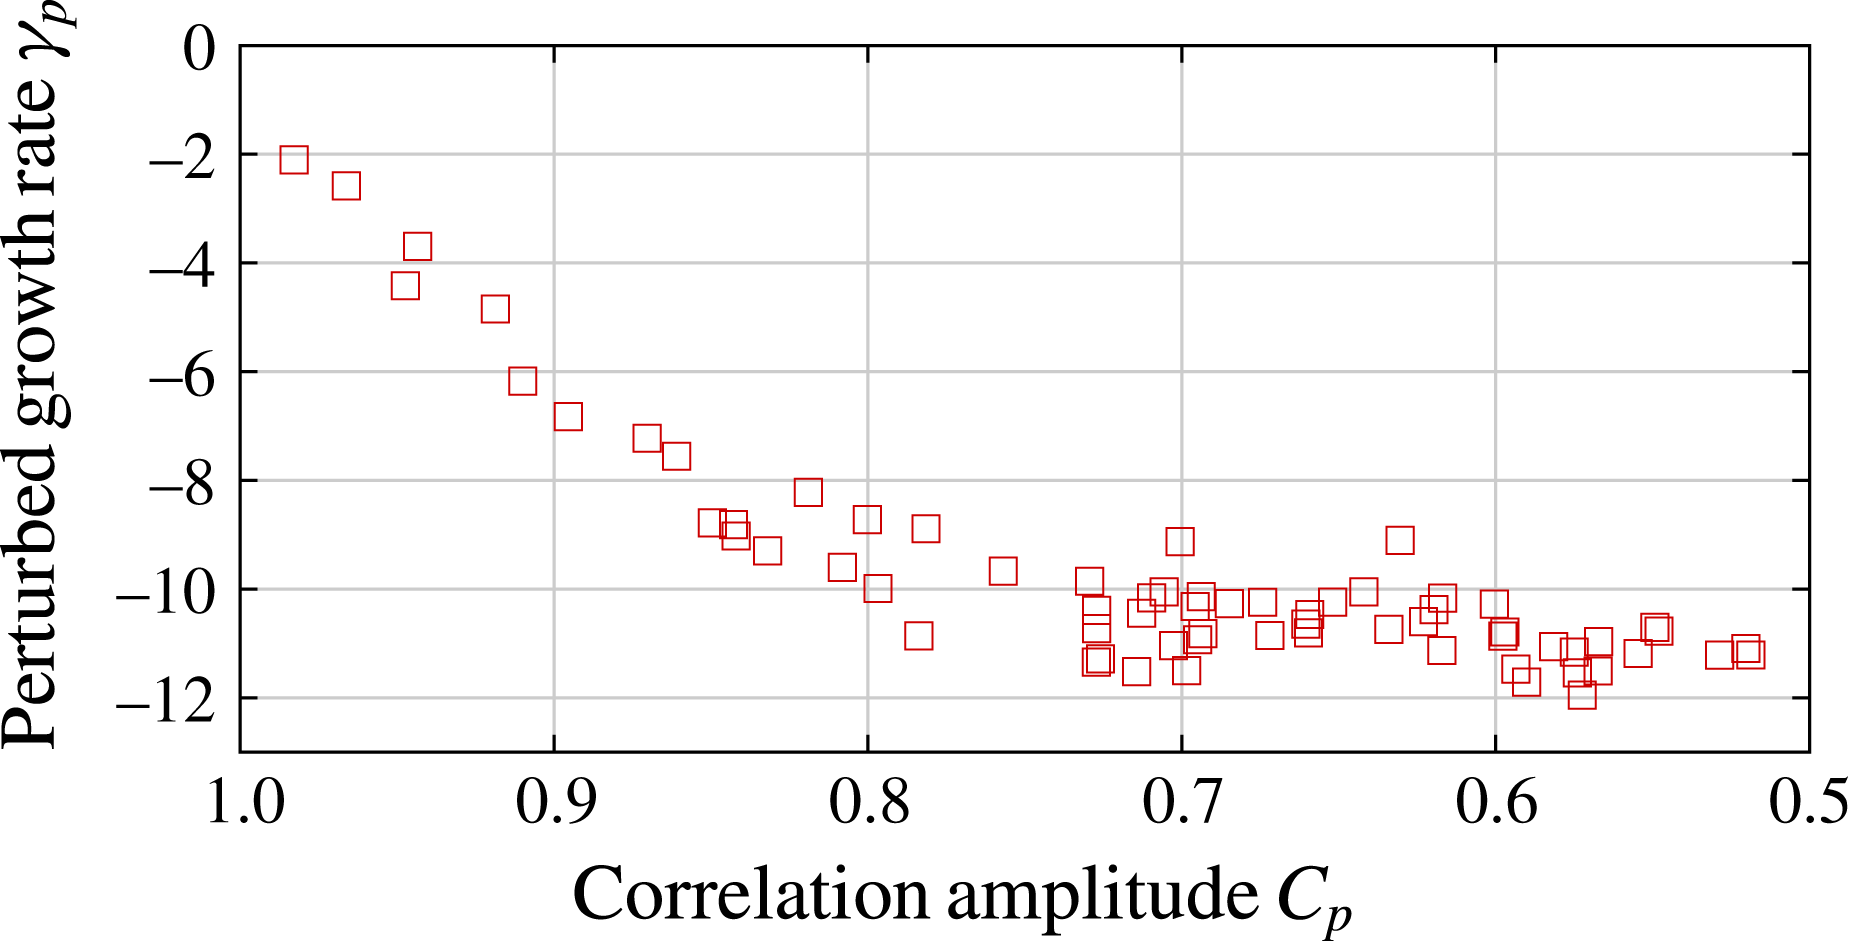
plus a small portion of a randomly generated flow field, subsequently rescaled to have a unit enstrophy. We define a correlation amplitude
 $$\begin{eqnarray}\displaystyle & \displaystyle C_{p}=\frac{\langle \boldsymbol{U}_{per}\boldsymbol{\cdot }\boldsymbol{U}\rangle }{\sqrt{\langle (\boldsymbol{U}_{per})^{2}\rangle \langle \boldsymbol{U}^{2}\rangle }} & \displaystyle\end{eqnarray}$$
similar to that in Chen et al. (Reference Chen, Herreman and Jackson2015) but only for the dominant modes
 $l\leqslant 3$
, then launch a forward run with
 $\boldsymbol{U}_{per}$
and measure the perturbed growth rate
 $\unicode[STIX]{x1D6FE}_{p}$
. The result of multiple random perturbations is shown in figure 9. The growth rate rapidly decreases as more perturbations are added to
 $\boldsymbol{U}$
, which indicates that random perturbations quickly reduce the flow’s optimality.
Perturbation study of the optimal flow
 $\boldsymbol{U}$
with
 $l\leqslant 3$
using model R1. The cross-correlation of the perturbed field and the optimal flow field is given by
 $C_{p}$
and the measured growth rate is
 $\unicode[STIX]{x1D6FE}_{p}$
. Each square represents an independent perturbation on
 $\boldsymbol{U}$
.

3.5 Transient growth
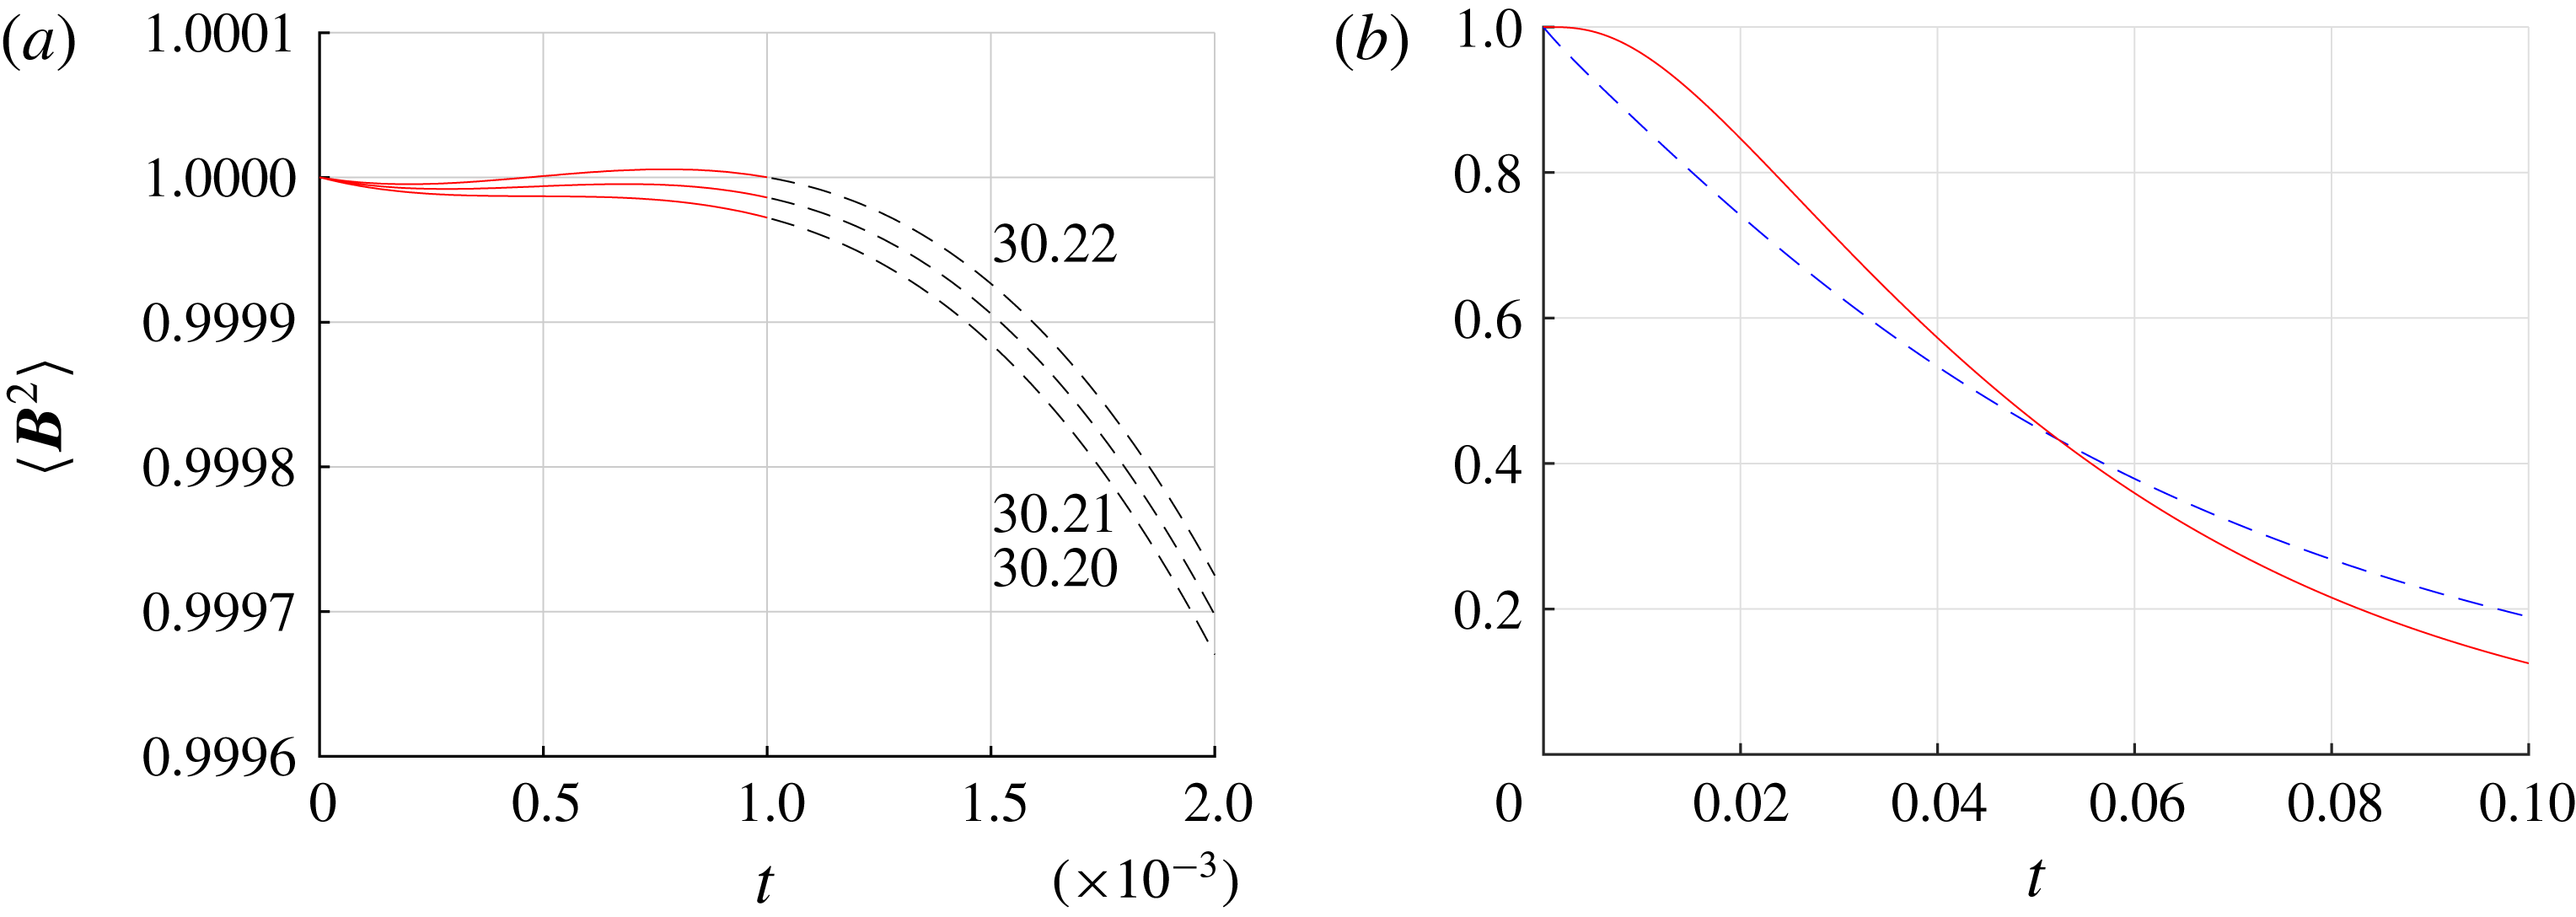
In dynamo models, a seed magnetic field can be transiently amplified by a conductive flow field for a short period even when it decays later (Livermore & Jackson Reference Livermore and Jackson2004, Reference Livermore and Jackson2006). This can clearly be seen in figure 3(a) for
 $t<0.15$
. Using our optimization method with very short optimizing time windows
 $T$
, we can maximize the transient growth and then measure the magnetic Reynolds number
 $Rm_{t,min}$
at which this maximum transient growth is zero. Numerically, using
 $T=0.001$
and
 $\unicode[STIX]{x0394}t=10^{-5}$
, we find the minimal transient magnetic Reynolds number
 $$\begin{eqnarray}\displaystyle & \displaystyle Rm_{t,min}=30.21 & \displaystyle\end{eqnarray}$$
(see figure 10
a). No flow
 $\boldsymbol{U}\in {\mathcal{E}}_{u}$
is able to admit magnetic solutions with
 $\text{d}\langle \boldsymbol{B}^{2}\rangle /\text{d}t\geqslant 0$
at
 $Rm<Rm_{t,min}$
. Furthermore, this lower bound
 $Rm_{t,min}$
also applies to any time-dependent flow in MHD models that can be approximated by a steady flow
 $\boldsymbol{U}\in {\mathcal{E}}_{u}$
at a given instant
 $t$
. Thus, the value of
 $Rm_{t,min}$
provides an important physical measure of the ultimate lower bound for sustaining magnetic energy. Compared with the optimal flow
 $\boldsymbol{U}$
found with
 $T=2$
in figure 10(b), we see that this magnetic field with maximized transient growth decays more rapidly at later times. This
 $Rm_{t,min}$
is
 $53\,\%$
below the optimal threshold
 $Rm_{c,min}$
for sustained dynamo action, which is quite different from that observed by Willis (Reference Willis2012) in the periodic cube. We also find that the corresponding optimal flow field
 $\boldsymbol{U}_{tr}$
at
 $Rm_{t,min}$
has equatorial reflectional symmetry.
The optimized transient growth. (a) Optimized magnetic energy growth for
 $Rm\in [30.20,30.22]$
with optimising time
 $T=0.001$
, resolution
 $(l_{max},n_{max})=(24,12)$
. (b) Comparison of optimized transient growth (red solid line) and R1 (blue dashed line) at the same
 $Rm_{t,min}=30.21$
.

3.6 Comparison with theoretical bounds
Our magnetic Reynolds number
 $Rm$
is not the most conventional in dynamo theory, but is the one that relates to the class of enstrophy normalized fields
 $\boldsymbol{U}\in {\mathcal{E}}_{u}$
. We can define two other magnetic Reynolds numbers using different scales for the flow field:
 $$\begin{eqnarray}\displaystyle & \displaystyle Rm_{u}=\frac{U^{\ast }L^{\ast }}{\unicode[STIX]{x1D702}^{\ast }},\quad Rm_{s}=\frac{S_{max}^{\ast }{L^{\ast }}^{2}}{\unicode[STIX]{x1D702}^{\ast }}, & \displaystyle\end{eqnarray}$$
where
 $U^{\ast }$
is the dimensional r.m.s. flow velocity, and
 ${S^{\ast }}_{max}$
is the dimensional absolute maximum strain rate. This allows us to convert the results from root-mean enstrophy or shear based
 $Rm$
to kinetic-energy-based (
 $Rm_{u}$
) and strain-rate-based (
 $Rm_{s}$
) magnetic Reynolds numbers:
 $$\begin{eqnarray}\displaystyle & \displaystyle Rm_{u}=\sqrt{\langle \boldsymbol{U}^{2}\rangle /V}\,Rm, & \displaystyle\end{eqnarray}$$
 $$\begin{eqnarray}\displaystyle & \displaystyle Rm_{s}=(\displaystyle \max _{{\mathcal{V}}}|\text{eig}(\unicode[STIX]{x1D735}\boldsymbol{U}+\unicode[STIX]{x1D735}\boldsymbol{U}^{\intercal })/2|)Rm=S_{max}Rm, & \displaystyle\end{eqnarray}$$
 $\boldsymbol{U}$
. Both models R1 and R2 give the same value. This yields
 $$\begin{eqnarray}\displaystyle & \displaystyle Rm_{u}=6.96,\quad Rm_{s}=215. & \displaystyle\end{eqnarray}$$
The value of
 $Rm_{u}$
is very low and close to the values
 ${\sim}12$
we have measured in the cube with unit sizes (Chen et al.
Reference Chen, Herreman and Jackson2015). According to Proctor (Reference Proctor2015), such a low value should be no real surprise since a theoretical lower bound on
 $Rm_{u}$
does not exist. We can further check how far we are above theoretical lower bounds using definitions other than
 $Rm_{u}$
. In particular, we choose three bounds to compare with; they are
 $$\begin{eqnarray}\displaystyle \left.\begin{array}{@{}c@{}}\text{(Backus 1958)}:\quad Rm_{s}>\unicode[STIX]{x03C0}^{2},\\ \text{(Proctor 1977)}:\quad Rm_{s}>12.29,\\ \text{(Childress 1969)}:\quad Rm\,\boldsymbol{U}_{max}>\unicode[STIX]{x03C0}.\end{array}\right\} & & \displaystyle\end{eqnarray}$$
The Backus/Proctor bounds use a strain-rate-based magnetic Reynolds number, and the Childress bound uses the maximum speed of the flow as a typical scale. Using our conventions, we find
 $Rm_{s}/12.29\approx 17$
and
 $Rm\,\boldsymbol{U}_{max}/\unicode[STIX]{x03C0}\approx 14$
, which are clearly above the theoretical limits. This can be attributed to the fact that theoretical bound calculations systematically overestimate the spatial extent of the magnetic fields (Herreman Reference Herreman2016).
Besides the bounds listed above, Proctor (Reference Proctor1979) derived a bound for dynamo action that is immediately applicable to our present results. He derived that
 $$\begin{eqnarray}\displaystyle & \displaystyle {\mathcal{D}}^{\ast }>\frac{\unicode[STIX]{x03C0}{\unicode[STIX]{x1D702}^{\ast }}^{2}}{4L^{\ast }} & \displaystyle\end{eqnarray}$$
for a sphere of radius
 $L^{\ast }$
, where
 ${\mathcal{D}}^{\ast }=\int \unicode[STIX]{x1D626}_{ij}^{\ast }\,\unicode[STIX]{x1D626}_{ij}^{\ast }\,\text{d}V^{\ast }$
is proportional to viscous dissipation and
 $\unicode[STIX]{x1D626}_{ij}^{\ast }$
is the dimensional strain-rate tensor. Translating this to our notation, we note that
 $$\begin{eqnarray}\displaystyle & \displaystyle 2{\mathcal{D}}^{\ast }={\textstyle \frac{4}{3}}\unicode[STIX]{x03C0}{L^{\ast }}^{3}{S^{\ast }}^{2}. & \displaystyle\end{eqnarray}$$
By dint of the no-slip conditions,
 $S^{\ast }=\unicode[STIX]{x1D714}^{\ast }$
, and we find immediately that
 $$\begin{eqnarray}\displaystyle & \displaystyle Rm=\frac{\unicode[STIX]{x1D714}^{\ast }{L^{\ast }}^{2}}{\unicode[STIX]{x1D702}^{\ast }}>\frac{\sqrt{6}}{2}\approx 0.61. & \displaystyle\end{eqnarray}$$
Clearly our dynamo operates well above this bound. Proctor speculated that the best lower bound might be 10 times larger than the one given here, and indeed we find that the best dynamo is operating at a value of
 $Rm$
over 100 times larger.
3.7 Comparison with other flows
In this section we compare several properties of our optimal flow to some selected models in the literature. We do not include self-consistent dynamos in a spherical shell here due to the complexity of these models (but note that in Christensen & Aubert (Reference Christensen and Aubert2006), the limit for dynamo action is
 $Rm_{u}\sim 60$
when the radius is used as the length scale, which is approximately eight times higher than our optimal dynamo). Instead, we focus on kinematic dynamos driven by two families of large-scale flows: the KR type inspired by Kumar & Roberts (Reference Kumar and Roberts1975), and the DJ type inspired by Dudley & James (Reference Dudley and James1989). The KR flow consists of three parts: differential rotation, meridional circulation and a simplified model for convection columns. The DJ flow has axisymmetric structures. The boundary conditions are not limited to no slip for these models. The precise definitions of the flows abbreviated as KR, GKR, STW, DJ
 $t_{1}s_{1}$
, DJ
 $t_{1}s_{2}$
, DJ
 $t_{2}s_{2}$
and MDJ
 $t_{1}s_{2}$
are given in appendix B. We could not include the optimized DJ flow by Holme (Reference Holme2003) in our comparison table due to the unknown explicit field representation.
A comparison of critical magnetic Reynolds numbers between our optimized flow (top row) and those reported in the literature (bottom section); the rescaling factor r.m.s.
 $(\cdots \,)$
is equivalent to
 $(\langle (\cdots \,)^{2}\rangle /V)^{1/2}$
; see (3.14), (3.20) and appendix B for more definitions.
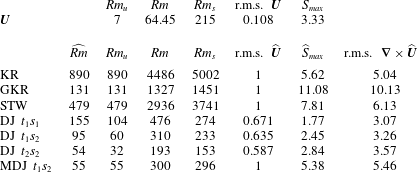
We first compare the critical magnetic Reynolds numbers for the onset of dynamo action. All the studies we compare with in spheres have used
 $L^{\ast }$
as the dimensional radius, but there is little homogeneity in what the scale for the flow field should be (e.g. maximal dimensional speed, r.m.s. dimensional speed). In order to compare critical magnetic Reynolds numbers of different dynamo studies, we need to rescale all results to a consistent definition. Denoting by
 $\widehat{\boldsymbol{U}}$
the originally reported flow field that was non-dimensionalized using a scale other than
 $[\boldsymbol{U}]=\unicode[STIX]{x1D714}^{\ast }L^{\ast }$
, we systematically convert
 $\widehat{Rm}$
to
 $Rm_{u}$
,
 $Rm$
and
 $Rm_{s}$
, respectively:
 $$\begin{eqnarray}\displaystyle Rm_{u}=\sqrt{\langle \widehat{\boldsymbol{U}}^{2}\rangle /V}\,\widehat{Rm},\quad Rm=\sqrt{\langle (\unicode[STIX]{x1D735}\times \widehat{\boldsymbol{U}})^{2}\rangle /V}\,\widehat{Rm}, & & \displaystyle\end{eqnarray}$$
 $$\begin{eqnarray}\displaystyle Rm_{s}=\left(\displaystyle \max _{{\mathcal{V}}}\big|\text{eig}(\unicode[STIX]{x1D735}\widehat{\boldsymbol{U}}+\unicode[STIX]{x1D735}\widehat{\boldsymbol{U}}^{\intercal })/2\big|\right)\widehat{Rm}=\widehat{S}_{max}\,\widehat{Rm}. & & \displaystyle\end{eqnarray}$$
The comparison of critical magnetic Reynolds numbers and the rescaling factors in (3.20) are shown in table 4. We see that our optimal flow
 $\boldsymbol{U}$
has improved the existing lower bound on the critical
 $Rm$
of DJ
 $t_{2}s_{2}$
by at least a factor of
 $3$
. The
 $Rm_{u}$
for our optimal flow
 $\boldsymbol{U}$
is also significantly lower than the others. The trade-off of this is that the maximal strain rate remains comparable to DJ flows (we compared
 $S_{max}$
and
 $\widehat{S}_{max}(\langle \widehat{\boldsymbol{U}}^{2}\rangle /V)^{1/2}$
). It is not yet clear how to reduce local shear and global shear at the same time. As for the transient growth, our ultimate lower bound
 $Rm_{t,min}=30.21$
is at least two times lower than the critical transient magnetic Reynolds number (
 $Rm_{t}$
) for selected flows from Livermore & Jackson (Reference Livermore and Jackson2004), shown in table 5.
The critical transient magnetic Reynolds number for the optimal transient flow
 $\boldsymbol{U}_{tr}$
and selected flows from Livermore & Jackson (Reference Livermore and Jackson2004), converted using
 $(\langle (\unicode[STIX]{x1D735}\times \widehat{\boldsymbol{U}})^{2}\rangle /V)^{1/2}$
as the rescaling factor.

Properties of the flow fields that can generate a dynamo (see appendix B for the definitions of the flows).
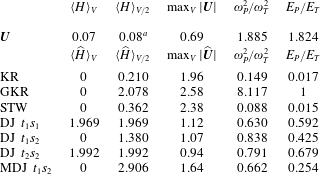
a
We choose the hemisphere with the larger value of helicity when the symmetry axis is aligned with the
 $\hat{\boldsymbol{z}}$
axis.
Additionally, we also compare important properties of the optimal flow such as helicity, energy ratio and maximum speed in table 6. We use the poloidal/toroidal kinetic energy and enstrophy given by
 $$\begin{eqnarray}\displaystyle & \displaystyle E_{P}/E_{T}=\langle (\boldsymbol{U}^{p})^{2}\rangle /\langle (\boldsymbol{U}^{t})^{2}\rangle ,\quad \unicode[STIX]{x1D714}_{P}^{2}/\unicode[STIX]{x1D714}_{T}^{2}=\langle (\unicode[STIX]{x1D6FB}\times \boldsymbol{U}^{p})^{2}\rangle /\langle (\unicode[STIX]{x1D735}\times \boldsymbol{U}^{t})^{2}\rangle , & \displaystyle\end{eqnarray}$$
where the superscripts
 $p$
and
 $t$
denote the poloidal and toroidal components of flow field, respectively. The choice of scale
 $[\boldsymbol{U}]$
does not influence the energy ratios, so we use the same notation for all models. The total helicity in the sphere and the hemispherical helicity for flows
 $\widehat{\boldsymbol{U}}$
are given by
 $$\begin{eqnarray}\displaystyle & \displaystyle \langle \widehat{H}\rangle _{V}=\frac{3}{4\unicode[STIX]{x03C0}}\langle \widehat{\boldsymbol{U}}\boldsymbol{\cdot }\unicode[STIX]{x1D6FB}\times \widehat{\boldsymbol{U}}\rangle ,\quad \langle \widehat{H}\rangle _{V/2}=\frac{3}{2\unicode[STIX]{x03C0}}\int _{0}^{1}\!\int _{0}^{2\unicode[STIX]{x03C0}}\!\int _{0}^{\unicode[STIX]{x03C0}/2}\widehat{\boldsymbol{U}}\boldsymbol{\cdot }\unicode[STIX]{x1D6FB}\times \widehat{\boldsymbol{U}}\,r^{2}\sin \unicode[STIX]{x1D703}\,\text{d}\unicode[STIX]{x1D703}\,\text{d}\unicode[STIX]{x1D719}\,\text{d}r. & \displaystyle \nonumber\\ \displaystyle & & \displaystyle\end{eqnarray}$$
We use the same formula without the hat symbol for the flow field that has been non-dimensionalized using scale
 $[\boldsymbol{U}]=\unicode[STIX]{x1D714}^{\ast }L^{\ast }$
. From table 6 it seems that there is no clear pattern in these measured values across different dynamo models. We observe that for our optimal flow the ratio of poloidal enstrophy to toroidal enstrophy is roughly the same as the ratio of poloidal kinetic energy to toroidal kinetic energy.
3.8 Comparison with the cubic model
It is of interest to compare our present results to our previous results in a cube (Chen et al.
Reference Chen, Herreman and Jackson2015). When mixed boundary conditions were used, the best dynamo had
 $Rm_{c,min}=7.5\unicode[STIX]{x03C0}^{2}$
, where the length scale was based on the length of the side of the cube. For the sphere the choice of a length scale is clear (it is the diameter), but for the cube there is no obvious analogous scale. If we just consider all chords passing through the centre of a unit cube, it is clear that the lengths
 $l$
vary as one moves from a chord perpendicular to two faces to one joining opposite corners, such that
 $l$
is bounded by
 $1\leqslant l\leqslant \sqrt{3}$
. There is probably no fully satisfactory way of defining the relevant length scale in a cube, but we can derive an objective choice. We let
 $E\{x\}$
denote the expected value of
 $x$
and consider all chords present in both the sphere and the cube. For the sphere of radius
 $L$
, it is clear that
 $E\{l^{2}\}=4L^{2}=(E\{l\})^{2}$
, whereas in the cube, we find
 $$\begin{eqnarray}E\{L^{2}\}=5/3,\end{eqnarray}$$
with the ancillary result (not needed) of
 $E\{L\}\approx 1.28$
. Using the value (3.23) for the length scale gives
 $Rm_{c,min}=123$
in the cube with mixed boundary conditions, whereas
 $Rm_{c,min}=197$
with homogeneous (either pseudo-vacuum or superconducting) boundary conditions. These compare to the values in the sphere we report here when converted using
 $E\{l^{2}\}=4L^{2}$
of
 $Rm_{c,min}=258$
for insulating boundary conditions.
A complementary way of comparing is to imagine that we are given a unit volume of electrically conducting fluid and consider the two possible geometrical arrangements at our disposal: a cube and a sphere. Obviously the size of the sphere (using radius
 $R$
) is
 $(4\unicode[STIX]{x03C0}/3)R^{3}=1$
, thus
 $R=(3/(4\unicode[STIX]{x03C0}))^{1/3}\approx 0.62$
. We choose a common length scale, which is unity for the cube, and for the sphere must be measured in these units. We previously referred our
 $Rm$
to the radius, but the present length scale inflates the length units by
 $(0.62)^{-1}$
. When we reinterpret our present value for
 $Rm$
on this length scale, we have a new value for
 $Rm$
of
 $64.45/0.62^{2}\approx 168$
, now above all the cubic results. Probably we have taken this analysis as far as is sensible, but we speculate that the extra roughness of the boundaries present in the cube might be responsible for additional shearing in the optimal flow that then appears to be a better dynamo.
4 Conclusions
In this study, we have found the optimal kinematic dynamo in a sphere with no-slip and insulating boundary conditions. The enstrophy-based minimal critical
 $Rm_{c,min}$
for the onset of a dynamo is
 $64.45$
. Compared to other known dynamo models, our optimal dynamo has lowered the critical
 $Rm$
at least by a factor of
 $3$
. The r.m.s. speed is much lower compared to the global shear magnitude or root-mean enstrophy in the system. The optimal flow field at
 $Rm_{c,min}$
has a rotational symmetry of order
 $2$
and a very concentrated helical structure near the centre. This indicates that a localized helix plus secondary twofold spirals are favourable for the onset of a kinematic dynamo in a sphere. The dominant spherical harmonic modes are
 $(l,|m|)=(1,0),(2,2),(3,2)$
, when the rotational symmetry axis is aligned with
 $\hat{\boldsymbol{z}}$
axis. The optimal flow structures near the boundary do not play a significant role. Therefore, we expect that the use of other boundary conditions for the flow, such as free-slip boundary conditions, will not lower
 $Rm_{c,min}$
by much. The magnetic field at the dynamo onset has mainly dipolar structures. With respect to the rotational symmetry axis of
 $\boldsymbol{U}$
, the fastest-growing magnetic field eigenmode has only odd-
 $m$
modes. We also find the minimal critical magnetic Reynolds number for transient growth
 $Rm_{t,min}=30.21$
, indicating that any time-dependent flows cannot lower the critical magnetic Reynolds number below
 $30.21$
.
Our optimization method is designed to identify the best dynamo, but it does not answer quantitatively the question: ‘Why are these flows so efficient in generating dynamos?’ Obtaining and analysing the optimal flow as we have done here is just a first step, while providing understanding of what makes them optimal physically is a much more relevant but rather difficult second step. In the supplementary material of this article, we have provided both the spectral coefficients and field values on grids for the optimal flow field and the associated magnetic eigenvector for possible follow-up studies. Since our polynomial basis is not standard, we also include a Mathematica file that allows one to generate the optimal flow in physical space and on arbitrarily fine grids.
We plan to extend this study in two parallel directions. One is to study how different boundary conditions on
 $\boldsymbol{U}$
and
 $\boldsymbol{B}$
affect the optimum, the other is to study the optimum within a restricted subclass of the present symmetry group
 $O(3)$
, e.g. to find the optimal kinematic dynamo generated by axisymmetric flows. It is also feasible to study the optimum within geophysically interesting classes of flows, such as Rossby waves or inertial waves.
Acknowledgements
This work was supported by the ETH Research Commission through grant ETH-08 13-2, for which we are grateful. Additional support by SNF grants 200020_143596 and 200021_163163 is acknowledged. We would like to thank Dr A. Willis and Professor M. Proctor for valuable discussions.
Supplementary materials
Supplementary materials are available at https://doi.org/10.1017/jfm.2017.924.
Appendix A. Orthonormal bases of toroidal/poloidal vector fields
In this section we give the definitions of our Galerkin bases and show how to project a vector field onto these bases.
A.1 The poloidal–toroidal expansions
The poloidal–toroidal decomposition for the flow field is
 $$\begin{eqnarray}\displaystyle \displaystyle \boldsymbol{U}^{t}(r,\unicode[STIX]{x1D703},\unicode[STIX]{x1D719}) & = & \displaystyle \mathop{\sum }_{l,m,n}\unicode[STIX]{x1D61B}_{nml}\left[\frac{1}{r\sin \unicode[STIX]{x1D703}}\,f_{n}^{l}(r)\frac{\unicode[STIX]{x2202}Y_{l}^{m}}{\unicode[STIX]{x2202}\unicode[STIX]{x1D719}}\hat{\unicode[STIX]{x1D73D}}-\frac{1}{r}\,f_{n}^{l}(r)\frac{\unicode[STIX]{x2202}Y_{l}^{m}}{\unicode[STIX]{x2202}\unicode[STIX]{x1D703}}\hat{\unicode[STIX]{x1D753}}\right],\end{eqnarray}$$
 $$\begin{eqnarray}\displaystyle \displaystyle \boldsymbol{U}^{p}(r,\unicode[STIX]{x1D703},\unicode[STIX]{x1D719}) & = & \displaystyle \mathop{\sum }_{l,m,n}\unicode[STIX]{x1D61A}_{nml}\left[\frac{l(l+1)}{r^{2}}g_{n}^{l}(r)Y_{l}^{m}\hat{\,}\boldsymbol{r}\right.\nonumber\\ \displaystyle & & \displaystyle +\left.\frac{1}{r}\frac{\unicode[STIX]{x2202}g_{n}^{l}(r)}{\unicode[STIX]{x2202}r}\frac{\unicode[STIX]{x2202}Y_{l}^{m}}{\unicode[STIX]{x2202}\unicode[STIX]{x1D703}}\hat{\unicode[STIX]{x1D73D}}+\frac{1}{r\sin \unicode[STIX]{x1D703}}\frac{\unicode[STIX]{x2202}g_{n}^{l}(r)}{\unicode[STIX]{x2202}r}\frac{\unicode[STIX]{x2202}Y_{l}^{m}}{\unicode[STIX]{x2202}\unicode[STIX]{x1D719}}\hat{\unicode[STIX]{x1D753}}\right],\end{eqnarray}$$
where
 $f_{n}^{l}$
and
 $g_{n}^{l}$
are radial functions and
 $Y_{l}^{m}$
are the spherical harmonics. The field decomposition for
 $\boldsymbol{B}$
follows similar definitions. There are in total
 $2n_{max}l_{max}(l_{max}+2)$
spectral coefficients for each vector field. For input and output, these coefficients are stored in memory as a one-dimensional array. In the optimization process, the memory is distributed to at least
 $l_{max}$
number of cores. In this model, we use fully normalized real spherical harmonics. The spherical harmonics are defined as
 $$\begin{eqnarray}\displaystyle Y_{l}^{m}(\unicode[STIX]{x1D703},\unicode[STIX]{x1D719})=N_{lm}\left\{\begin{array}{@{}l@{}}\cos (m\unicode[STIX]{x1D719})\widehat{P}_{l}^{m}(\cos \unicode[STIX]{x1D703}),\quad \text{if}~m\geqslant 0,\quad \\[3.0pt] \sin (|m|\unicode[STIX]{x1D719})\widehat{P}_{l}^{|m|}(\cos \unicode[STIX]{x1D703}),\quad \text{if}~m<0,\quad \end{array}\right. & & \displaystyle\end{eqnarray}$$
where
 $\widehat{P}_{l}^{m}(\cos \unicode[STIX]{x1D703})$
are the associated Legendre functions, defined as
 $$\begin{eqnarray}\displaystyle & \displaystyle \widehat{P}_{l}^{m}(x)=(-1)^{m}(1-x^{2})^{m/2}\frac{\text{d}^{m}}{\text{d}x^{m}}\tilde{P}_{n}(x), & \displaystyle\end{eqnarray}$$
where
 $\tilde{P}_{n}(x)$
is a Legendre polynomial of
 $x$
, and
 $$\begin{eqnarray}\displaystyle N_{lm}=\sqrt{\frac{(2-\unicode[STIX]{x1D6FF}_{0m})(2l+1)}{4\unicode[STIX]{x03C0}}\frac{(l-|m|)!}{(l+|m|)!}} & & \displaystyle\end{eqnarray}$$
is a normalization factor such that we have the orthonormality condition for the spherical harmonics:
 $$\begin{eqnarray}\displaystyle & \displaystyle \int _{0}^{2\unicode[STIX]{x03C0}}\!\int _{0}^{\unicode[STIX]{x03C0}}Y_{l}^{m}(\unicode[STIX]{x1D703},\unicode[STIX]{x1D719})Y_{\tilde{l}}^{\tilde{m}}(\unicode[STIX]{x1D703},\unicode[STIX]{x1D719})\sin \unicode[STIX]{x1D703}\,\text{d}\unicode[STIX]{x1D703}\,\text{d}\unicode[STIX]{x1D719}=\unicode[STIX]{x1D6FF}_{l\tilde{l}}\unicode[STIX]{x1D6FF}_{m\tilde{m}}. & \displaystyle\end{eqnarray}$$
The derivatives of spherical harmonics satisfy
 $$\begin{eqnarray}\displaystyle & \displaystyle \frac{\text{d}Y_{l}^{m}}{\text{d}\unicode[STIX]{x1D719}}=-mY_{l}^{-m},\quad \sin \unicode[STIX]{x1D703}\,\frac{\text{d}Y_{l}^{m}}{\text{d}\unicode[STIX]{x1D703}}=-(l+1)\hat{a}_{l}^{m}Y_{l-1}^{m}+l\hat{a}_{l+1}^{m}Y_{l+1}^{m}, & \displaystyle\end{eqnarray}$$
where
 $\hat{a}_{l}^{m}=\sqrt{(l+|m|)(l-|m|)/(2l+1)(2l-1)}$
. They are chosen in this way such that we have a simple formula for taking the derivatives; an alternative way would be to use only positive
 $m$
, but then we need to have separate expressions for sine and cosine functions.
A.2 Orthogonal Galerkin polynomials
The optimization scheme relies on a convenient choice of orthogonal polynomials. These polynomials are constructed by combining Jacobi polynomials into a Galerkin basis that satisfies the required boundary conditions using the techniques pioneered by Livermore (Reference Livermore2010) and Livermore & Ierley (Reference Livermore and Ierley2010). The key idea is that, by using a Gram–Schmidt procedure, a family of orthogonal Galerkin polynomials can be iteratively constructed. However, as these authors showed, it is possible to explicitly write down the structure of a Galerkin polynomial of arbitrary index as the terse sum of Jacobi polynomials. This allows us to deduce that asymptotically the recombined Jacobi polynomials have the same optimal properties as the Jacobi polynomials themselves. Using field expansions (A 1), the orthonormality conditions (2.36) in this model then require
 $$\begin{eqnarray}\displaystyle & \displaystyle \frac{3}{4\unicode[STIX]{x03C0}}\langle -\unicode[STIX]{x1D6FB}_{l}^{2}f_{n}^{l},f_{{\tilde{n}}}^{l}\rangle _{\boldsymbol{ t}}=\unicode[STIX]{x1D6FF}_{n{\tilde{n}}},\quad \frac{3}{4\unicode[STIX]{x03C0}}\langle -\unicode[STIX]{x1D6FB}_{l}^{2}g_{n}^{l},g_{{\tilde{n}}}^{l}\rangle _{\boldsymbol{ s}}=\unicode[STIX]{x1D6FF}_{n{\tilde{n}}}, & \displaystyle\end{eqnarray}$$
 $$\begin{eqnarray}\displaystyle & \displaystyle \langle h_{n}^{l},h_{{\tilde{n}}}^{l}\rangle _{\boldsymbol{t}}=\unicode[STIX]{x1D6FF}_{n{\tilde{n}}},\quad \langle k_{n}^{l},k_{{\tilde{n}}}^{l}\rangle _{\boldsymbol{s}}=\unicode[STIX]{x1D6FF}_{n{\tilde{n}}}, & \displaystyle\end{eqnarray}$$
for radial functions, where the radial inner products are defined as
 $$\begin{eqnarray}\displaystyle & \displaystyle \langle \unicode[STIX]{x1D6FC}_{n}^{l},\unicode[STIX]{x1D6FD}_{n}^{l}\rangle _{\boldsymbol{t}}=l(l+1)\int _{0}^{1}\unicode[STIX]{x1D6FC}_{n}^{l}\unicode[STIX]{x1D6FD}_{n}^{l}\,\text{d}r, & \displaystyle\end{eqnarray}$$
 $$\begin{eqnarray}\displaystyle & \displaystyle \langle \unicode[STIX]{x1D6FC}_{n}^{l},\unicode[STIX]{x1D6FD}_{n}^{l}\rangle _{\boldsymbol{s}}=l(l+1)\left[\int _{0}^{1}\left(\frac{l(l+1)}{r^{2}}\unicode[STIX]{x1D6FC}_{n}^{l}\unicode[STIX]{x1D6FD}_{n}^{l}+\frac{\unicode[STIX]{x2202}\unicode[STIX]{x1D6FC}_{n}^{l}}{\unicode[STIX]{x2202}r}\frac{\unicode[STIX]{x2202}\unicode[STIX]{x1D6FD}_{n}^{l}}{\unicode[STIX]{x2202}r}\right)\text{d}r+l\unicode[STIX]{x1D6FC}_{n}^{l}(1)\unicode[STIX]{x1D6FD}_{n}^{l}(1)\right], & \displaystyle\end{eqnarray}$$
and
 $\unicode[STIX]{x1D6FB}_{l}^{2}=\unicode[STIX]{x2202}^{2}/\unicode[STIX]{x2202}r^{2}-l(l+1)/r^{2}$
and the last term in (A 11) derives from the fact that the inner product of a magnetic field is defined over all space; it handles the vacuum contribution from the poloidal magnetic field. For simplicity, we use the same notation for the poloidal flow field under the condition
 $g_{n}^{l}(1)=0$
.
A.3 Projection of nonlinear terms and the diffusion term
To solve the induction equation forward in time, we need to project the induction term onto the basis of
 $\boldsymbol{B}$
:
 $$\begin{eqnarray}\displaystyle \langle \boldsymbol{B}_{nml}^{t}\boldsymbol{\cdot }[\unicode[STIX]{x1D735}\times (\boldsymbol{U}\times \boldsymbol{B})]\rangle & = & \displaystyle \langle (\unicode[STIX]{x1D735}\times \boldsymbol{B}_{nml}^{t})\boldsymbol{\cdot }(\boldsymbol{U}\times \boldsymbol{B})\rangle +\underbrace{\langle \unicode[STIX]{x1D735}\boldsymbol{\cdot }[\boldsymbol{B}_{nml}^{t}\times (\boldsymbol{U}\times \boldsymbol{B})]\rangle }_{=0},\nonumber\\ \displaystyle & = & \displaystyle l(l+1)\int _{0}^{1}h_{n}^{l}\left(\iint [\boldsymbol{U}\times \boldsymbol{B}]_{r}\,Y_{l}^{m}\sin \unicode[STIX]{x1D703}\,\text{d}\unicode[STIX]{x1D703}\,\text{d}\unicode[STIX]{x1D719}\right)\text{d}r\nonumber\\ \displaystyle & & \displaystyle +\,\int _{0}^{1}\frac{\text{d}h_{n}^{l}}{\text{d}r}\left\{\iint \left[\frac{r[\boldsymbol{U}\times \boldsymbol{B}]_{\unicode[STIX]{x1D703}}}{\sin \unicode[STIX]{x1D703}}\left(\sin \unicode[STIX]{x1D703}\,\frac{\text{d}Y_{l}^{m}}{\text{d}\unicode[STIX]{x1D703}}\right)\right.\right.\nonumber\\ \displaystyle & & \displaystyle +\,\left.\left.\frac{r[\boldsymbol{U}\times \boldsymbol{B}]_{\unicode[STIX]{x1D719}}}{\sin \unicode[STIX]{x1D703}}\,\frac{\text{d}Y_{l}^{m}}{\text{d}\unicode[STIX]{x1D719}}\right]\sin \unicode[STIX]{x1D703}\,\text{d}\unicode[STIX]{x1D703}\,\text{d}\unicode[STIX]{x1D719}\right\}\text{d}r,\end{eqnarray}$$
 $$\begin{eqnarray}\displaystyle \langle \boldsymbol{B}_{nml}^{p}\boldsymbol{\cdot }[\unicode[STIX]{x1D735}\times (\boldsymbol{U}\times \boldsymbol{B})]\rangle & = & \displaystyle \langle (\unicode[STIX]{x1D735}\times \boldsymbol{B}_{nml}^{p})\boldsymbol{\cdot }(\boldsymbol{U}\times \boldsymbol{B})\rangle +\underbrace{\langle \unicode[STIX]{x1D735}\boldsymbol{\cdot }[\boldsymbol{B}_{nml}^{p}\times (\boldsymbol{U}\times \boldsymbol{B})]\rangle }_{=0},\nonumber\\ \displaystyle & = & \displaystyle \int _{0}^{1}-\unicode[STIX]{x1D6FB}_{l}^{2}k_{n}^{l}\left\{\iint \left[\frac{r[\boldsymbol{U}\times \boldsymbol{B}]_{\unicode[STIX]{x1D703}}}{\sin \unicode[STIX]{x1D703}}\,\frac{\text{d}Y_{l}^{m}}{\text{d}\unicode[STIX]{x1D719}}\right.\right.\nonumber\\ \displaystyle & & \displaystyle -\,\left.\left.\frac{r[\boldsymbol{U}\times \boldsymbol{B}]_{\unicode[STIX]{x1D719}}}{\sin \unicode[STIX]{x1D703}}\left(\sin \unicode[STIX]{x1D703}\,\frac{\text{d}Y_{l}^{m}}{\text{d}\unicode[STIX]{x1D703}}\right)\right]\sin \unicode[STIX]{x1D703}\,\text{d}\unicode[STIX]{x1D703}\,\text{d}\unicode[STIX]{x1D719}\right\}\text{d}r.\end{eqnarray}$$
The cross-product
 $$\begin{eqnarray}\displaystyle & \displaystyle F_{r}=[\boldsymbol{U}\times \boldsymbol{B}]_{r},\quad F_{\unicode[STIX]{x1D703},\unicode[STIX]{x1D719}}=\frac{r}{\sin \unicode[STIX]{x1D703}}[\boldsymbol{U}\times \boldsymbol{B}]_{\unicode[STIX]{x1D703},\unicode[STIX]{x1D719}}, & \displaystyle\end{eqnarray}$$
is evaluated on the grid points. This transformation from spectral space to physical space uses an inverse Fourier transform in
 $\unicode[STIX]{x1D719}$
and a matrix multiplication transform (MMT) in
 $r$
and
 $\unicode[STIX]{x1D703}$
. The MMT requires us to store grid values of each radial expansion function and each associated Legendre function in memory. Along
 $r$
and
 $\unicode[STIX]{x1D703}$
, we use
 $N_{r}$
and
 $N_{\unicode[STIX]{x1D703}}$
Gaussian quadrature points and along
 $\unicode[STIX]{x1D719}$
we use
 $N_{\unicode[STIX]{x1D719}}$
Fourier grid points. The numbers of spatial grid points for resolution
 $(l_{max},n_{max})$
are
 $$\begin{eqnarray}\displaystyle \left.\begin{array}{@{}c@{}}N_{r}=\left\lceil {\displaystyle \frac{3(2n_{max}+l_{max}+6)+1}{4}}\right\rceil ,\quad N_{\unicode[STIX]{x1D703}}={\displaystyle \frac{3(l_{max}+2)}{2}}+\hspace{0.2em}{\rm mod}\hspace{0.2em}\left({\displaystyle \frac{3(l_{max}+2)}{2}},2\right),\\[8.0pt] N_{\unicode[STIX]{x1D719}}=4(l_{max}+2)+\hspace{0.2em}{\rm mod}\hspace{0.2em}\left(4(l_{max}+2),4\right),\end{array}\right\} & & \displaystyle \nonumber\\ \displaystyle & & \displaystyle\end{eqnarray}$$
where
 $\lceil \cdots \!\rceil$
is the ceiling function. We then calculate their projection on the spherical harmonic basis:
 $$\begin{eqnarray}\displaystyle & \displaystyle [F_{\unicode[STIX]{x1D707}}]_{l}^{m}(r,l,m)= & \displaystyle \iint F_{\unicode[STIX]{x1D707}}(r,\unicode[STIX]{x1D703},\unicode[STIX]{x1D719})\,Y_{l}^{m}(\unicode[STIX]{x1D703},\unicode[STIX]{x1D719})\sin \unicode[STIX]{x1D703}\,\text{d}\unicode[STIX]{x1D703}\,\text{d}\unicode[STIX]{x1D719},\quad \unicode[STIX]{x1D707}=r,\unicode[STIX]{x1D703},\unicode[STIX]{x1D719}.\end{eqnarray}$$
Finally, we extract the spectral coefficients by an integration along the radial direction. For the poloidal components,
 $$\begin{eqnarray}\displaystyle & & \displaystyle \left\langle -\unicode[STIX]{x1D6FB}_{l}^{2}k_{n}^{l},\frac{\hat{a}_{l}^{m}}{l}[F_{\unicode[STIX]{x1D719}}]_{l-1}^{m}-\frac{\hat{a}_{l+1}^{m}}{l+1}[F_{\unicode[STIX]{x1D719}}]_{l+1}^{m}-\frac{m}{l(l+1)}[F_{\unicode[STIX]{x1D703}}]_{l}^{-m}\right\rangle _{\boldsymbol{t}}\nonumber\\ \displaystyle & & \displaystyle =\left\langle k_{n}^{l},\frac{\hat{a}_{l}^{m}}{l}[F_{\unicode[STIX]{x1D719}}]_{l-1}^{m}-\frac{\hat{a}_{l+1}^{m}}{l+1}[F_{\unicode[STIX]{x1D719}}]_{l+1}^{m}-\frac{m}{l(l+1)}[F_{\unicode[STIX]{x1D703}}]_{l}^{-m}\right\rangle _{\boldsymbol{s}}.\end{eqnarray}$$
We have used partial integration, no-slip and electrically insulating boundary conditions to derive (A 17). For the toroidal components,
 $$\begin{eqnarray}\displaystyle & & \displaystyle \langle h_{n}^{l},[F_{r}]_{l}^{m}\rangle _{t}+\left\langle \frac{\unicode[STIX]{x2202}h_{n}^{l}}{\unicode[STIX]{x2202}r},-\frac{\hat{a}_{l}^{m}}{l}[F_{\unicode[STIX]{x1D703}}]_{l-1}^{m}(r)+\frac{\hat{a}_{l+1}^{m}}{l+1}[F_{\unicode[STIX]{x1D703}}]_{l+1}^{m}-\frac{m}{l(l+1)}[F_{\unicode[STIX]{x1D719}}]_{l}^{-m}\right\rangle _{\boldsymbol{t}}\nonumber\\ \displaystyle & & \displaystyle =\left\langle h_{n}^{l},[F_{r}]_{l}^{m}+\frac{\text{d}}{\text{d}r}\left(\frac{\hat{a}_{l}^{m}}{l}[F_{\unicode[STIX]{x1D703}}]_{l-1}^{m}(r)-\frac{\hat{a}_{l+1}^{m}}{l+1}[F_{\unicode[STIX]{x1D703}}]_{l+1}^{m}+\frac{m}{l(l+1)}[F_{\unicode[STIX]{x1D719}}]_{l}^{-m}\right)\right\rangle _{\boldsymbol{t}}.\qquad\end{eqnarray}$$
The diffusion does not involve nonlinear terms and can be directly calculated in spectral space. This operation is represented by diffusion matrices given by
 $$\begin{eqnarray}\displaystyle & \displaystyle \mathbb{T}_{nn^{\prime }}^{l}=\langle \boldsymbol{B}_{nml}^{t},\unicode[STIX]{x1D6FB}^{2}\boldsymbol{B}_{n^{\prime }ml}^{t}\rangle =\langle h_{n}^{l},\unicode[STIX]{x1D6FB}_{l}^{2}h_{n^{\prime }}^{l}\rangle _{\boldsymbol{t}}, & \displaystyle\end{eqnarray}$$
 $$\begin{eqnarray}\displaystyle & \displaystyle \mathbb{P}_{nn^{\prime }}^{l}=\langle \boldsymbol{B}_{nml}^{p},\unicode[STIX]{x1D6FB}^{2}\boldsymbol{B}_{n^{\prime }ml}^{p}\rangle =\langle k_{n}^{l},\unicode[STIX]{x1D6FB}_{l}^{2}k_{n^{\prime }}^{l}\rangle _{\boldsymbol{s}}. & \displaystyle\end{eqnarray}$$
For the backward time integration of the adjoint problem, the adjoint induction term needs to be projected onto the basis of
 $\boldsymbol{B}$
. In practice, we evaluate
 $\unicode[STIX]{x1D735}\times \boldsymbol{B}^{\dagger }$
directly on the physical grids using an inverse Fourier transform along
 $\unicode[STIX]{x1D719}$
and MMT along
 $r$
and
 $\unicode[STIX]{x1D703}$
. We then calculate the terms
 $$\begin{eqnarray}\displaystyle & \displaystyle H_{r}=[\boldsymbol{U}\times (\unicode[STIX]{x1D735}\times \boldsymbol{B}^{\dagger })]_{r},\quad H_{\unicode[STIX]{x1D703},\unicode[STIX]{x1D719}}=\frac{r}{\sin \unicode[STIX]{x1D703}}[\boldsymbol{U}\times (\unicode[STIX]{x1D735}\times \boldsymbol{B}^{\dagger })]_{\unicode[STIX]{x1D703},\unicode[STIX]{x1D719}}, & \displaystyle\end{eqnarray}$$
on the grid points and project onto
 $(r,l,m)$
space to get
 $[H_{\unicode[STIX]{x1D707}}]_{l}^{m}(r,l,m)$
as defined in (A 16) using a Fourier transform and MMT. Using the recurrence rules of the spherical harmonics, we get
 $$\begin{eqnarray}\displaystyle & & \displaystyle \langle \boldsymbol{B}_{nml}^{t}\boldsymbol{\cdot }[\boldsymbol{U}\times (\unicode[STIX]{x1D735}\times \boldsymbol{B}^{\dagger })]\rangle =\int _{0}^{1}h_{n}^{l}\left\{\iint \left[\frac{r[\boldsymbol{U}\times (\unicode[STIX]{x1D735}\times \boldsymbol{B}^{\dagger })]_{\unicode[STIX]{x1D703}}}{\sin \unicode[STIX]{x1D703}}\frac{\text{d}Y_{l}^{m}}{\text{d}\unicode[STIX]{x1D719}}\right.\right.\nonumber\\ \displaystyle & & \displaystyle -\left.\left.\frac{r[\boldsymbol{U}\times (\unicode[STIX]{x1D735}\times \boldsymbol{B}^{\dagger })]_{\unicode[STIX]{x1D719}}}{\sin \unicode[STIX]{x1D703}}\left(\sin \unicode[STIX]{x1D703}\,\frac{\text{d}Y_{l}^{m}}{\text{d}\unicode[STIX]{x1D703}}\right)\right]\sin \unicode[STIX]{x1D703}\,\text{d}\unicode[STIX]{x1D703}\,\text{d}\unicode[STIX]{x1D719}\right\}\text{d}r,\nonumber\\ \displaystyle & & \displaystyle =\left\langle h_{n}^{l},\frac{\hat{a}_{l}^{m}}{l}[H_{\unicode[STIX]{x1D719}}]_{l-1}^{m}-\frac{\hat{a}_{l+1}^{m}}{l+1}[H_{\unicode[STIX]{x1D719}}]_{l+1}^{m}+\frac{m}{l(l+1)}[H_{\unicode[STIX]{x1D703}}]_{l}^{-m}\right\rangle _{\boldsymbol{t}},\end{eqnarray}$$
 $$\begin{eqnarray}\displaystyle & & \displaystyle \langle \boldsymbol{B}_{nml}^{p}\boldsymbol{\cdot }[\boldsymbol{U}\times (\unicode[STIX]{x1D735}\times \boldsymbol{B}^{\dagger })]\rangle =l(l+1)\int _{0}^{1}k_{n}^{l}\left(\iint [\boldsymbol{U}\times (\unicode[STIX]{x1D735}\times \boldsymbol{B}^{\dagger })]_{r}\,Y_{l}^{m}\sin \unicode[STIX]{x1D703}\,\text{d}\unicode[STIX]{x1D703}\,\text{d}\unicode[STIX]{x1D719}\right)\text{d}r\nonumber\\ \displaystyle & & \displaystyle +\,\int _{0}^{1}\frac{\text{d}k_{n}^{l}}{\text{d}r}\left\{\iint \left[\frac{r[\boldsymbol{U}\times (\unicode[STIX]{x1D735}\times \boldsymbol{B}^{\dagger })]_{\unicode[STIX]{x1D703}}}{\sin \unicode[STIX]{x1D703}}\left(\sin \unicode[STIX]{x1D703}\,\frac{\text{d}Y_{l}^{m}}{\text{d}\unicode[STIX]{x1D703}}\right)\right.\right.\nonumber\\ \displaystyle & & \displaystyle +\,\left.\left.\frac{r[\boldsymbol{U}\times (\unicode[STIX]{x1D735}\times \boldsymbol{B}^{\dagger })]_{\unicode[STIX]{x1D719}}}{\sin \unicode[STIX]{x1D703}}\frac{\text{d}Y_{l}^{m}}{\text{d}\unicode[STIX]{x1D719}}\right]\sin \unicode[STIX]{x1D703}\,\text{d}\unicode[STIX]{x1D703}\,\text{d}\unicode[STIX]{x1D719}\right\}\text{d}r\nonumber\\ \displaystyle & & \displaystyle =\left\langle k_{n}^{l},[H_{r}]_{l}^{m}+\frac{\text{d}}{\text{d}r}\left(\frac{\hat{a}_{l}^{m}}{l}[H_{\unicode[STIX]{x1D703}}]_{l-1}^{m}-\frac{\hat{a}_{l+1}^{m}}{l+1}[H_{\unicode[STIX]{x1D703}}]_{l+1}^{m}+\frac{m}{l(l+1)}[H_{\unicode[STIX]{x1D719}}]_{l}^{-m}\right)\right\rangle _{\boldsymbol{t}},\end{eqnarray}$$
which we can evaluate using the Gaussian quadrature rule.
In the velocity field update, we need to calculate the integral term
 $\mathscr{I}_{nml}^{t}(t_{i})$
at each discrete time
 $t_{i}$
. This projection is structurally similar to the ones we have in the adjoint induction term, so we follow almost the same method. Letting
 $\boldsymbol{B}_{t_{i}}=\boldsymbol{B}(\boldsymbol{x},t_{i})$
, we calculate
 $$\begin{eqnarray}\displaystyle & \displaystyle G_{r}^{i}=[\boldsymbol{B}_{t_{i}}\times (\unicode[STIX]{x1D735}\times \boldsymbol{B}_{t_{i}}^{\dagger })]_{r},\quad G_{\unicode[STIX]{x1D703},\unicode[STIX]{x1D719}}^{i}=\frac{r}{\sin \unicode[STIX]{x1D703}}[\boldsymbol{B}_{t_{i}}\times (\unicode[STIX]{x1D735}\times \boldsymbol{B}_{t_{i}}^{\dagger })]_{\unicode[STIX]{x1D703},\unicode[STIX]{x1D719}}, & \displaystyle\end{eqnarray}$$
on grid points, then project it onto
 $(r,l,m)$
space as
 $[G_{\unicode[STIX]{x1D707}}]_{l}^{m}(r,l,m)$
. Finally we evaluate
 $$\begin{eqnarray}\displaystyle & \displaystyle \mathscr{I}_{nml}^{t}(t_{i})=\left\langle f_{n}^{l},{\displaystyle \frac{\hat{a}_{l}^{m}}{l}}[G_{\unicode[STIX]{x1D719}}^{i}]_{l-1}^{m}-\frac{\hat{a}_{l+1}^{m}}{l+1}[G_{\unicode[STIX]{x1D719}}^{i}]_{l+1}^{m}+{\displaystyle \frac{m}{l(l+1)}}[G_{\unicode[STIX]{x1D703}}^{i}]_{l}^{-m}\right\rangle _{\boldsymbol{t}}, & \displaystyle\end{eqnarray}$$
 $$\begin{eqnarray}\displaystyle & \displaystyle \mathscr{I}_{nml}^{p}(t_{i})=\left\langle g_{n}^{l},[G_{r}^{i}]_{l}^{m}+\frac{\text{d}}{\text{d}r}\left(\frac{\hat{a}_{l}^{m}}{l}[G_{\unicode[STIX]{x1D703}}^{i}]_{l-1}^{m}-\frac{\hat{a}_{l+1}^{m}}{l+1}[G_{\unicode[STIX]{x1D703}}^{i}]_{l+1}^{m}+\frac{m}{l(l+1)}[G_{\unicode[STIX]{x1D719}}^{i}]_{l}^{-m}\right)\right\rangle _{\boldsymbol{t}}, & \displaystyle \nonumber\\ \displaystyle & & \displaystyle\end{eqnarray}$$
using the Gaussian quadrature rule.
Appendix B. Flow fields for comparison
The description of the flow fields used for comparison in table 4 and table 6 is given below, where we have used the notation
 $$\begin{eqnarray}\displaystyle & \displaystyle \boldsymbol{U}=\unicode[STIX]{x1D735}\times {t_{l}}^{m}(r)Y_{l}^{m}(\unicode[STIX]{x1D703},\unicode[STIX]{x1D719})\hat{\boldsymbol{r}}+\unicode[STIX]{x1D735}\times \unicode[STIX]{x1D735}\times {s_{l}}^{m}(r)Y_{l}^{m}(\unicode[STIX]{x1D703},\unicode[STIX]{x1D719})\hat{\boldsymbol{r}}, & \displaystyle\end{eqnarray}$$
which is compatible with fully normalized spherical harmonics in appendix A.
-
(1) KR flow
Kumar & Roberts (Reference Kumar and Roberts1975) defined a flow field that contains both azimuthal differential rotation and meridional circulation. The flow is given by
(B 2)where
$$\begin{eqnarray}\displaystyle \left.\begin{array}{@{}c@{}}t_{1}^{0}(r)=K\sqrt{4\unicode[STIX]{x03C0}/3}\,r^{2}(1-r^{2}),\\ s_{2}^{0}(r)=K\sqrt{4\unicode[STIX]{x03C0}/5}\,\unicode[STIX]{x1D716}_{1}r^{6}(1-r^{2})^{3},\\ s_{2}^{-2}(r)=K\sqrt{4\unicode[STIX]{x03C0}/5}\,\unicode[STIX]{x1D716}_{2}r^{4}(1-r^{2})^{2}\cos (3\unicode[STIX]{x03C0}r),\\ s_{2}^{2}(r)=K\sqrt{4\unicode[STIX]{x03C0}/5}\,\unicode[STIX]{x1D716}_{3}r^{4}(1-r^{2})^{2}\sin (3\unicode[STIX]{x03C0}r),\end{array}\right\} & & \displaystyle\end{eqnarray}$$
$\unicode[STIX]{x1D716}_{1}=0.03,~\unicode[STIX]{x1D716}_{2}=\unicode[STIX]{x1D716}_{3}=0.04$
and
$K=4.4$
is a normalization factor that has been used in Love & Gubbins (Reference Love and Gubbins1996a
) to get unit r.m.s. speed. The factors of the square root of
$\unicode[STIX]{x03C0}$
are related to the normalization of the spherical harmonics.
-
(2) GKR flow
This is a dynamo studied by Gubbins et al. (Reference Gubbins, Barber, Gibbons and Love2000a ) and Li et al. (Reference Li, Livermore and Jackson2010). The flow field is a generalized KR type flow given by
(B 3)where
$$\begin{eqnarray}\displaystyle \left.\begin{array}{@{}c@{}}t_{1}^{0}(r)=\unicode[STIX]{x1D716}_{0}r^{2}(1-r^{2}),\\ s_{2}^{0}(r)=\unicode[STIX]{x1D716}_{1}r^{6}(1-r^{2})^{3},\\ s_{2}^{2}(r)=\unicode[STIX]{x1D716}_{2}r^{4}(1-r^{2})^{2}\sin (3\unicode[STIX]{x03C0}r),\\ s_{2}^{-2}(r)=\unicode[STIX]{x1D716}_{3}r^{4}(1-r^{2})^{2}\cos (3\unicode[STIX]{x03C0}r),\end{array}\right\} & & \displaystyle\end{eqnarray}$$
$\unicode[STIX]{x1D716}_{0}=6.421324129676529$
,
$\unicode[STIX]{x1D716}_{1}=-4.632495546344649$
and
$\unicode[STIX]{x1D716}_{2}=\unicode[STIX]{x1D716}_{3}=$
$1.414456257660752$
.
-
(3) STW flow
This is dynamo solution that satisfies the thermal wind equation found by Sarson (Reference Sarson2003). The flow field is
(B 4)where
$$\begin{eqnarray}\displaystyle \left.\begin{array}{@{}c@{}}t_{1}^{0}(r)=K\sqrt{4\unicode[STIX]{x03C0}/3}\,r^{2}(1-r^{2}),\\[3.0pt] s_{2}^{-2}(r)=K\sqrt{4\unicode[STIX]{x03C0}/5}\,\unicode[STIX]{x1D716}_{2}r^{4}(1-r^{2})^{2}\cos (3\unicode[STIX]{x03C0}r),\\[3.0pt] s_{2}^{2}(r)=K\sqrt{4\unicode[STIX]{x03C0}/5}\,\unicode[STIX]{x1D716}_{3}r^{4}(1-r^{2})^{2}\sin (3\unicode[STIX]{x03C0}r),\\[3.0pt] t_{3}^{-2}(r)=-K\sqrt{{\displaystyle \frac{4\unicode[STIX]{x03C0}}{7}}}\,\unicode[STIX]{x1D716}_{3}{\displaystyle \frac{4}{\sqrt{5}}}\left({\displaystyle \frac{\unicode[STIX]{x2202}}{\unicode[STIX]{x2202}r}}-{\displaystyle \frac{3}{r}}\right)r^{4}(1-r^{2})^{2}\sin (3\unicode[STIX]{x03C0}r),\\[3.0pt] t_{3}^{2}(r)=K\sqrt{{\displaystyle \frac{4\unicode[STIX]{x03C0}}{7}}}\,\unicode[STIX]{x1D716}_{2}{\displaystyle \frac{4}{\sqrt{5}}}\left({\displaystyle \frac{\unicode[STIX]{x2202}}{\unicode[STIX]{x2202}r}}-{\displaystyle \frac{3}{r}}\right)r^{4}(1-r^{2})^{2}\cos (3\unicode[STIX]{x03C0}r),\end{array}\right\} & & \displaystyle\end{eqnarray}$$
$\unicode[STIX]{x1D716}_{2}=0.04$
and
$\unicode[STIX]{x1D716}_{3}=-0.04$
. Here
$K=4.2449$
is a normalization factor so the r.m.s. speed of the flow is
$1$
.
-
(4) DJ flows
This is a group of three simple axisymmetric flows found by Dudley & James (Reference Dudley and James1989):
(B 5)
$$\begin{eqnarray}\displaystyle \left.\begin{array}{@{}c@{}}\text{DJ}~t_{1}s_{1}:\quad t_{1}^{0}(r)=\sqrt{4\unicode[STIX]{x03C0}/3}\,r\sin (\unicode[STIX]{x03C0}r),\quad s_{1}^{0}(r)=0.17\sqrt{4\unicode[STIX]{x03C0}/3}r\sin (\unicode[STIX]{x03C0}r),\\[3.0pt] \text{DJ}~t_{1}s_{2}:\quad t_{1}^{0}(r)=\sqrt{4\unicode[STIX]{x03C0}/3}\,r\sin (\unicode[STIX]{x03C0}r),\quad s_{2}^{0}(r)=0.13\sqrt{4\unicode[STIX]{x03C0}/5}r^{2}\sin (\unicode[STIX]{x03C0}r),\\[3.0pt] \text{DJ}~t_{2}s_{2}:\quad t_{2}^{0}(r)=\sqrt{4\unicode[STIX]{x03C0}/5}\,r^{2}\sin (\unicode[STIX]{x03C0}r),\quad s_{2}^{0}(r)=0.14\sqrt{4\unicode[STIX]{x03C0}/5}r^{2}\sin (\unicode[STIX]{x03C0}r).\end{array}\right\} & & \displaystyle\end{eqnarray}$$
-
(5) MDJ
$t_{1}s_{2}$
flowA modified Dudley–James flow is discussed by Livermore & Jackson (Reference Livermore and Jackson2004) and Li et al. (Reference Li, Livermore and Jackson2010). The flow field is given by
(B 6a,b )where
$$\begin{eqnarray}\displaystyle & \displaystyle t_{1}^{0}(r)=a_{1}r^{2}(1-r^{2}),\quad s_{2}^{0}(r)=a_{2}r^{3}(1-r^{2})^{2}, & \displaystyle\end{eqnarray}$$
$a_{1}=1.193271237996972$
and
$a_{2}=8.107929179422066$
. In our Galerkin basis, it can be expressed as a multiple of toroidal basis
$f_{n}^{l}(r)$
, for
$n=1,l=1$
and poloidal basis
$g_{n}^{l}(r)$
, for
$n=1,l=2$
.