INTRODUCTION
Although nitrogen (N) is an essential nutrient for China's agricultural industry, its overuse can result in contamination of groundwater (Zhang et al. Reference Zhang, Tian, Zhang and Li1996). Therefore, accurate estimation of spatially distributed N in crops is of great importance to precisely manage N application rates. Unfortunately, many of the traditional crop-testing methods are both time-consuming and labour-intensive. The development of sensors that measure spectral reflectance or remittance has created opportunities to quantitatively describe such agronomic parameters and has been increasingly applied to determine crop N status during the growing season (Filella et al. Reference Filella, Serrano, Serra and Peñuelas1995; Bronson et al. Reference Bronson, Chua, Booker, Keeling and Lascano2003; Hansen & Schjoerring Reference Hansen and Schjoerring2003; Gislum et al. Reference Gislum, Micklander and Nielsen2004; Clay et al. Reference Clay, Kim, Chang, Clay and Dalsted2006; Kruse et al. Reference Kruse, Christians and Chaplin2006; Zhang et al. Reference Zhang, Wang, Bailey and Wang2006; Mistele & Schmidhalter Reference Mistele and Schmidhalter2008; Li et al. Reference Li, Mistele, Hu, Yue, Yue, Miao, Chen, Cui, Meng and Schmidhalter2012). Thus, spectral indices of crop canopies can potentially be used as a monitoring tool for N application scheduling.
The plant N concentration and uptake level can be estimated by combining the spectral reflectance from two or more characteristic wavebands. However, the combination of many spectral bands may lead to ‘over-fitting’ if inadequate methods are used (Thenkabail et al. Reference Thenkabail, Smith and Pauw2000). The normalized difference vegetation index (NDVI) has been widely used in the remote sensing of vegetation for nearly four decades (Rouse et al. Reference Rouse, Haas, Schell, Deering, Freden, Mercanti and Becker1973). The N reflectance index (NRI) is used for N management in irrigated maize crops (Bausch & Duke Reference Bausch and Duke1996). Tarpley et al. (Reference Tarpley, Reddy and Sassenrath-Cole2000) demonstrated that the combination of near-infrared wavelengths and red-edge wavelengths provides good accuracy and precision for the prediction of cotton leaf N concentration. The green vegetation index (GVI) can be used to estimate rice leaf N accumulation (Xue et al. Reference Xue, Cao, Luo, Dai and Zhu2004). Zhu et al. (Reference Zhu, Li, Feng, Tian, Yao and Cao2006) proposed a quantitative model for estimation of leaf N status based on the normalized difference spectral index at 1220 and 710 nm and the ratio index of the average reflectance over 760, 810, 870, 950 and 660 nm. A good relationship was found between leaf N concentration and the red-edge position (REP) (Feng et al. Reference Feng, Yao, Zhu, Tian and Cao2008). Lastly, Chen et al. (Reference Chen, Haboudane, Tremblay, Wang, Vigneault and Li2010) proposed the use of the double-peak canopy N index (DCNI) for assessing N efficiency in maize and wheat.
For wheat, several studies have examined the minimum (‘critical’) N concentration required for maximum biomass production from the tillering to flowering stage (Greenwood et al. Reference Greenwood, Gastal, Lemaire, Draycott, Millard and Neeteson1991; Lemaire et al. Reference Lemaire, Khaity, Onillon, Allirand, Chartier and Gosse1992, Reference Lemaire, Avice, Kim and Ourry2005; Devienne-Barret et al. Reference Devienne-Barret, Justes, Machet and Mary2000). The N nutrition index (NNI) incorporates this information to indicate the relative N status of plants (Greenwood et al. Reference Greenwood, Gastal, Lemaire, Draycott, Millard and Neeteson1991; Lemaire et al. Reference Lemaire, Khaity, Onillon, Allirand, Chartier and Gosse1992). The index is calculated as the ratio between the measured N concentration and the critical N concentration and is used to assess the N excess or deficit in canopies. By subtracting the critical amount of N from the N uptake by the crop, the canopy N deficit or excess can be calculated in units of kg/ha (Houlès et al. Reference Houlès, Guérif and Mary2007).
Although many studies have reported correlations between spectral information and N status, relatively few have attempted to use spectral information to estimate the NNI (Mistele & Schmidhalter Reference Mistele and Schmidhalter2008; Erdle et al. Reference Erdle, Mistele and Schmidhalter2011). The present study attempted to combine N status indicators, such as the normalized NNI (ΔNNI) and N biomass difference (ΔNB), to improve previous N management based on the NNI under drip irrigation. Therefore, the objectives of the present work were: (1) to analyse the relationship between spectral indices and N concentration and the relationships between spectral indices and NNI in wheat based on field experiments involving different N rates across two growing seasons; (2) to determine the key spectral indices for assessment of NNI and subsequently estimate the NNI and ΔNB; and (3) to further improve field N management according to relationships between NNI, ΔNB and spectral indices.
MATERIALS AND METHODS
Experimental design
Field experiments were conducted in 2009 and 2010 at the Shihezi University experimental site (44°20′N, 86°3′E) in Xinjiang, China. Shihezi is characterized by a typical continental climate. Maximum and minimum temperatures are 26·1 °C in summer and −28·3 °C in winter, respectively. Large and rapid changes in temperature are experienced daily in this climate, and the temperature difference between day and night is significant. During the experimental period, the precipitation amounts were 86·8 and 110·4 mm and the frost-free periods were 168 and 171 days in 2009 and 2010, respectively. The soil at the experimental field is classified as fine-loamy with a N concentration of 42·6 mg/kg, Olsen P of 26·5 mg/kg, exchangeable K of 139·4 mg/kg, and organic matter content of 11·6 g/kg in the top 0–30 cm layer. Three local spring wheat cultivars, Xinchun6, Xinchun17 and Xinchun22 (all with similar protein content), were planted on 5 April 2009 and 8 April 2010. Nitrogen fertilizer was applied as urea at four rates (0, 105, 225 and 345 N kg/ha) before planting, and the three N applications were: 0·50 at seeding, 0·25 at jointing (Zadoks growth stage (GS) 36, Zadoks et al. Reference Zadoks, Chang and Konzak1974) and 0·25 at heading (GS 55). For all treatments, 99 kg/ha phosphorus pentoxide (P2O5, as monocalcium phosphate [Ca(H2PO4)2]) and 150 kg/ha potassium oxide (K2O, as potassium chloride, KCl) were applied prior to seeding. The between-row spacing of wheat was 20 cm, and the irrigation type was drip irrigation. Water meters located at the control structures recorded the total volume of irrigation water and each drip irrigation pipe supplied irrigation to five rows of wheat. The total volume of irrigation was 5400 m3/ha throughout the entire growing season. Irrigation water was applied at 120 m3/ha for seedling emergence, and the proportions of the total volume of irrigation corresponding to each phase were 0·19 from emergence to tillering (GS 12–21), 0·17 from tillering to jointing (GS 26–33), 0·19 from jointing to heading (GS 37–53), 0·17 from heading to anthesis (GS 57–61) and 0·28 from anthesis to milky ripe (GS 65–73). Currently, the typical total volume of common surface irrigation is 6750–7500 m3/ha throughout the entire wheat growth season, and the total volume of drip irrigation is 5250–6000 m3/ha throughout the entire wheat growth season (Wang Reference Wang2012). The total volume of drip irrigation is less than the total volume of common surface irrigation. The experiment was designed with a two-way factorial arrangement of treatments in a randomized block design with three replications for each treatment. Other management practices (such as irrigation, weed control, and pest control) followed local standards for wheat production.
Measurement of canopy reflectance
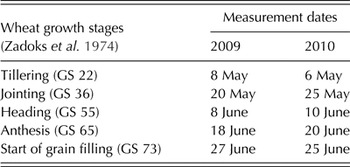
Spectral measurements were carried out at each stage (see Table 1 for dates). All canopy spectral measurements were taken with an ASD Field Spec Pro Spectrometer (Analytical Spectral Devices, Boulder, CO, USA) held in a nadir orientation 1·0 m above the canopy. All measurements were taken under clear sky conditions between 10:00 and 14:00 h (local time). The spectrometer was fitted with a 25° field of view fibre optic operating in the 350–2500 nm spectral region with a sampling interval of 1·4 nm between 350 and 1050 nm and 2 nm between 1050 and 2500 nm. The spectral resolution was 3 nm at 700 nm and 10 nm at 1400 nm. A 40 × 40-cm barite (BaSO4) calibration white panel was used as a reference. White panel radiance measurements were taken before and after the vegetation measurement using two scans each time. To reduce the possible effects of sky (rapidly changing irradiance, clouds, haze, etc.) and field (heterogeneity within field) conditions, spectral measurements were also taken at four sites in each plot and the results averaged to represent the canopy reflectance of each plot. The vegetation radiance was determined by averaging 16 scans at an optimized integration time with a dark current correction at every spectral measurement.
Spectral reflectance and nitrogen acquisition measurement dates in 2009 and 2010

Plant measurement
Biomass samples from the spectral measurement positions were collected, and above-ground biomass destructively sampled by randomly cutting 60 × 40 cm samples of vegetation from the scanned plants in each plot. All samples were heated to 105 °C and then oven-dried at 70 °C to constant weight, with final weights recorded. Dry plant material was then ground to pass through a 0·06-mm mesh screen and analysed for total N using a Carlo-Erba NA 1500 dry combustion analyser (Carlo Erba, Milan, Italy) (Schepers et al. Reference Schepers, Francis and Thompson1989).
Determination of the nitrogen nutrition index and nitrogen excess/deficit
The critical N concentration (Nc) of wheat was calculated according to the methods of Justes et al. (Reference Justes, Jeuffroy, Mary and Lemaire1997) and is described by the following equation:
 $${{\rm N}_{\rm c}} = 54 {\cdot} 3 \times {{\rm W}^{ - 0 {\cdot} 38}} $$
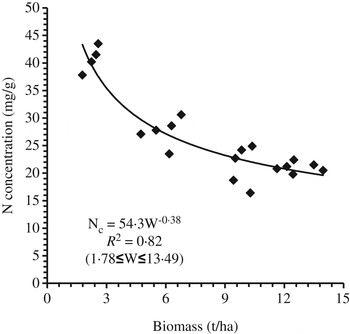
where Nc is the critical N concentration as a percentage of dry matter, and W is the dry weight of above ground biomass in tonnes per hectare (t/ha). This equation was corrected using obtained Nc and shoot biomass data under the different N treatments during 2009 and 2010. The relationship between Nc and the dry weight of above ground biomass is presented in Fig. 1.
The critical N concentration (Nc) curves with respect to biomass dry weight (BDW) of wheat in 2009 and 2010.

To indicate the N status for each plot, independent of growth stage and biomass, the NNI was calculated using Eqn (2):
 $${\rm NNI} = \displaystyle{{{{\rm N}_{{\rm act}}}} \over {{{\rm N}_{\rm c}}}}$$
where Nact is the actual (as measured) N concentration as a percentage of canopy biomass, and Nc is the critical N concentration for the crop at each plot based on dry weight (Lemaire & Gastal Reference Lemaire, Gastal and Lemaire1997). If Nact = Nc, the crop is considered optimally supplied with N. If Nact < Nc, the plant is N deficient. Lastly, if Nact > Nc, the plant is over-fertilized or is experiencing so-called ‘luxury consumption’. Here, the ΔNNI was calculated using Eqn (3):
 $$\Delta {\rm NNI} = \displaystyle{{{{\rm N}_{{\rm act}}} - {{\rm N}_{\rm c}}} \over {{{\rm N}_{\rm c}}}}$$
where ΔNNI represents the N excess or deficit. A ΔNNI < 0 indicates a N deficit that must be compensated for over time. When ΔNNI > 0, there is an excess of N and a reduction in applied N should be considered. Compared with NNI, ΔNNI was determined using the normalization method, as it is considered to be more representative of the current N status in wheat. Because ΔNNI ranges from −1 to 1, it can be used to better estimate N status compared to the NNI alone. The dry weight per N absorbed under critical (optimal) conditions is defined as NBC. The dry weight per N absorbed under real conditions is defined as NBR and can be used to determine the N absorption deficit or excess. The ΔNB was calculated using Eqn (4):
 $$\Delta {\rm NB} = \left( {{\rm N}{{\rm B}_{\rm R}} - {\rm N}{{\rm B}_{\rm C}}} \right) \times {\rm DW}$$
where DW is dry weight (kg/ha). An Nact < Nc delays normal growth of a plant, and such delayed growth that cannot be made up during the growth period.
Statistical analysis
Correlations between the total N concentration, NNI, ΔNNI, ΔNB and spectral indices were analysed using SPSS software (16·0, SPSS, Chicago, IL, USA). The coefficient of determination (R 2), root mean square error (RMSE) and relative error (RE) were used to quantify the amount of variation explained by the relationships, as well as to quantify the accuracy of such relationships. Generally, regression model performance was estimated by comparing the differences in R 2, RMSE and RE. With a higher R 2 and lower RMSE and RE, model precision and accuracy were higher for predicting wheat NNI and ΔNB.
Selection of spectral indices
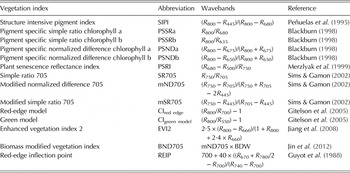
Based upon a review of previous studies’ results, 14 spectral indices were selected for estimating (1) total N concentration, (2) NNI, (3) ΔNNI and (4) ΔNB because they were highly correlated with chlorophyll content (Table 2). The biomass modified NDVI (BND705) is a hybridized index and was defined as the product of the modified normalized difference 705 (mND705) and biomass dry weight (BDW) (ND705 × BDW). This hybridized index (BND705) was reported by Jin et al. (Reference Jin, Wang, Xiao, Diao, Wang, Chen and Li2012), who found a good relationship between BND705 and chlorophyll content. In addition, another study reported a good relationship between N content and chlorophyll content (Filella et al. Reference Filella, Serrano, Serra and Peñuelas1995). Therefore, BND705 was selected for estimating NNI.
Summary of selected spectral indices, wavebands and citations for nitrogen concentration (mg/g) and nitrogen nutrition index (NNI)
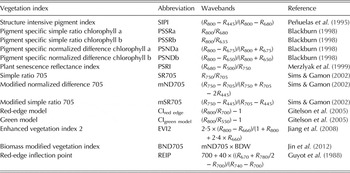
Note: R i denotes reflectance at band i (nanometer).
RESULTS
Relationships between total nitrogen concentration and critical nitrogen concentration, nitrogen nutrition index, normalized nitrogen nutrition index, NBR and nitrogen biomass difference
Correlation coefficients were calculated using data from 2009 and 2010 in order to better understand the relationships between total N concentration and Nc, NNI, ΔNNI, NBR and ΔNB. The results showed that correlations between total N concentration and Nc, NNI, ΔNNI, NB and ΔNB were significant (Table 3), and the order of association was Nc > NBR > ΔNB > NNI > ΔNNI. The highest correlation coefficient was observed for Nc, and the lowest for NNI and ΔNNI. The results indicated that total N concentration is strongly correlated with Nc, NNI, ΔNNI, NBR and ΔNB (Table 3).
Correlation coefficients for relationships between total N concentration and Nc, NNI, ΔNNI, NBR and ΔNB

The normalized nitrogen nutrition index and nitrogen nutrition index at different levels of nitrogen
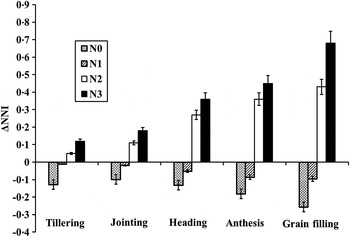
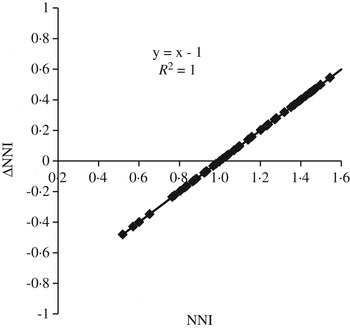
The ΔNNI values represented average values for three wheat cultivars under different N treatments, because analysis of variance (ANOVA) results showed that the ΔNNI of wheat cultivars does not significantly differ under different N treatments (Fig. 2). The results showed that the ΔNNI was significantly different between N treatments from the tillering (GS 22) to grain filling stage (GS 73) (P < 0·01). It was always <0 with N0 and N1 treatments, suggesting these plants were always N-deficient, and always >0 (ΔNNI > 0) with N2 and N3 treatments. These results showed that total N concentration (ΔNNI > 0) was always indicative of over-fertilization. As growth progressed, the degree of over-fertilization (ΔNNI > 0) gradually increased under N2 and N3 treatments, whereas the degree of N deficiency (ΔNNI < 0) gradually increased under N0 and N1 treatments. The NNI and ΔNNI values were calculated using Eqns (2) and (3), respectively, and the correlation between ΔNNI and NNI was analysed (R 2 = 1) (Fig. 3). The trend for ΔNNI was the same as that for NNI. These results show that N application at jointing (GS 36) and heading (GS 55) cannot be used to improve N deficiency under N0 and N1 treatments. However, N application at jointing (GS 36) and heading (GS 55) led to over-fertilization under N2 and N3 treatments. These results showed that ΔNNI or NNI could be used to monitor fertilizer application as well as to determine whether to reduce fertilizer application.
The change trends of the normalized nitrogen nutrition index (ΔNNI) for different N treatments in wheat (average value of three wheat cultivars). *Note: Data are average values across 2 years with one standard error (vertical bars). ANOVA results for tillering: N, P < 0·01 and wheat cultivar (C), not significant; jointing: N, P < 0·01 and C, not significant; heading: N, P < 0·01 and C, not significant; anthesis: N, P < 0·001 and C, not significant; and filling: N, P < 0·01 and C, not significant.

Quantitative relationship between ΔNNI and NNI in wheat.

Appropriate nitrogen concentration at different growth stages
The ΔNNI of wheat under different N treatments differed during various growth stages in increasing order of: N3 > N2 > N1 > N0 (Fig. 2). The most appropriate N concentration (Table 4) was calculated according to the Nc equation at the different growth stages. The most appropriate N concentration indicated that reduced N fertilizer application could be used to decrease environmental pollution during the different growth stages.
The most appropriate nitrogen concentration (mg/g) for wheat at the different growth stages

Estimating nitrogen concentration (mg/g)
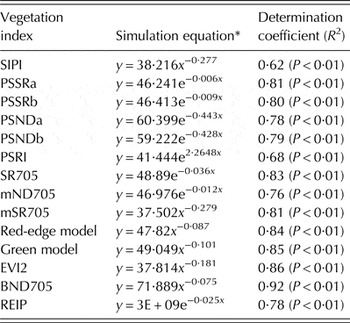
The data from 2009 were used to study the relationships between total N concentration and spectral indices under the N1, N2 and N3 treatments, and linear and non-linear regression analyses were done using these spectral indices as independent variables. The results in Table 5 indicate that the relationships between total N concentration and all spectral indices were significant. The vegetation index BND705 was significantly correlated with N concentration (P < 0·01) and had the highest determination coefficient (R 2) of 0·92 (P < 0·01). The R 2 values were 0·62 for the structure intensive pigment index (SIPI), 0·81 for the pigment-specific simple ratio chlorophyll a (PSSRa), 0·80 for the pigment-specific simple ratio chlorophyll b (PSSRb), 0·78 for the pigment-specific normalized difference chlorophyll a (PSNDa), 0·79 for the pigment-specific normalized difference chlorophyll b (PSNDb), 0·68 for the plant senescence reflectance index (PSRI), 0·83 for the simple ratio 705 (SR705), 0·76 for the modified normalized difference 705 (mND705), 0·81 for the modified simple ratio 705 (mSR705), 0·83 for the red-edge model, 0·85 for the green model, 0·85 for the enhanced vegetation index 2 (EVI2) and 0·78 for the red-edge inflection point (REIP). These values suggest that these spectral indices could be used to estimate N concentration in wheat.
Correlation of wheat N concentration (mg/g) and spectral indices

* x represents spectral indices and y represents nitrogen concentration (mg/g).
Estimating nitrogen nutrition index
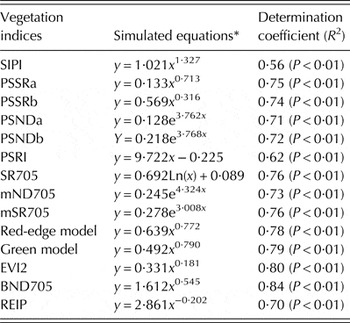
Correlations between spectral indices and the NNI under N1, N2 and N3 treatments were studied using the 2009 data (Table 6), as well as correlations between these spectral indexes and NNI, as canopy NNI estimation functions. Seven spectral indices had an R 2 of <0·8 (P < 0·01), and six had an R 2 of >0·8 among all spectral indices. The lowest and highest correlation coefficients were found for the SIPI and BND705, respectively, with respective R 2 values of 0·56 and 0·84. These results indicate that all spectral indices were significantly correlated with the NNI. The NNI was also significantly correlated with the BND705 (R 2 = 0·84), red-edge model (R 2 = 0·78), green model (R 2 = 0·79), EVI2 (R 2 = 0·80), SR705 (R 2 = 0·76), PSSRa (R 2 = 0·75) and mSR705 (R 2 = 0·76), indicating that these models could be used to estimate the NNI for wheat. Eighty data pairs were used to establish the regression model for the estimation of NNI from the 2009 data; the best of the regression functions of BND705 and EVI2 were established for predicting NNI. The BND705 and EVI2 were fitted to the power regression functions, for which the R 2 values were 0·84 and 0·80, respectively.
Correlation of the wheat nitrogen nutrition index (NNI) and the spectral indices
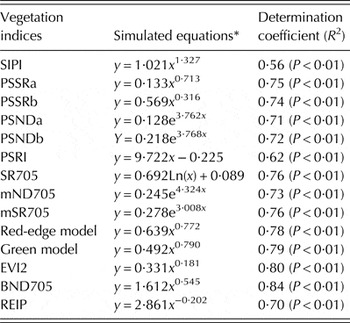
* x represents spectral indexes and y represents nitrogen nutrition index (NNI).
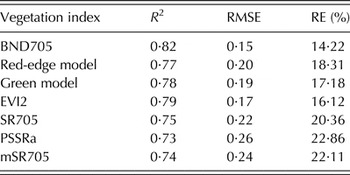
To validate model accuracy, the predicted values were compared with the actual values in the regression functions using the 2010 data. The results indicated good correlation between the predicted values and actual values. The highest estimation accuracy was observed for BND705, for which the RMSE was 0·15 and the RE was 14·22% for the NNI of wheat (Table 7). The lowest estimation accuracy was observed for the PSSRa, for which the RMSE was 0·26 and the RE was 22·86% (Table 7). These results suggest that BND705 was better than the others and that it could be used to predict the NNI accurately.
Relationships between the predicted and measured values for the NNI of wheat
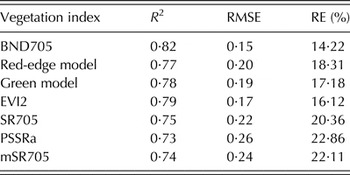
RMSE, root mean square error; RE, relative error.
Relationships between nitrogen biomass difference and enhanced vegetation index 2 and 705 × biomass dry weight
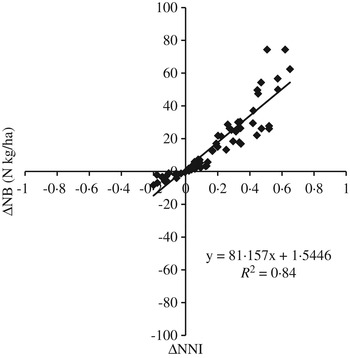
Just as significant relationships were revealed between ΔNNI and NNI as well as between NNI and BND705 (Tables 6 and 7), there was also a good relationship between BND705 and ΔNNI. Similarly, a significant relationship (P < 0·01) was found between ΔNNI and ΔNB (Fig. 4). Therefore, there was a good relationship between the BND705, EVI2 and ΔNB. To determine if a correlation exists between the BND705, EVI2 and ΔNB, two regression models was established to estimate ΔNB using the BND705 and EVI2. Both BND705 and ΔNB had a linear relationship with an R 2 value of 0·83 (P < 0·01). In addition, there was a good correlation between the predicted values and the actual values as observed, with a RMSE of 6·21 N kg/ha (Fig. 5 a). The EVI2 and ΔNB had a linear relationship with R 2 and RMSE values of 0·69 (P < 0·01) and 11·52 N kg/ha, respectively (Fig. 5 b). These results suggest that the BND705 and EVI2 could be used to predict ΔNB accurately in wheat.
Correlational relationship between ΔNNI and ΔNB in wheat.

Quantitative relationships between ΔNB and (a) BND705 and (b) EVI2 in wheat.

Nitrogen application
Positive correlations were also found between ΔNNI and ΔNB. The results indicate that if ΔNNI > 0 and ΔNB > 0, there is excess N, which should be accompanied by a reduction in N application. However, ΔNNI < 0 and ΔNB < 0 indicates an N deficit, which could be rectified by N fertilizer application during subsequent growth. For example, at heading (GS 55), ΔNNI was –0·5, meaning the actual N concentration was less than the Nc (2·27). Firstly, the actual N concentration (N kg/ha) was calculated using the actual percentage N concentration (mg/g) multiplied by the actual dry biomass (kg/ha), and the critical biomass N content (N kg/ha) was also calculated using the critical N concentration (Nc,mg/g) multiplied by the critical dry biomass (kg/ha), which was calculated using Eqn (1). Secondly, the ΔNB was obtained using actual N content (N kg/ha) minus the critical biomass N content (N kg/ha): this value was <0 , suggesting N deficit. Thirdly, the amount of N applied at anthesis (GS 65) was obtained by the critical biomass N content (N kg/ha) at anthesis (GS 65) plus the deficit in N (N kg/ha) at heading (GS 55). Similarly, when ΔNNI was 0·5, the actual N concentration was greater than the critical N concentration (22·7) at heading (GS 55), suggesting an excess of N. The amount of N application at anthesis (GS 65) could be obtained by the critical biomass N content (N kg/ha) at anthesis (GS 65) minus the excess N (N kg/ha) at heading (GS 55).
DISCUSSION
For all N treatments, ΔNNI values were >0 with the exception of the N0 and N1 treatments at all growth stages. Several studies have suggested that as more N fertilizer is applied (in an attempt to obtain greater wheat yield), the N concentration of soil and plants increases (Zhang Reference Zhang2008; He et al. Reference He, Li, Jin, Wang, Li, Wang and Cui2009; Ju et al. Reference Ju, Xing, Chen, Zhang, Zhang, Liu, Cui, Yin, Christie, Zhu and Zhang2009). The results of the present study indicate that over-fertilization (ΔNNI > 0) was applied under N2 and N3 treatments and then led to higher plant N concentration. This result is consistent with the findings of Zhang (Reference Zhang2008) and He et al. (Reference He, Li, Jin, Wang, Li, Wang and Cui2009). In the present study, the calculated changes in residual mineral N of soil during the different growth stages were not considered due to the limited experimental conditions. Both the residual mineral N of soil and the N of wheat plants need to be considered comprehensively in future studies of methods for better applying N fertilizer.
There were significant correlations between NNI and BND705, red-edge model, green model, EVI2, SR705, PSSRa and mSR705, and thus, these indices could be used to estimate NNI. These results are in agreement with those of recent studies in which simulation data were used (Mistele & Schmidhalter Reference Mistele and Schmidhalter2008; Liang & Liu Reference Liang and Liu2010). Mistele & Schmidhalter (Reference Mistele and Schmidhalter2008) and Liang & Liu (Reference Liang and Liu2010) used the REIP to estimate the NNI for wheat and maize in Germany and China. In the present study, the BND705, red-edge model, green model, EVI2, SR705, PSSRa and mSR705 were better than REIP for estimating NNI. The results indicated that these indices could further improve the accuracy of NNI estimates. Because these spectral indices also have been used to estimate the leaf or canopy N and chlorophyll content of maize, wheat and other vegetation in the USA and Germany (Blackburn Reference Blackburn1998; Sims & Gamon Reference Sims and Gamon2002; Gitelson et al. Reference Gitelson, Viña, Ciganda, Rundquist and Arkebauer2005; Jiang et al. Reference Jiang, Huete, Didan and Miura2008), and a good relationship was demonstrated between N concentration and NNI (Greenwood et al. Reference Greenwood, Gastal, Lemaire, Draycott, Millard and Neeteson1991; Lemaire et al. Reference Lemaire, Khaity, Onillon, Allirand, Chartier and Gosse1992; Mistele & Schmidhalter Reference Mistele and Schmidhalter2008; Erdle et al. Reference Erdle, Mistele and Schmidhalter2011), the results indicate that these spectral indices could be applied to estimating NNI in different countries and regions. The accuracy of these models in predicting the NNI with seven spectral indices was in fact high, with RE ranging from 14·22 to 22·86%. Therefore, it is feasible to predict the NNI in wheat using these spectral indices. The results showed that the NNI and ΔNNI were closely correlated with the ΔNNI and ΔNB, respectively: NNI and ΔNNI were calculated using Eqns (2) and (3), respectively, and ΔNNI was calculated from the NNI. The results showed that NNI was highly related with ΔNNI. Similarly, ΔNB was obtained by NBR minus NBC, which correspond respectively to Nact and Nc, as calculated in Eqns (2) and (3), ΔNNI and ΔNB also were correlated with total N concentration. Therefore, it can be concluded that NNI also significantly correlates with ΔNB. It can also be determined, indirectly, that use of the BND705 and EVI2 results in a good correlation of the ΔNNI and ΔNB, and could therefore be used to assess the ΔNNI and ΔNB.
The vegetation index BND705 included biomass dry weight (BDW) that is sensitive to variation in N content and spectral bands (750 and 705 nm) that are sensitive to variation in chlorophyll content, and there is a strong relationship between chlorophyll content and N content (Filella et al. Reference Filella, Serrano, Serra and Peñuelas1995; Moran et al. Reference Moran, Mitchell, Goodmanson and Stockburger2000). The BND705 (ND705 × BDW) decreased the effect of soil and environmental conditions at earlier growth stages and ameliorated the saturation at luxuriant growth stages because of the addition of BDW, which increased gradually with progression through the wheat growth stages. Overall, the sensitivity of spectral indices was mainly influenced by soil and environmental conditions at earlier growth stages, and the saturation problem observed for the spectral indices was mainly influenced by the structure of the wheat canopy at luxuriant growth stages. This explains why the estimation accuracies of the BND705 for NNI and ΔNB were better than those obtained via other spectral indices. In a previous paper by the current authors, an optimized soil-adjusted vegetation index (OSAVI, Rondeaux et al. Reference Rondeaux, Steven and Baret1996) × BDW could be used to improve the estimation accuracy of N content, but the BDW was obtained by destructive sampling and required significant time investment for data acquisition. Thus, an attempt was made to construct new spectral indices by replacing the BDW with other spectral indices. The results showed that the new spectral indices: OSAVI × SIPI, OSAVI × CIred edge, and OSAVI × CIgreen model were better than OSAVI, SIPI, CIred edge and CIgreen model alone for assessing N content, and that they could be used to improve the accuracy of N content estimation (Jin et al. Reference Jin, Diao, Xiao, Wang, Chen, Wang and Li2013). These results indicate that BDW in BND705 can be replaced using other spectral indices, which provides a reliable method for improving the accuracy of estimates of N concentration, NNI and chlorophyll content. The aim of the current paper was to detect the N concentration status using simpler devices such as a SPAD-meter along with useful spectral information and novel spectral indices.
In the current paper, BND705 and EVI2 were used directly to estimate N concentration (mg/g), NNI, and ΔNB. Therefore, the calculation procedure was simplified by using these relationships. The values of ΔNB and NNI increased rapidly at heading (GS 55) according to the relationships between ΔNB, NNI, and spectral indices, and the amount of N applied at anthesis (GS 65) was the critical N biomass content (N kg/ha) at anthesis (GS 65) plus the deficit in N (N kg/ha) or minus the excess of N (N kg/ha) at heading (GS 55), which were calculated using the equation in Fig. 5. Nitrogen was applied at seeding, jointing (GS 36), and heading (GS 55). Similarly, spectral indices at tillering (GS 22) could be used to guide the next N application at jointing (GS 36) by considering the relationships between the spectral indices and ΔNB and NNI at tillering (GS 22) and the critical N biomass content (N kg/ha) at jointing (GS 36). Although N is not applied at anthesis (GS 65) or at grain filling (GS 73), the N status of wheat can be detected by using relationships between spectral indices and ΔNB and NNI at anthesis (GS 65) and at grain filling (GS 73). Spectral indices were also used to estimate the BDW for wheat (Hansen & Schjoerring Reference Hansen and Schjoerring2003), and then BDW, N concentration, ΔNB, and NNI of wheat were estimated using spectral indices. Therefore, the current results provide guidelines for future rapid estimation of the N status of wheat at different growth stages on a regional scale.
The results show that different spectral indices could be selected throughout the range of wheat growth stages and that these spectral indices could be used to predict NNI and ΔNB. Strong relationships between NNI, ΔNNI, ΔNB and spectral indices were observed at the various sampling dates. Moreover, it is important to pay close attention to sample dates when used for predicting crop N requirements. The use of spectral indices and regression analysis should provide a non-destructive and real-time monitoring of crop N status. However, precisely and effectively assessing whether crop N status can be remotely acquired remains a particular challenge. The present study provides some evidence that spectral indices may be useful in predicting NNI, ΔNNI and ΔNB, and thus, improving N application scheduling. However, because the spectral indices modelled in the present study were based on limited data, further research using independent data and data from across several environments and years is necessary to further validate such spectral index models.
CONCLUSION
The results of the present study and the insights provided by previous studies led to the following conclusions: Nc, NNI, ΔNNI, NBR and ΔNB are highly correlated with total N concentration. The ΔNNI was sensitive to different N treatments, and all spectral indices were significantly related with total N concentration. The BND705, EVI2, red-edge model, green model, SR705, PSSRa and mSR705 were used to improve the estimation accuracy of NNI. For improvement in estimation accuracy, BND705 was better than other indices at predicting NNI. NNI and ΔNNI were strongly correlated with the ΔNNI and ΔNB (R 2 = 1 and 0·84, respectively). The BND705 was used to estimate NNI and ΔNB. There was a significant correlation between the BND705 and ΔNB, with R 2 and RMSE values of 0·83 and 6·21 N kg/ha, respectively. The EVI2 and ΔNB were also linearly related, with R 2 and RMSE values of 0·69 and 11·52 N kg/ha, respectively.
The study was supported by the National Natural Science Foundation of China (Grant No. 31071371, No. 30760109, and No. 41161068) and the Key Projects in the National Science & Technology Pillar Program during the Twelfth Five-Year Plan Period (Grant No. 2012BAH27B04). The authors would also like to thank the staff at the Agricultural Remote Sensing Center, Key Laboratory of Oasis Ecology Agriculture of Xinjiang Construction Crops.