NOMENCLATURE
- CFD
computational fluid dynamics
- CL
lift coefficient (unit reference area)
- CD
drag coefficient (unit reference area)
- CT
lateral force coefficient (unit reference area)
- f
objective function
- DoE
design of experiments
- LSR
land speed record
- M ∞
freestream Mach number
- p
polynomial
- RBF
radial basis function
- RSM
response surface modelling
- RMSE
root mean square error
- SCH
static central hub
- SSC
SuperSonic car
- SST
shear stress transport
- q ∞
freestream dynamic pressure
 $\vec{u}$
velocity vector field
- α
lift penalty weighting parameter
- ϕ
design space parameter
- ψ
radial basis function
- λ
radial basis function weighting coefficient
- $\vec{\omega }$
wheel rotation vector


1.0 INTRODUCTION
1.1 The land speed record
The current Land Speed Record (LSR) of 763.035 mph (Mach 1.02) was set in 1997 by THRUST SuperSonic Car (SSC). Driven by Andy Green in the Black Rock Desert, Nevada, US, THRUST SSC marked the world’s first supersonic LSR)(Reference Noble1). In 2008, the BLOODHOUND SSC project was officially launched and assigned a target speed of 1,000 mph (approximately Mach 1.3); if reached, it will exceed the current record by 237 mph (an increase of 31%), which would be both the greatest absolute and relative margin between consecutive LSRs ever achieved(2). A picture of the BLOODHOUND SSC vehicle during final assembly is shown in Fig. 1.
The BLOODHOUND SSC during final assembly.

As well as being the first supersonic LSR vehicle, the THRUST SSC was also set apart from its predecessors by the extent to which Computational Fluid Dynamics (CFD) shaped the aerodynamic design(Reference Morgan, Hassan and Weatherill3). Recently, use of CFD as a fundamental design tool has become much more feasible due to advancements in computer hardware. For example, when the supercomputer CRAY-1 performed the first F-16A simulation in the late 1970s, data processing, validating of results, and creating the three-dimensional mesh took many months of computation time(Reference Shang4). The vastly shorter timeframes for modern CFD simulations are a result of both advances in computer hardware and innovations such as the development of the unstructured mesh techniques in the 1980s(Reference Hassan, Morgan, Probert and Peraire5). The aerodynamic design of BLOODHOUND SSC has been, and continues to be, driven by CFD.
This paper describes the computational optimisation of the geometry of the vehicle’s rear wheel fairing focussing on the aerodynamic design necessary to achieve the unique mission objective of a LSR vehicle. The location of the rear wheel fairing is shown on a parametric model of the car in Fig. 2. The paper will then explore the resulting impact on the car’s predicted top speed.
An image of the parametric model of BLOODHOUND SSC with the rear wheel fairing highlighted in red.
The initial optimisation approach was based on a Design of Experiments (DoE) philosophy(Reference Fisher6). It will be shown that the predicted error in the simple response surface functions used to fit the sampled data were too large, given the number of CFD samples possible in the timeframe of the project. Therefore, a second study using Radial Basis Function(Reference Zou, Hu, Zhou, Li and Dunn7) design space interpolation coupled to a Nelder–Mead optimisation approach(Reference Nelder and Mead8) was implemented. The study presented in this paper was undertaken towards the end of the BLOODHOUND SSC design process. At this stage, CFD studies had assessed the design of the wheels(Reference Evans, Hassan, Jones, Morgan and Remaki9), the design of the rear portion of the vehicle(Reference Evans, Morton, Sheridan, Hassan, Morgan and Jones10), and the simulation of the aerodynamic behaviour of the finalised design considering lift and drag of the whole vehicle(Reference Evans and Rose11). These studies were all conducted on models with a simple concept fairing design acting as a shroud to protect the rear wheels. The work detailed in this paper focussed primarily on drag minimisation, which does not become a significant problem until the vehicle approaches its 1,000 mph target; such test runs are not planned until 2017. The success of the fairing proposed by this study will be judged relative to the performance of the concept fairing design. At the time of writing, the final ‘frozen’ design has been confirmed; vehicle manufacture is complete, with testing due to commence in 2016(13).
1.2 Aerodynamic optimisation – background
In the past, aerodynamic optimisation has been a trial-and-error procedure based on – and limited by – the knowledge and intuition of the aerodynamicist. Lack of automation in this approach considerably limits the number of trials that can be made in a given timeframe. Additionally, an aerodynamicist may have incorrect preconceptions that guide the design away from a configuration that may be optimal. Automation of the optimisation process and faster CFD turnaround times(Reference Morgan, Peraire, Peiro and Hassan14) have enabled larger design spaces to be investigated. Both gradient-based and evolutionary (population-based) algorithms optimisation methods are now common in the field of aerodynamics(Reference Vassberg and Jameson15).
Evolutionary algorithms, popularised in the 1970s(Reference Holland16), are often attempts to mimic natural processes to solve search and optimisation problems using a population of agents. Since then, evolutionary algorithms have been applied successfully to aerodynamic design problems(Reference Wang, Periaux and Sefrioui17-Reference Shahrokhi and Jahangirian19). Evolutionary algorithms are typified by flexibility and capability to locate the global optimum in problems with a large number of local optima. This does incur a high computational cost, however, and convergence rates can be highly dependent on the problem being studied.
Gradient-based methods offer a less computationally intensive alternative to evolutionary algorithms and have been widely used in aerodynamic optimisation problems(Reference Hicks and Henne20-Reference Dwight and Brezillon22). The classic problem with gradient-based methods is that they struggle to guarantee finding global minimum, the optimum found often being sensitive to the starting point of the search, and they rely on an ability to compute the gradient of the objective function under consideration.
1.3 Overall vehicle performance
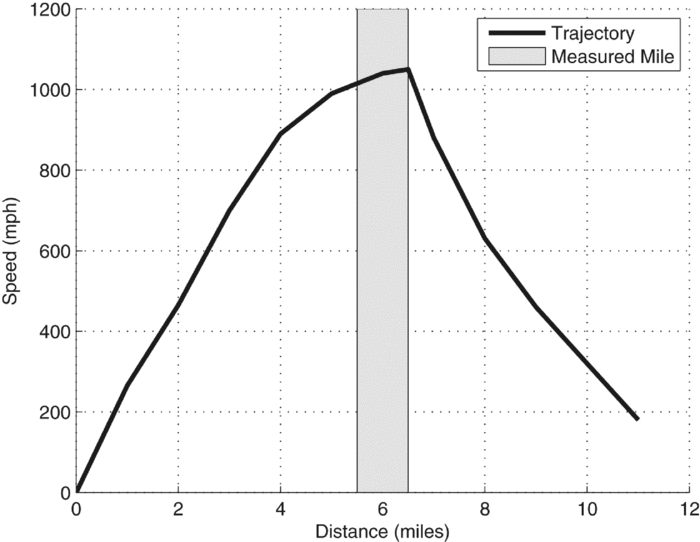
The predicted response of the BLOODHOUND vehicle, combined with estimates of jet and rocket engine thrust profiles and vehicle mass predictions have been used as input data for a full vehicle performance model based on Euler forward time integration of Newton’s second law, implemented in Matlab(Reference Evans, Hassan, Jones, Morgan and Remaki9). This model is able to predict the vehicle’s sensitivity to changes in the predicted CFD force coefficients (as a function of vehicle Mach number) in terms of variables such as maximum speed achieved and track length required. An example of the output from this overall vehicle performance model is shown in Fig. 3.
A predicted BLOODHOUND SSC performance curve.
1.4 Problem statement
Approximately one third of the total supersonic drag acting on the vehicle (of which wave drag dominates) is accounted for by the rear wheels and suspension system. In terms of maximising the vehicle’s potential top speed on the fixed available track length, supersonic drag minimisation is critical. It was therefore determined that supersonic drag minimisation was the primary objective of this optimisation study. If this could be achieved without adversely affecting the lift characteristics at the rear of the car (since the pre-optimisation lift characteristics across the entire Mach range were already satisfactory), then that would be an additional benefit.
1.5 Layout of paper
The following section (Section 2) of this paper briefly outlines the CFD methodology used for simulating the supersonic flow characteristics and, in turn, deriving the force coefficients of the system and therefore the optimisation objective function. Section 3 then considers the approach used for geometry parameterisation and a validation study of this approach. This is followed by a preliminary study (pre-optimisation) where a comparison is made between running the fairing with an ‘open’ top and a ‘closed’ top to determine the baseline geometry for the optimisation. Section 5 explains and presents the results from the initial DoE approach used, followed by Section 6, which explains and presents the results from the final Nelder–Mead Radial Basis Function approach, which generates the final optimised design. Section 7 outlines the predicted effect this drag reduction will have on the performance profile of BLOODHOUND SSC, followed by Section 8, which contains a summary of conclusions from the study.
2.0 THE CFD SYSTEM
In this optimisation problem, the objective function was computed using an unstructured, finite volume CFD solver known as the FLITE3D system(Reference Morgan, Peraire, Peiro and Hassan14).
The FLITE3D solver is a vertex-centred, finite-volume solver that uses agglomeration-based multi-grid algorithms on unstructured hybrid meshes(Reference Sorensen23). The CFD approach utilised was based on solution of the steady-state Reynolds-averaged compressible Navier–Stokes equations with a Menter SST turbulence model(Reference Menter and Egorov24). Stabilisation of the solver was achieved by use of a second-order HLLC flux function(Reference Batten, Clarke and Causon25) with local time integration to steady state undertaken using a three-stage Runge–Kutta algorithm. In addition to the solver, the FLITE3D system includes modules for surface meshing, volume meshing and pre- and post-processing. The software suite was developed at Swansea University and has been used as an in-house research code for over 2 decades. Previous work(Reference Evans, Hassan, Jones, Morgan and Remaki9,Reference Evans, Morton, Sheridan, Hassan, Morgan and Jones10) indicated that it was a suitable choice for the aerodynamic modelling. A mesh convergence study was previously been carried out(Reference Evans and Rose11) for simulations of this geometry under similar condition. The results form this study drove the decision about the most suitable mesh resolution. CFD meshes were typically of the order of 25 m elements with refinement focussed on the rear of the vehicle in the vicinity of the rear wheel. An example of a surface mesh is shown in Fig. 4.
An example of the surface mesh used for the CFD studies in a side view of the car.
An overview of the CFD process is shown in Fig. 5, indicating the seven stages from initial geometry preparation in a CAD system through to final analysis of the post-processed CFD results.
Overview of the CFD process, indicating the stages: (1) geometry preparation (CAD), (2) mesh density specification, (3) unstructured mesh generation, (4) mesh quality analysis, (5) CFD simulation (6) post-processing and (7) analysis.
2.1 Boundary conditions
To complete the specification of the problem, boundary conditions must be defined over the entire boundary of the computational domain. In the case of simulating the full BLOODHOUND SSC vehicle aerodynamics, this includes farfield boundaries, viscous walls, jet engine/rocket exhausts and jet intake(Reference Evans and Rose11).
2.1.1 Inflow and outflow boundaries
At basic inflow and outflow boundaries, a characteristic treatment(Reference Usab, Murman and Habashi26) is employed to determine the number and type of conditions that require specification at any given point.
2.1.2 Viscous walls
For viscous flow, the no-slip condition:
 $$\begin{equation}
\vec{u} = \vec{u}^w
\end{equation}$$
is strongly applied, where  $\vec{u}^w$ is a specified wall velocity. When simulating a vehicle with rotating wheels, the vector
 $\vec{u}^w$, at a point with position vector
 $\vec{r}$ on the wheel relative to a user-specified position on the axis of rotation, is computed as:
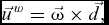 $$\begin{equation}
\vec{u}^{\,w} = \vec{\omega }\times \vec{d},
\end{equation}$$
where
 $$\begin{equation}
\vec{d} = \vec{r} - \frac{(\vec{\omega }.\vec{r})}{\left|\vec{\omega }\right|}{\vec{\omega }}
\end{equation}$$
is the position vector of the point relative to the centre of the wheel and  $\vec{\omega }$ is the user-specified wheel rotation vector. All the simulations are performed with the vehicle at rest, and this requires that the ground moves with the speed of the vehicle but in the opposite direction. This boundary condition definition for the ground plane assumes that it behaves as an impervious surface at the same temperature as the local flow. The validity of this assumption will be explored during early vehicle testing. Note that the wheel intersects with the rolling ground surface, assuming a penetration depth of 15 mm. This assumption is based on observations of wheel–ground interaction behaviour during the Thrust SSC LSR project(Reference Noble1). This is another assumption that will require validation during vehicle testing. Figure 6 shows a slice through one of the rear wheels and fairing. Note that the flow is fully simulated in the space between the wheel and fairing.
A longitudinal (constant y) mesh cut through the wheel centreline indicating the resolution and boundary layer mesh. Note that the flow is being modelling in the gap between the rotating wheel and static fairing.
2.1.3 Jet engine/Rocket exhaust
Supersonic inflow conditions (density, velocity and pressure), provided by the engine and rocket manufacturers, are applied strongly at the engine and rocket exhausts. Note that the mesh was not refined significantly downstream to capture the jet shear layers, since this optimisation study focussed on supersonic performance and it was deemed that downstream flow would not significantly affect the vehicle.
2.1.4 Jet engine inflow
The internal flow within BLOODHOUND’s EJ200 jet engine is not modelled. The internal portion of the engine is considered to lie outside of the computational domain. This implies that an outflow boundary condition is required at the engine’s compressor (fan) face. The most useful description of the demand placed on an aerodynamic flow by a jet engine face is the specification of a non-dimensional mass flow function(Reference Evans and Rose11,Reference Anderson12) relating the mass flow rate, total temperature and total pressure experienced at the compressor face. This mass flow function depends on the throttle setting of the engine and the freestream Mach number and is provided by the engine manufacturer. Due to the military nature of the EJ200 jet engine, exact mass flow rate metrics cannot be published. At each timestep, the mass flow function requirement is satisfied by an iterative technique based on locally modifying the velocity vector field at the engine face.
2.2 Improving computational performance
To ensure a reasonable turnaround time for each simulation, the computational performance of the solution algorithm is improved by the use of parallel processing. The parallel implementation implemented in FLITE3D is based on physical domain decomposition. In order to optimise performance and achieve scalability on a large number of processors, the chosen domain decomposition strategy must produce sub-domains of a balanced size and with a minimum number of cut edges. This ensures that each processor has to perform an equal amount of work and that the amount of communication between processors is minimised. This has been achieved by utilising the METIS family of partitioning algorithms(Reference Karypis and Kumar27).
During this study, FLITE3D’s solver and ancillary functions were executed using the computational power of Swansea University’s Zienkiewicz Centre for Computational Engineering parallel computer cluster. Each CFD study was conducted using a cluster of 36 Opteron 240 dual-core 1.4 GHz processors. Each individual steady state CFD simulation took approximately 6 days of wall clock time on meshes of approximately 25 m elements.
2.3 Aerodynamic coefficients
The FLITE3D system post-processor integrates pressure and skin friction loading across the vehicle surface and outputs aerodynamic forces as coefficients normalised by the dynamic pressure as:
 $$\begin{equation}
C_L = L/q_{\infty }, \\
\end{equation}$$
 $$\begin{equation}
C_D = D/q_{\infty }, \\
\end{equation}$$
 $$\begin{equation}
C_T = T/q_{\infty },
\end{equation}$$
3.0 PARAMETERISATION OF THE FAIRING GEOMETRY
Based on previous optimisation studies conducted on the BLOODHOUND vehicle(Reference Evans, Hassan, Jones, Morgan and Remaki9,Reference Evans, Morton, Sheridan, Hassan, Morgan and Jones10) , it was concluded that using DoE to optimise a parametric geometry was the most efficient use of the available computing power.
The fairing that is to be used in practice on BLOODHOUND will be a complex geometry made up of continuous curved surfaces. To study such a complex geometry directly, whilst maintaining consistency in the geometric description of the complex curvature, would require too many design parameters. For this reason, a simplified parametric model was used with the intention that it would form the basis for the final fairing design by characterising the important aerodynamic features of the fairing. This could be achieved, for example, by revealing whether the drag created by the fairing was more sensitive to changes to the leading section of the fairing geometry, or the trailing section.
3.1 Creation of the parametric geometry
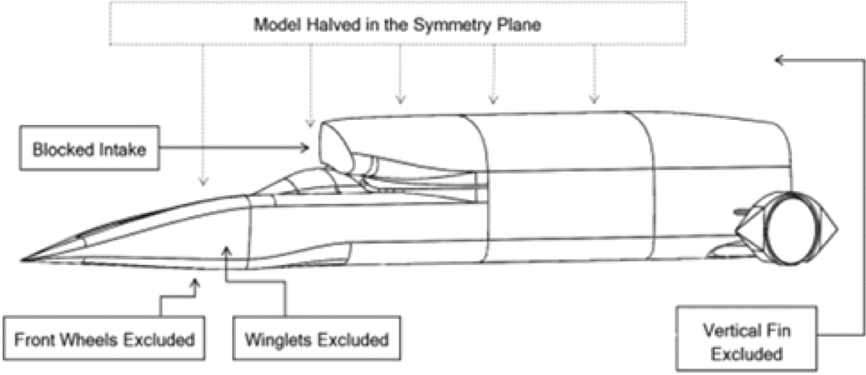
In order to reduce the full vehicle modelling complexity, simplifications were introduced: the intake was blocked, jet and rocket exhausts were omitted, and the winglets, vertical fin and front wheels were removed. The vehicle was also halved in the longitudinal axis, which would later be accounted for in the FLITE3D system with the use of a symmetry plane to mirror the model. These simplifications are illustrated in Fig. 7, where the half-car parametric model is presented.
An annotated diagram of the simplified parametric geometry with the parametric fairing.
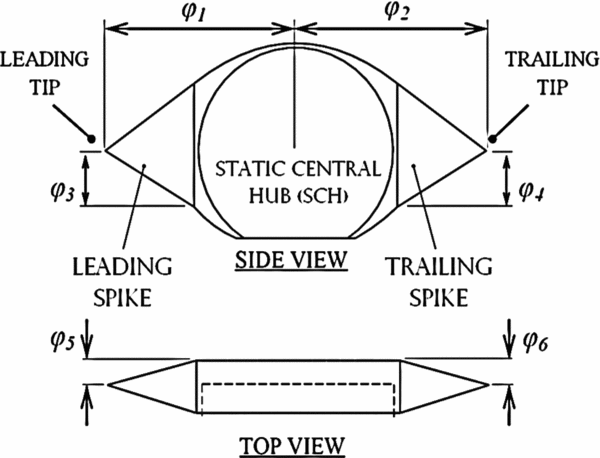
The fairing itself needed to be defined by several constrained design parameters that could be varied to control the resulting geometry for the DoE optimisation process. To achieve this, the fairing was split into three components: the leading spike, the trailing spike, and the Static Central Hub (SCH). The SCH made up the central part of the fairing to which the leading and trailing spikes were anchored. The SCH was also attached to the suspension struts connecting the wheel to the main body of the vehicle, as well as being the point of attachment for the wheel axle. Due to the degree to which the SCH hugged the profile of the wheel (around 16 mm of clearance between the wheel and the fairing in the parametric model), opportunity to vary its geometry was limited; this led to the SCH remaining static throughout all of the DoE optimisation permutations.
The scope for variation in the fairing geometry was therefore limited to adjusting the positions of the leading and trailing spike tips in three-dimensional space. To enable both leading and trailing tips to be adjustable in 3 degrees of freedom but also independently of one another to allow for asymmetric configurations three parameters were required for each tip. This gave the parameters depicted in Fig. 8. The leading and trailing spikes are pyramids, with their bases attached to the rectangular faces on the SCH and tips defined by the variable design parameters.
The variable dimensions (ϕ 1-6) are shown. The variable dimensions define the position of the leading and trailing tip, which in turn define the shape of the leading and trailing spikes. The SCH forms the central part of the fairing and remains static throughout.
3.2 Validation of the parametric model
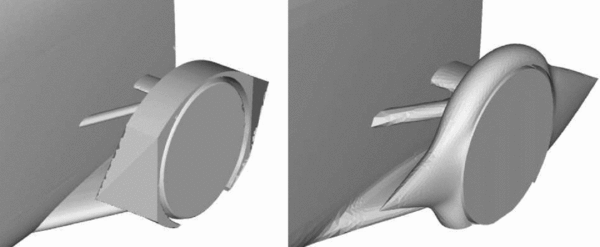
The parametric model needed to closely mimic the aerodynamic behaviour of the full-fidelity model to be suitable for basing design decisions on, particularly in the region of the fairing. To assess the validity of the parametric model, its performance in the flow was compared to the full-fidelity model with the aforementioned baseline wheel fairing attached. This baseline fairing model featured smooth, continuous surfaces and far more accurate modelling of the struts and connections between the fairing and the fuselage. The parametric model, in contrast, features rough simplifications and sharp edges. These differences are illustrated in Fig. 9.
Comparison of the parametric fairing geometry (left) with the full-fidelity fairing geometry (right).
After conducting a CFD study on both models at a Mach value of 1.3, the lift and drag coefficients (CL and CD) were compared with the full-fidelity geometry CFD predictions. The differences in lift and drag characteristics between the two models are shown in Table 1.
Comparison of full-fidelity and parametric model CFD force coefficient predictions for baseline model at M∞ = 1.3

It is clear from Table 1 that the there is a discrepancy between the predicted CL and CD of the parametric and full-fidelity models. However, when the aerodynamic characteristics of the two fairings were compared, it was found that the parametric model was the characteristics of the flow phenomena predicted were similar. This is illustrated by the flow visualisation depicted in Fig. 10. A plane parallel to the ground raised to a height approximately equal to the vertical midpoint of each fairing was cut through the flow field. The coefficient of pressure was then mapped across it. Both models predicted a detached bow shock of similar strength and shock angle, secondary shock inboard of the fairing close to the ‘throat’ and downstream inboard and external expansion fans (albeit stronger and larger in extent on the parametric model). Due to the similarities in key flow features around the fairings, it was deemed reasonable to assume that optimising the parametric model would result in improvements that would also translate back to a full-fidelity model.
A cut was made parallel to the ground plane through (a) the parametric fairing, and (b) the full-fidelity fairing, to show the similarities in the pressure coefficient field surrounding them at M ∞ = 1.3. The cut planes were made at the same height from the ground, and as a result the parametric fairing appears to not come to a point on each end. Note that neither the jet nor rocket efflux is simulated in the parametric model.
4.0 PRELIMINARY STUDY: OPEN FAIRING VS CLOSED FAIRING
The DoE optimisation process did not provide scope for optimising the Static Central Hub (SCH) of the fairing due to how closely the SCH hugged the shape of the wheel. There was little opportunity to alter the geometry of the SCH. However, one opportunity to do so involved removing the upper-most part of the SCH, exposing the top of the wheel to the flow. The aerodynamic reasoning for this was to analyse whether the benefits of a reduction of the frontal area presented to the oncoming flow would outweigh the negative effects of having the rotating wheel exposed to the counter-directional supersonic flow. Before beginning the full DoE process, a preliminary study was conducted to select the better of the two configurations referred to in this paper as the closed and open fairings. The geometric differences between the closed and open fairings are illustrated in Fig. 11. To conduct the preliminary study, two versions of the parametric geometry were created. These geometries both featured identical leading and trailing tips, with the only difference being the inclusion or exclusion of the top of the SCH.
A flow visualisation of the closed fairing (top image) and open fairing (bottom image) configurations is shown at a freestream Mach value of 1.3 and a Reynolds number of 30 × 106. The colour gradient shows how the dimensionless coefficient of pressure varies across the fairing and ground plane. Notable features include a high-pressure gradient on the ground plane, indicative of a bow-shock wave upstream of the fairing.
For further insight into the flow behaviour, Fig. 12 shows how pressure is distributed on the ground plane along a line that runs on the ground plane from approximately 1 metre upstream of the leading tip, directly underneath the fairing. This plot indicates a higher pressure exerted on the ground plane ahead of the open fairing configuration when compared to the closed configuration. The coefficient of pressure is mapped across both fairing configurations. Both fairings induce similar effects on the flow, as would be expected of two fairly similar geometries; however, there are some notable differences. The high-pressure region upstream of the fairing denoted by the large red area on the ground plane in Fig. 11 is indicative of the expected bow-shock wave caused by the fairing. This shock is stronger and occurs farther upstream in the case of the open fairing, as graphically represented by Fig. 12 and visually illustrated by Fig. 11.
A plot of the pressure exerted on the ground plane directly under the wheel fairing for both the open and closed fairing, starting from roughly 1 metre upstream of the leading tip. The fairing is shown faintly in the background for reference.
The total integrated aerodynamic coefficients for the closed and open fairings are presented in Table 2. The result shows that the closed fairing achieved a 4.6% reduction in supersonic CD compared to the open fairing. This would indicate that any drag penalties incurred by the additional frontal area of the closed fairing were outweighed by the benefit of preventing the top of the wheel interacting with the flow. This decision was compounded by the multi-disciplinary benefits of a closed fairing; the closed fairing would be structurally more rigid and therefore less susceptible to unwanted vibration and aeroelastic effects. The preliminary study concluded that the closed fairing configuration would be carried forward to the optimisation stage of the study.
Drag coefficient comparison of open and closed fairings

5.0 DESIGN OF EXPERIMENTS PROCESS
In this study, the fairing is parameterised such that the parameters that define the fairing geometry are the inputs to the CFD model, and the simulated aerodynamic behaviour determines the objective function value.
The DoE process for the optimisation study presented in this paper was broken down into the following stages:
A. Selection of the design parameters and constraints
B. Formulation of the objective function
C. Sampling of the design space
D. Creating a response surface of the objective function
E. Minimising the objective function for an optimal solution
5.1 Selection of the design parameters and constraints
In any optimisation problem, the optimum design parameters are those which minimise the objective function under consideration. In the case of this study, the design parameters were the dimensions  $\phi _1\text{ to }\phi _6$ that were defined earlier in the paper (Section 3.1). A set of these design parameters defines a full, unique fairing geometry that could be investigated with CFD simulations.
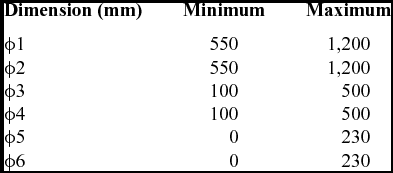
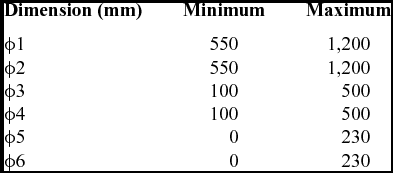
The constraints of the design variables were dictated by multi-disciplinary engineering considerations. For example, ϕ2 was limited to prevent the trailing point from extending into the region of the jet efflux at the rear of the vehicle; likewise, ϕ1 was limited to avoid over-extending the leading point to the extent that lack of rigidity would translate to undesirable structural vibration or aeroelastic effects. The full set of limits for the dimensions is detailed in Table 3 with reference to Fig. 8.
Constraints placed on the parametric design space
5.2 Objective function
The primary focus of this study was to minimise the aerodynamic drag caused by the rear wheel fairing. The most direct approach to achieve this was to optimise considering only the total integrated aerodynamic drag. An objective function based solely on aerodynamic drag is represented as,
 $$\begin{equation}
f(\phi _1,\phi _2,\phi _3,\phi _4,\phi _5,\phi _6) = C_D = D/q_{\infty }
\end{equation}$$
More involved approaches, however, were conceivable; objective functions that accounted for the lift and lateral aerodynamic forces produced by the fairing would give even more insight into how changes in the geometry affect the aerodynamic characteristics of the fairing. This would allow for even greater tailoring of the fairing to the needs of BLOODHOUND SSC. For example,
 $$\begin{equation}
\begin{array}{ c c l}f(\phi _1,\phi _2,\phi _3,\phi _4,\phi _5,\phi _6) &=& C_D + \alpha C_L \\
& = & D/q_{\infty } + \alpha L/q_{\infty } \end{array}
\end{equation}$$
Prior to this study, BLOODHOUND underwent optimisation based on CFD experiments conducted with the baseline wheel fairing(6-8). As a result, it was decided that it would be valuable to measure how greatly the lift force incurred by the optimised parametric fairing deviated from the lift incurred by the baseline fairing. An example of an objective function that would represent this is,
 $$\begin{equation}
f(\phi _1,\phi _2,\phi _3,\phi _4,\phi _5,\phi _6) = C_D + \alpha \left| C_L - {C_L}_{baseline} \right|,
\end{equation}$$
where α again represents an arbitrary weighting factor, and the normalised lift term with the subscript of ‘baseline’ denotes the total integrated lift produced by the vehicle model with the baseline fairing configuration.
It was concluded that multiple objective functions would be investigated: one based purely on drag, as described in Equation (7), and one that considered both drag and lift, as described in Equation (9).
5.3 Sampling of the design space
The design space is the six-dimensional Cartesian space defined by the six design parameters and their associated constraints. This design space was sampled by conducting CFD experiments on fairings defined by sets of parameter values.
Based on previous experience with simulations conducted on similar-sized meshes with FLITE3D, a goal of conducting 60 CFD simulations was set, thereby sampling 60 points in the design space. Based on this restriction, several experiment designs were considered and rejected. For example, a classical factorial experiment design would require 36 = 729 sampling points for an experiment with six design parameters(Reference Narayanan and Iyengar35). Ultimately, the Latin Hypercube Sampling (LHS) technique first described in 1979 by McKay(Reference McKay, Beckman and Conover36) was employed. The LHS technique is capable of generating sets of parameter values for multi-dimensional design spaces that are more effectively spread than if they were selected at random(Reference Stein39).
The sets of parameter values, normalised between zero and one, are shown in the Appendix. The resulting total integrated aerodynamic force coefficients are given for each fairing. Note that some of the design space positions resulted in solutions for which a sufficiently converged steady-state solution was not possible. These positions were therefore left out of the sampling used to construct the DoE response surface.
5.4 Response surface modelling
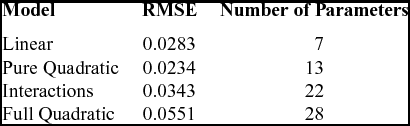
Response Surface Modelling (RSM) is a statistical technique first described by Box and Wilson(Reference Box and Wilson37) to define relationships between multiple input variables and one or more response variable. Response surfaces were fitted to the data collected from the CFD experiments using the rstool in the MATLAB statistics toolbox(38). The resulting Root Mean Square Errors (RMSEs) of the CD fit for each of the available models is presented in Table 4 along with an indication of the number of free parameters used in each model.
Comparison of the errors in the response surface models for f = CD
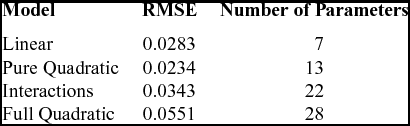
The linear model was selected as the basis for the optimisation since, despite having a slightly higher RMSE, the predicted error at the point of minimum drag was lower than in the pure quadratic model. The generated linear response surface model function was
 $$\begin{equation}
\begin{array}{c c l}C_D & = & f(\phi _1,\phi _2,\phi _3,\phi _4,\phi _5,\phi _6) \\
& = & 1.0009-0.0334\phi _1-0.0102\phi _2 \\
& &+\, 0.0024\phi _3-0.0164\phi _4 \\
& &+\, 0.0254\phi _5+0.0217\phi _6 \end{array}
\end{equation}$$
Figure 13 shows predictor plots for each of the six design space parameters centred on the middle of the design space. The red lines indicate upper and lower 95% confidence bands. Note that gradients of these plots give a measure of how important each of the six parameters is in determining the supersonic fairing drag. It suggests that ϕ1, the leading spike length, ϕ3 the height of the leading spike tip, and ϕ4, the height of the trailing spike tip from the ground, are the most important in controlling the fairing drag, whereas drag is insensitive to ϕ2 the trailing spike length.
Predictor plots for each design parameter centred on the middle of the design space showing predicted D/q against normalised parameter position. Red lines indicate upper and lower 95% confidence bands.
Despite these useful insights, it was decided, that the errors in the response surface were too large, particularly at the edges of the design space. Linear response surfaces will always have a minimum at the edge of the design space. An alternative approach for interpreting the sampled data that would require minimal CFD runtime was sought.
6.0 NELDER–MEAD OPTIMISATION USING RBF INTERPOLATION
6.1 RBF interpolation
A Radial Basis Function (RBF) is a real-valued function whose value is dependent solely on the scalar Euclidean distance of the argument from a defined centre such that:
 $$\begin{equation}
\psi (r)=\psi (\left|x-x_i\right|),
\end{equation}$$
where r is the Euclidean distance between xi and x, which are the position of the centre, and the position for which the interpolated value is to be found, respectively. RBFs are particularly well suited for interpolating in cases of high dimensionality with scattered sampling points(Reference Buhmann40). This makes RBFs particularly suitable for this study, which had generated data at sampling points determined by LHS across a six-dimensional design space.
There are a range of RBF types and the following are popular choices:
• Gaussian: ψ(r) = e −θr 2
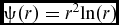
• Polyharmonic spline: ψ(r) = rk, k = 1, 3, 5. . . or ψ(r) = rkln(r), k = 2, 4, 6. . .
• Thin Plate Spline:
$\psi (r)=r^2 {ln}(r)$• Multi-quadratic:
$\psi (r)=\sqrt{1+\frac{r^2}{\theta ^2}}$
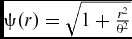
The positive constant θ that features in the Gaussian and multi-quadric RBFs is the shaping parameter. The optimal value for this parameter is estimated by the average distance between the interpolation nodes. A function approximation is then constructed typically of the form:
 $$\begin{equation}
f(x)=p(x)+\sum ^{n}_{i=1}\lambda _i\psi (\left|x-x_i\right|),
\end{equation}$$
where n is the total number of sampled points, xi is the unique centre about which each RBF is associated and λi is the weighting coefficient. The approximation function is augmented by the polynomial p(x), which is of 1 degree less than the RBF itself to ensure a unique solution for the given weighting vector so that p(x) is typically of the form:
 $$\begin{equation}
p(x)=c_0+c_1x,
\end{equation}$$
where c 0 and c 1 are constants that are chosen in conjunction with the values of the weighting vector λi so that the approximation of the function matches the value of the function at the nodes.
The previously listed range of RBF function options were tested, and it was determined that the multi-quadratic option was best at interpolating the CFD drag values at the sample points with minimum error. The tests involved systematically removing sampling point data and then interpolating the objective function at this point using all other sample points.
6.2 Nelder–Mead optimisation
MATLAB’s Nelder–Mead optimisation function, in conjunction with RBF interpolation of the known sample point data, was used to seek an optimum fairing geometry. The Nelder–Mead algorithm requires a starting ‘guess’, and since it suffers from the problem of getting trapped in local minima(Reference Nelder and Mead8), a range of starting points was trialled to establish how sensitive the final ‘optima’ found was to the starting position. It is a well-known property of RBF interpolation that accuracy degradation occurs near boundaries of sampled data. This limited the perceived validity of solutions with ϕ values at extrema(Reference Fornberg, Driscoll, Wright and Charles41). To counteract this, the searchable sample space was restricted to 0.1 < ϕi < 0.9. It was found that the same ‘optimum’ was discovered regardless of start position (implying that the simple CD objective function, Equation (7), did not contain multiple local minima). The convergence criterion used to stop the algorithm was that convergence was assumed when neither the objective function nor design parameter values changed for 100 iterations. The evolution of the drag coefficient and design parameters as a function of iteration number for a starting point at the centre of the design space (i.e. the baseline case) is shown in Fig. 14.
Evolution of CD (top) and design space parameter values (bottom) with Nelder–Mead iteration number for a starting position at the centre of the design space.
The supersonic drag coefficient reduces from the baseline value of 1.04 to 0.979, a reduction of 6%. It is interesting to note that these results are broadly in agreement with the indications given by the simple DoE study. When compared with Fig. 13, the parameters identified as being likely to have a strong influence on drag are indicating the sense in which they influence drag correctly. For example, the DoE indicated that the a large leading spike length, ϕ1, is likely to have positive influence on drag minimisation and the Nelder–Mead optimisation validates this. Also, the DoE indicated that both low leading- and trailing-edge offset values were likely to result in minimum drag, and this, too, is corroborated in the results of Fig. 14. The increased complexity that is captured in the RBF inter-polation allows the optimiser to find the exact position of the optimum in the design space rather than just being pushed to the design space limits, as was the case with the linear response surface in the DoE study.
Having constructed the geometry resulting from the predicted optimum design space position and run a CFD simulation at this new point in the design space, it was verified that the RBF interpolation of the CFD prediction supersonic drag coefficient was within 1% of the RBF interpolation value. The optimum geometry and Mach 1.3 pressure distribution across it is shown in Fig. 15 compared with the baseline case.
Comparison of the (a) baseline and (b) minimum drag optimum pressure distribution at Mach 1.3.
Figure 16 shows pressure coefficent plots at constant z (horizontal) cuts through the flow domain in the vicinity of the rear wheel fairing for the baseline fairing geometry and minimum drag optimum. Note that on the ground plane, the optimised fairing has resulted in the focus of compression downstream of the fairing’s bow shock has been shifted in board (towards the car). Above the ground plane, the strength of the bow shock has been reduced, which is one of the contributing factors towards the drag reduction. Also, it is evident that the extension of the rear spike in the optimised configuration gas reduced the strength and extent of both the inboard and outboard expansion fans which will also contribute to the drag reduction.
Comparison of baseline (a,b,c,d) and optimum (e,f,g,h) pressure coefficient plots at constant z (horizontal) slices through the domain in the vicinity of the rear wheel fairing. Note that z = 0.0 represents the ground plane and that the wheel contact patch can be observed in plots (a) and (e).
The optimum minimum drag geometry had a lift coefficient of 0.172, 50% lower than the baseline value. This is due to a more pronounced high-pressure zone sitting above the ‘delta’ suspension strut, which is evident in Fig. 15. Although this study was focussed on drag minimisation, it was also decided to be beneficial to not adversely affect the lifting behaviour of the rear wheel and suspension system. Therefore, the optimisation was reconsidered with an objective function formulated such that there was a penalty incurred in changing the supersonic lift coefficient from the baseline model lift coefficient (Equation (9)). The alpha parameter in Equation (9) controls the extent to which the design case is penalised for having a supersonic lift coefficient that is different to the baseline case. When alpha is zero, this is not considered and it is simply drag that is being minimised, and as it is increased to unity, equal weighting is given to drag and lift variation. The effect of taking lift variation into account on the optimum design space position is shown in Fig. 17.
Variation in predicted optimum parameter values as a function of α in the objective function.
It is evident from Fig. 17 that if the requirement to keep the supersonic lift response of the rear fairing geometry similar to the baseline characteristics is strongly enforced, then this requires shifting from the simple minimum drag optimum geometry. In particular, the results in Fig. 17 suggest that in order to minimise drag with minimum influence on lift, then the trailing-edge spike length should be minimised rather than maximised and the trailing spike offset distance increased rather than decreased. This could be because these parameters have a much stronger influence on the lifting characteristics of the geometry than the drag characteristics of the geometry.
Ultimately, it was decided that drag minimisation was more critical than the lifting behaviour (since the vehicle has winglet trimmers to account for lift response variations), so the final design for installation on the BLOODHOUND SSC vehicle was that in optimum shown in Fig. 15.
7.0 EFFECT ON PREDICTED MAXIMUM SPEED
In order to understand the potential impact of the drag reduction indicated by this optimisation study on the performance of the overall vehicle, a pre-optimisation and post-optimisation comparison was undertaken using the vehicle performance model (described in Section 1.3) with all pre-optimisation parameters in the model held constant except supersonic vehicle drag coefficient. This was reduced from the pre-optimisation value by twice the reduction seen in the optimisation study (since there are two rear wheels on the vehicle).
Figure 18 shows that the level of drag reduction achieved in this study equates to an increase in maximum vehicle speed of approximately 40 mph, with an accompanying track length requirement increase of approximately 0.3 miles with all other influencing variables held constant. Therefore, it has the potential to be a critical factor in the success, or otherwise, of the BLOODHOUND project in achieving its 1,000 mph LSR.
Indication of the likely impact on overall vehicle behaviour in terms of maximum speed achieved and track requirement reduction as a result of the fairing optimisation.
8.0 CONCLUSION
This paper has described the CFD-based optimisation process used to design the rear wheel fairing of the Land Speed Vehicle BLOODHOUND SSC. Initially, a DoE and response surface approach was used to gain an understanding of how the primary objective function, supersonic drag coefficient, varied across the design space. This was followed by a Nelder–Mead optimisation using RBF interpolation. The combination of these two techniques resulted in an enhanced understanding of the underlying aerodynamic phenomena responsible for the optimum design. The work ultimately indicated that a 6% supersonic drag reduction from the baseline fairing design was possible with a potential impact on the maximum speed of BLOODHOUND SSC being increased by approximately 40 mph.
ACKNOWLEDGEMENTS
The authors gratefully acknowledge the support of HPC Wales and Fujitsu for provision of computational resources which has made this work possible, and the BLOODHOUND SSC design team for their engagement and advice.
APPENDIX: POST-PROCESSED CFD RESULTS FROM THE 58 VALID GEOMETRIES RESULTING FROM THE 60-POINT LATIN HYPERCUBE DESIGN SPACE SAMPLING