


Introduction
Reconstructing the growth and decay of the Antarctic ice sheet in response to the climatic signal remains one of the main challenges to the earth science community and can be considered a key issue for understanding past and future global change. Field evidence for this comes from two dilfcr-ent sources. The first consists of the pure climatic evidence, provided by the glaciological community and obtained mainly by means of ice-core drilling near the center of the ice cap. These data provide us essentially with variations in temperature, mass balance, air and ice composition in the time domain. The second source is provided by the earth science community and encompasses the geological evidence, offshore mainly by seismic stratigraphy and onshore by géomorphologie evidence in the ice-frcc areas such as the coastal oasis and the marginal mountain ranges. These data indicate the spatial variations of the ice sheet in both altitude and extent, and time variations can also be inferred. However, the proxy record of onshore Glaciol-geological observations shows former higher glacier stands only, since signs of lower glacier stands are obliterated by the present ice cover.
Climatic change, as recorded in ice-core data, and Glaciol geology are not directly linked. The glacier or ice sheet translates the climatic signal to Glaciol-geological evidence. This relationship, which we call the glacier transfer function (GTF), is not always linear. Other factors, such as interactions of the ice sheet with the ocean, basal hydraulics and internal ice dynamics, add complexity to the GTF. All too often in the past, climatic variations (ice ages) were inferred directly from geological evidence, neglecting these complex interactions (e.g. Reference HollinHollin, 1962; Reference Denton and HughesDenton and Hughes, 1981). Today dynamic modeling is capable of providing physically sound constraints for the deduction of icc-shcet variations from observations made on ice divides and in marginal areas.
The aim of this work is to reconstruct the dynamic behavior of the East Antarctic ice sheet, particularly in Dronning Maud Land, over the last 200 000 years, based on numerical ice-sheet modeling. Due to the uncertainties in boundary conditions of the ice-sheet system, an experimental framework is presented in order to determine possible GTFs linking the climatic signal to the proxy record of Glaciol-geological observations.
Location map of Antarctica, showing the Asuka drainage basin and the flowline through the Ser Rondane Mountains. a-d denote reference points along the flowline.

Field Evidence
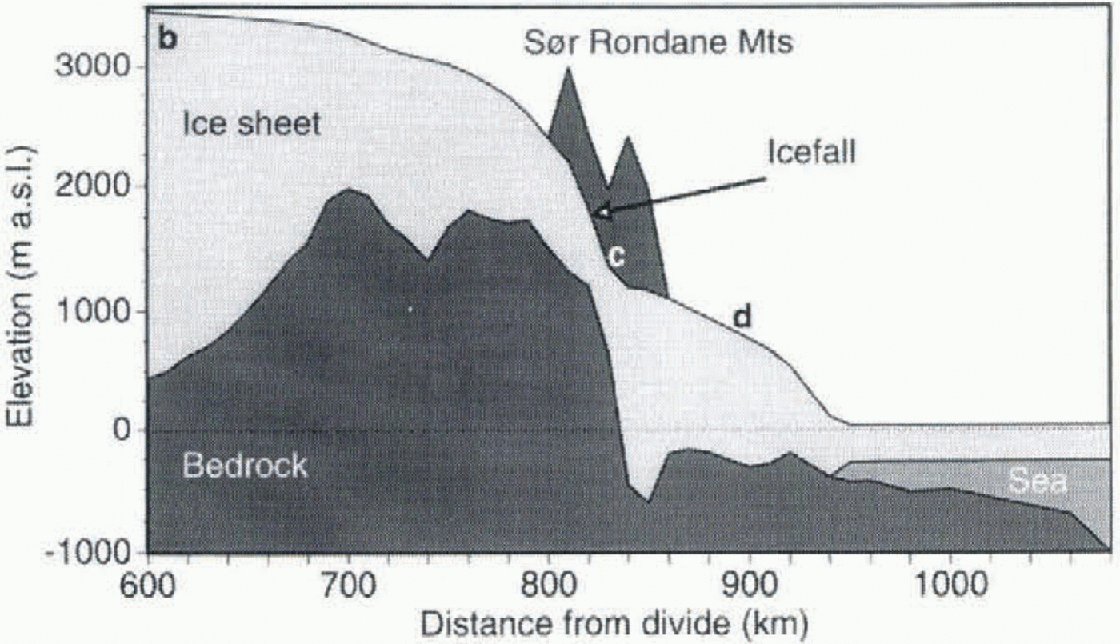
The studied drainage basin is situated in east Dronning Maud Land, East Antarctica, and covers the inland plateau, a marginal mountain range (the Sor Rondane Mountains) and the coastal area (Fig. 1). The Sor Rondane Mountains are a 200 km long mountain range, approximately 100 km from the present coast, and form part of a scries of mountain ranges surrounding the East Antarctic continent. Although the mountains block ice flow, at some places large outlet glaciers cut through the range.These outlet glaciers are characterized by steep surface slopes at the entrance of the mountain range (icefall). At the foot of the icefall, the ice surface becomes relatively flat as glaciers flow in overdeepened valleys. Ice thickness in this area is of the order of 2 km. Between the mountains and the continental shelf edge, bedrock lies beneath sea level, and some sub-Glaciol trenches occur (Fig. 2).
Present surface and bedrock profile of the flowline through the outlet glacier Gjelbreen. Only the part between 600 km from the ice divide and the edge of the continental shelf is displayed. b~d denote reference points along theflowline.
Based on cosmogenic surface-exposure-age dating of in situ rocks at some places in the Sor Rondane, linked to the degree of weathering of till, Reference Moriwaki, Hirakawa, Hayashi, Iwata, Yoshida, Kaminuma and ShiraishiMoriwaki and others (1992) tried to reconstruct from pure géomorphologie evidence the Glaciol history of the range. They found that during the last Glaciol-interglaciol period, the maximum ice-sheet expansion was only a few meters to a few tens of meters higher than the present glacier surface. They postulated therefore that during this period only minor glacier variations occurred.
The Ice-Sheet Model and Boundary Conditions
As a methodology for investigating past ice-sheet variations we used dynamic flowline modeling. The numerical ice-sheet system model predicts the ice-thickness distribution along a flowline in space and time in response to environmental conditions, based on calculation of the two-dimensional flow regime (velocity, strain-rate and stress fields) as well as the temperature distribution in the ice sheet and in underlying bedrock. Furthermore, the model is extended with isostatic bedrock adjustment and an ice-shelf model as the outer boundary condition. A complete description of the model is given in Pattyn and Decleir (1995a) and Pattyn (1996).
A solution to the velocity field is obtained through vertical integration of the constitutive equation for the flow of ice, in this case Glen's flow law with exponent N = 3. A basal boundary to this flow field is formed by zero basal drag in the ice shelf and a relation for basal motion in the grounded ice sheet, where a common sliding-type relationship was chosen:

where  and N are the shear stress and effective normal stress, respectively, at the ice-sheet base, and As
is a constant basal flow parameter.
The flow of ice sheets also depends on the ice temperature, which enters the constitutive equation through the flow parameter A(T*) and obeys the Arrhenius relationship (Reference PatersonPaterson,1994).
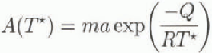
where m is a tuning parameter which takes into account un-known factors such as crystal fabric, impurity content, etC. The other parameters are defined in Pattyn (1996). T* is obtained from the second evolution equation, i.e. the thermodynamic equation, which relates ice-temperature change in time to physical processes such as vertical diffusion, horizontal and vertical advection, and friction (see Pattyn, 1996). Boundary conditions to this equation form the surface temperature at the lop and geothermal heating at the base of the ice sheet, the latter written as a temperature gradient.
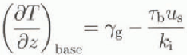
where  is the geothermal heat entering the ice expressed as a temperature gradient, and the second term on the righthand side is surplus heat caused by basal motion, ki
is the thermal conductivity of ice (k
i= 6.63 X 10⁷J m −1 K−1a−1). Geothermal heating can take two forms, depending on whether heat conduction in the bedrock below is considered.
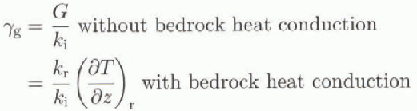
where G =-54.6 mWm−2 is the geothermal heal flux corresponding to 1.30 HFU (heat flow units; Reference Sclater, Jaupart and GalsonSclater and others, 1980) and kr is the thermal conductivity of rock (Jkr = 1.041 X 10⁸J m−1K−1a−1; Reference Turcotte and SchubertTurcotte and Schubert, 1982). For calculating heat transfer in the underlying bed, only vertical diffusion is considered in a rock slab of 2000 m thickness divided into five equally spaced layers (see Huybrechts, 1992). in some experiments described below, A(T*) was kept constant over the whole domain (isothermal case, i.e. no thermomechanical coupling considered). A(T*) is then determined from Equation (2) for a given isothermal ice temperature T* and by keeping m= 1.0.
The ice-sheet model is numerically solved on a fixed grid in space and time, i.e. a flowline from the ice divide (Dome F) to the edge of the continental shelf, which forms the maximum possible lateral extension of the ice sheet, with a horizontal grid-size spacing of 10 km, 30 layers in the vertical, and a time-step of 10 years.
The primary inputs for the model are bedrock and ice-surface profiles along a flowline (Fig. 1). Data were sampled from the oversnow traverses carried out in east Dronning Maud Land (Reference Ageta, Nishio, Fujii, Moriwaki and HigashiAgeta and others, 1995; xReference Nishio, Uratsuka, Ohmae and HigashiNishio and others, 1995; Pattyn and Decleir, 1995b). A flowline was drawn starting at Dome F, entering the Sor Rondane Mountains through the outlet glacier Gjelbrccn, continuing north to the coast, and then beyond to the edge of the continental shelf (Fig. 2). Gjclbreen cuts along the 25° E meridian through the Sor Rondane Mountains in a south north direction.
Present surface-tcmperalurc and mass-balance distribution were adopted from Satowand Kikuchi (1995), based on measurements in east Dronning Maud Land. However, for the mass-balance distribution two dataseis were compiled, one regional dataset (the whole east Dronning Maud Land area I and one local datasel ( Asuka drainage basin).The latter takes into account the reduced accumulation in the Sor Rondane Mountains, which act as an ablation window with in the accumulation area of the Antarctic ice sheet I Fig. 3).
Present surface-temperature and mass-balance distri-bution used in the modeling experiments and plotted as a function of surface elevation. Two mass-balance dataseis are given: a local set taking into account the reduced accumulation in the mountain range and the coastal area as observed in the field, anda regional set takenfrom measurements all overcast Dronning Maud Land, a-d denote reference points along the flowlint (see figs 1 and 2).

For the palco-experiments surface temperature is perturbed by changes in background temperature according to the Vostok signal (Fig. 4; Reference JouzelJouzel and others, 1993) and by local changes in surface elevation. Changes in surface temperature also affect accumulation rates. For the changes in mass balance we followed Reference LoriusLorius and others (1985) and Huybrechts (1990). Several datasets of euslatic sea-level change are available. We opted for two commonly used records as sea-level forcing functions: the benthic oxygen-isotope record and the New Guinea record, estimated from marine terraces (Reference ShackletonShackleton, 1987). The difference between these records is mainly reflected in their amplitude (Fig. 4).
Experimental Framework
Most modeling studies define a so-called reference experiment or standard run, in which the ice sheet is run in a steady state under present environmental conditions, and the free parameters are tuned to obtain a good fit with the observations. This progressive tuning results in one model solution that closely matches the observations. However, other solutions are possible. Consider, for example, two points (observations) through which we would like to fit a parabolic equation (model). in principle, an infinite number of solutions is possible. If we fix the coefficients of the parabolic equation and alter them progressively to achieve a match with the two observation points, we will obtain a single solution. However, if we consider the coefficients to lie between c ertain error bounds and calculate all possible parabolic curves, we might obtain several solutions. More than one model construction can thus produce an output which conforms with the observations, a situation that is referred to as non-uniqueness (Reference Oreskes, Shrader-Frechette and BelitzOreskes and others. 1994).
Background temperature signalfrom the Vostok ice core (after Jouzel and others, 1993) (upper panel), and eustatic sea-level changes used for model forcing (after Shackleton, 1987) (lowerpanel).

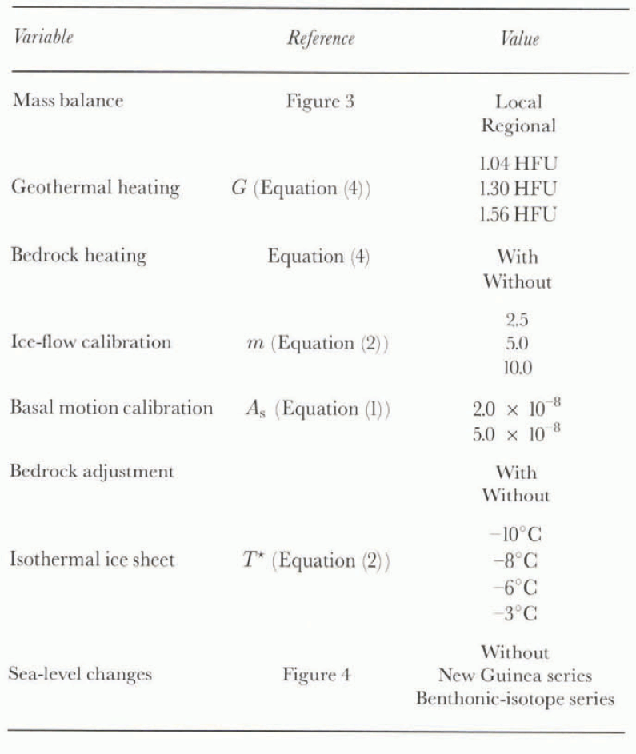
In view ofihe large number of degrees of freedom of the ice-shect model and hence the large number of boundary conditions to be specified, a wide range of model simulations was conducted under different boundary conditions and their combinations, and compared with both Glaciol-geological records and glaciological data concerning present ice-sheet topography and surface velocity. Basically we considered that (i) the present ice sheet is not in steady state; and (ii) the values for boundary parameters as taken from literature (to obtain a “standard run") are only approximate values and cover a large range of values. Each model experiment is a two-fold process. First, a steady-state ice sheet at 200000 BP is established starting from ail ice-free bedrock topography isostatically adjusted to the removal of the present ice load. This steady state is obtained after approx-imately 250 000 years under boundary conditions prescribed by the specific experiment, and environmental conditions taken as the mean over the last 200 000 years. These mean conditions correspond to a background temperature drop of -5.2°C and a sca-level lowering of 50 or 70 m for the New Guinea and benthic-isotope datasets, respectively (Fig. 4). For the experiments where sea-level forcing was ignored, sea level remained at 0 m during the steady-state model run. Second, the model is run forward in time, forced by changes in background temperature and sea level. The boundary conditions (or free parameters) include a number of different sets for the present surface mass balance and sea-level forcing, inclusion/exclusion ofbedrock heating and iso-static adjustment, and different values for parameters related to ice rheology, basal sliding and geothermal heat flux (table 1). in total, 204 experimental runs were carried out, comprising 102 steady-state runs and 102 paleoclimatic forcings, each with a different combination of boundary conditions.
List of variables and changes in boundary conditions for the numerical simulations. in the isothermal case, m = 1 and both bedrock and geothermal heating lose their meaning as boundary conditions
Determination of the Gtf
The 102 paleoclimatic scries were evaluated by three external controls in order to determine the possible GTFs. Two of the three control datasets relate to the present conditions of the ice sheet as observed in the field and are compared with the model result after 200 000 years integration in time. A first control is the maximum glacier surface velocity in the mountain range at 0 BP (on the slope of the icefall) rom-pared to the observed value of ±65 m a−1. A second control is the root-mean-square (rms) error between the modeled surface elevation in each gridpoint along the flowline at 0BP compared to the presently observed glacier profile. The third set relates to the history of the ice sheet, i.e. past Glaciol maxima determined from exposure ages of in situ rock at different heights above the present glacier surface. Experiments were accepted when the following three conditions were fulfilled: (i) a maximum surface velocity of 65 ± 15 m a−1; (ii) a surface-profile rms error of < 150 m; and (iii) a maximum paleo-glacier stand (over the last 200 000 years) of < 100 m. Although these limits appear rather large, only 24 experiments out of 102 were retained. in these 24 experiments not all values of boundary conditions and combinations (table 1) are represented. Boundary-condition settings that were not accepted in the process were (i) experiments without bedrock heating, (ii) ice-flow calibration m — 2.0 or rn = 10.0, (iii) basal motion calibration As = 5.0 X 10⁻⁸, and (iv) sea-level changes according to the benthic-isotope record. That none of the 24 retained experiments were driven by the benthic series is due to the large amplitude of this signal. It produces a substantial grounding-line migration (waxing and waning), and hence results in a large surface-elevation change in the mountain area, which docs not conform to the Glaciol-geological record. Although the retained experiments encompass both types of mass-balance dataset (local and regional), it seems that the local mass-balance type, i.e. with reduced accumulation in the mountain area, results in a better agreement with the glaciological and Glaciol-geological observations. This supports the idea that the Sor Rondane Mountains form a so-called ablation island with in the Antarctic ice sheet.

After careful analysis of the 24 GTFs, we classified them in two major groups or scenarios, each characterized by a distinctly different history of glacier surface variations with in the mountain range. The dilference between the scenarios seems to be mainly related to the thermomechanical proper-tics of the experiments. The best-fit GTFs of each group, i.e. those experiments which are in best agreement with both glaciological and Glaciol-geological observations are: Scenario 1: with bedrock heating; G = 1.30; m = 5.0; local mass-balance type; As = 2.0 X 10 −8; with isostatic adjustment; without sea-level changes.
Scenario 2: isothermal ice sheet; T* = -6°C (for m = 1.0); local mass-balance type; A S = 2.0 X 10 −8; with isoslatic adjustment; without sca-lcvcl changes.
These two scenarios are displayed in Figure 5, i.e. by means of the response of the ice-sheet surface variations at the ice divide (fig. 5a), in the plateau area upstream of the mountains (fig. 5b). the glacier area with in the mountains (fig. 5c) and the coastal ice sheet downstream of the mountains (fig. 5d). Near the ice divide, the two scenarios display the same trend (fig. 5a): a maximum ice-sheet expansion of 15-20 m higher than present around 115 000 BP, which is almost 15 000 years later than the penultimate climate optimum, then a gradual surface lowering to reach a minimum 40-60 m lower than present at about 15 000 BP, followed by a rapid rising. According to Figure 5, the surface at the ice divide is at present still rising in response to the climatic signal. This picture is in agreement with the analysis of Lorius and others (1984) andjouzel and others (1989) that for central parts of Antarctica the Fast Glaciol Maximum ice sheet was thinner than the present ice sheet.
In the plateau area (fig. 5b), the two scenarios also display a similar behavior, although the ice sheet reacts faster to the climatic signal than at the divide, so that at present the ice surface is lowering instead of rising. Closer to the mountains and on the glacier itself (fig. 5c), a remarkable differentiation between the two scenarios is observed. According to scenario 1, minor glacier-surface variations occurred over the last 160 000 years, of the order of 15-20 m. The present glacier surface is thereby close to its lowest position of the last 100 000 years. According to scenario 2, however, glacier-surface variations are more pronounced (40-60 m), but the present ice-sheet surface is close to its highest position of the last 100 000 years. It seems, furthermore, that according to scenario 1 the ice-sheet surface gradually rises between interglaciols, while according to scenario 2 the surface gradually lowers and quickly rises when surface temperatures increase at the end of the Glaciol period. This leads to two completely different interpretations of the Glaciol history in the Sor Rondanc, which win be discussed in detail below.
Finally, in the coastal zone (fig. 5d), the scenarios are quite similar, with an amplitude of ice-shect surface varia-lions of 40-60 m. in both cases, the ice-sheet surface is at present still lowering and close to its minimum position of the last 100 000 years. The high-frequency oscillations between 80 000 and 120 000 BP in scenario 2 (fig. 5d) are due to minor numerical instabilities. They are only encountered near the grounding-line area.
Discussion
Scenario 1 confirms the idea postulated by Moriwaki and others (1992) that only minor ice-surface variations occurred in the Sor Rondane during the last glaciation. This certainly docs not imply that the interior or the coastal ice sheet experienced small variations as well. According to the model experiments, surface variations of the order of 60-80 m are to be expected in the interior, and of 40-60 m in the coastal area. Lateral variations of the ice sheet, i.e. waxing and waning of the grounding line over the continental shelf, are minimal (<60km). This global picture of ice-shect variations in the interior as well as in the coastal area is confirmed by both scenarios. The major differentiation between the scenarios seems restricted to the mountain area. According to the isothermal scenario, glacier surface variations here are not minimal, but well pronounced with an amplitude similar to other areas with in the ice sheet, i.e. 40-60 m. Another striking feature relates to the timing of events: Glaciol maxima observed from scenario 2 occur 5-10ka later than those observed from scenario I. This phase difference in response pattern is most pronounced with in the mountain area.
For the isothermal case (scenario 2), glacier surface variations with in the mountains respond mainly to variations in surface mass balance. The relatively large response times to the climatic signal are due to low accumulation in this area and explain win The present ice surface is close to its maximum. However, when thermomechanical coupling is introduced in the model set-up (scenario 1) the eflect of stiffening and softening of ice is taken into account. While basal temperatures south of the Sor Rondane and on the highest ice slope of the glacier are generally low, pressure-melting point is reached at the glacier's bottom further downstream. This softer ice influences the ice lluxes in a dilferent way than the stiffer ice upstream and also affects the response time to the climatic signal. The combined effect of ice thermo-mechanics and response to surface-temperature and mass-balance changes results in this locally aberrant behavior with in the mountain area. A more rigorous examination to the effect of marginal mountains on ice dynamics of large ice sheets will be given in a subsequent paper.
It is clear from these model simulations that the proper determination of a GTF is essential in the reconstruction of the Glaciol history. The Glaciol history of ice sheets cannot be derived from geomorphological data alone, without taking care of the physics behind the Glaciol system.That at present two interpretations of geomorphological data can be given is due not so much to model incapability as to a lack of observations. For instance, excluding the glacier velocity data for comparison in the analysis might even lead to more than two possible GTFs. Further fieldwork should therefore help to narrow the gap between the observed and the simulated.
Conclusions
lu lilis paper we have attempted to present a modeling framework capable of disentangling the regional Glaciol history of the Fast Antarctic ice sheet in a consistent way. The analysis demonstrated that, depending on the choice of boundary conditions, different scenarios are expected to conform with both the present glaciological observations and the Glaciol-geological proxy record of exposure ages of in situ rocks. However, this marked differentiation is wit-nessed only in the marginal mountain area, with a less pronounced differentiation over the vast ice-sheet interior. The Glaciol history of the Sor Rondane Mountains can thus be interpreted in (at least) two different ways. One interpretation is that only minor glacier variations have occurred during the last 200 000 years, as was concluded by Moriwaki and others (1992), and the present glacier surface is close to its minimum, while the other interpretation is that glacier variations are of the order of 60 m, but that the present glacier surface is close to its maximum elevation of the last 200 000 years. Outside the Sor Rondane, near the ice divide as well as in the coastal area, bold scenarios are in accord and ice-sheel surface variations are of the order of 60-80 m. The main difference between the inland area and the coast is that near the ice divide the ice sheet is at present close to its maximum position, while in the coastal area deglaciation is completed and the ice-sheet surface is close to its minimum.
Acknowledgements
This paper forms a contribution to the Belgian Scientific Research Program on Antarctica (Federal Office for Scientific, Icchnical and Cultural Affairs), contract A4/DD/E03. The authors are deeply indebted to Y. Fujii and K. Moriwaki of the National Institute of Polar Research, Tokyo, Japan for supplying all the data required to carry out this study and for helpful discussions on paleo-reconstructions of the ice sheet in Dronning Maud Land. The paper was substantially improved as a result of comments by R. Powell.



