1. Introduction
The rotating shallow-water model is certainly one of the most significant for modelling two-dimensional large-scale fluid motions in the ocean, the atmosphere and even stellar media (Gill Reference Gill1982; Gilman Reference Gilman2000; Zaqarashvili, Oliver & Ballester Reference Zaqarashvili, Oliver and Ballester2009; Vallis Reference Vallis2017; Zeitlin Reference Zeitlin2018; Zaqarashvili et al. Reference Zaqarashvili2021). It was originally introduced by Laplace in 1775 to address the problem of the dynamical response of the oceans to the tidal forces generated by the Moon. The strength of this model relies on the fact that it focuses mainly on the effects of the Coriolis force, produced by the solid-body rotation of a planet or star at rate  $\boldsymbol {\varOmega }$, on the dynamics of surface waves, without losing much generality. Owing to the curvature of the surface, these Coriolis effects, i.e. the projection of the Coriolis term
 $-2 \boldsymbol {\varOmega } \times \boldsymbol {v}$ on the surface (with
 $\boldsymbol {v}$ the fluid velocity field on this surface), naturally depend on the latitude
 $\theta$, more specifically on the normal component of
 $2 \boldsymbol {\varOmega }$, called the Coriolis parameter, which is
 \begin{equation} f = 2 \varOmega \sin(\theta) \end{equation}
for a spherical body. A hundred years after the work of Laplace, Lord Kelvin used this model (free of tidal forcing) to compute the normal-mode oscillations of a local plane, assuming a constant Coriolis parameter  $f$ (Thomson Reference Thomson1880). He exhibited different kinds of plane-wave solutions, namely the surface gravity (Poincaré) modes, the geostrophic modes (for which the flow is stationary as the pressure gradient is exactly balanced by the Coriolis force) and coastal Kelvin modes which exist only in the presence of a boundary and propagate in one direction. However, this
 $f$-plane approximation is not relevant at the equator, where the parameter
 $f$ vanishes, thus virtually cancelling the Coriolis effects within the frame of this approximation. Rossby bypassed this problem by introducing the so-called
 $\beta$-plane approximation, which amounts to assuming locally linear variation of the Coriolis parameter
 $f$ with latitude (Rossby Reference Rossby1939). This simple approximation led to a qualitatively accurate understanding of many previously observed phenomena in geophysical fluid dynamics, such as the western intensification of wind-driven currents (Stommel Reference Stommel1948; Munk & Carrier Reference Munk and Carrier1950), the oscillations of mid-latitude jets (Rossby Reference Rossby1948) or the equatorial trapping of gravity waves. Using this approximation at the equator with constant
 $\beta = {\rm d} f / {\rm d} y$, where
 $y$ is the meridional distance from the equator, Matsuno computed the spectrum of equatorial waves of the shallow-water model (Matsuno Reference Matsuno1966). This spectrum has a discrete set of low-frequency planetary (Rossby) waves and inertia–gravity waves, plus two branches of modes transiting from the first to the second as the zonal wavenumber
 $k$ goes from negative to positive values, namely the Yanai (or mixed Rossby–gravity) and equatorial Kelvin modes.
However, the equatorial  $\beta$-plane approximation used by Matsuno (Reference Matsuno1966) and Delplace, Marston & Venaille (Reference Delplace, Marston and Venaille2017) (and many other studies of geophysical fluid dynamics) is limited in the sense that it only accounts for the curvature of the surface in the variation of the Coriolis parameter, at linear order, and not in the metric. It thus ignores the existence of the poles, and generates a spectrum of solutions defined on the unbounded domain across the equator, which seems paradoxical. Nevertheless, the solutions are accurate as long as they remain trapped around the equator, in the so-called Yoshida waveguide (Yoshida Reference Yoshida1960; Matsuno Reference Matsuno1966), where the linear approximation holds. The trapping length, called the equatorial radius of deformation, is given by
 \begin{equation} L_{eq} = \sqrt{\frac{c}{\beta}}, \end{equation}
where  $c$ is the speed of surface waves without rotation. Length
 $L_{eq}$ thus needs to be much smaller than
 $R$, the radius of the planet. This condition is satisfied for fast-rotating planets, compared with the time scale of propagation of the waves at their surface. For the first baroclinic mode (i.e. the fastest one) in the equatorial ocean on Earth, the equatorial radius of deformation is approximately
 $300$ km (see e.g. Vallis Reference Vallis2017, p. 304), so the
 $\beta$-plane approximation is quite accurate in this context. However, when it comes to global oscillations of larger scales, both the curved metric and the actual sine variation of
 $f$ with latitude must be taken into account. Moreover, the quantisation of the zonal wavenumber
 $k$ cannot be ignored, especially when the wavelength is not small compared with the radius
 $R$. The full spectrum of shallow-water waves on a sphere is a peculiar problem, as the sphere is an unbounded but finite domain. The eigenvalue problem has no exact solution in the general case; however, it has been extensively investigated through a variety of analytic approaches (e.g. Margules Reference Margules1892; Hough Reference Hough1898; Longuet-Higgins Reference Longuet-Higgins1968; Bridger & Stevens Reference Bridger and Stevens1980; Müller & O'Brien Reference Müller and O'Brien1995; Dellar Reference Dellar2011; Paldor Reference Paldor2015), and the frequencies and wavefunctions can be well approximated with analytical expressions in the different asymptotic regimes. In particular, in the regime
 $L_{eq} \ll R$ (hereafter referred to as the Matsuno limit), the spectrum of equatorial shallow-water waves is well approximated by Matsuno's spectrum and thus clearly exhibits two branches of modes with eastward group velocity transiting through the frequency gap between the different wavebands. (In the rest of the paper, we will refer to the different groups of shallow-water modes as wavebands. There are three wavebands in the shallow-water model: the Rossby waveband and two equivalent inertia–gravity wavebands.) In contrast, those branches seem to be absent from the frequency spectrum in the other limit (see figure 1), i.e. when
 $\varOmega$ is small compared with
 $c/R$, hereafter referred to as the Margules limit (Margules Reference Margules1892). One would think that these branches somehow disappear as
 $L_{eq}$ and
 $R$ become comparable; however, there is no analytical solution of the eigenvalue problem in this intermediate situation to show exactly how.
Dimensionless frequencies of the shallow-water model on a rotating sphere for two values of the parameter  $\epsilon = c/\varOmega R$, namely (a)
 $\epsilon = 0.01$ (strong rotation) and (b)
 $\epsilon = 10$ (weak rotation), as a function of the azimuthal wavenumber
 $m \in \mathbb {Z}$, computed with Dedalus (Vasil et al. Reference Vasil, Lecoanet, Burns, Oishi and Brown2019) (see Appendix A for numerical methods). In (a) the Matsuno limit (
 $\epsilon \ll 1$), two distinct branches of frequencies transit through the gap between Rossby and inertia–gravity waves, whereas in (b) the Margules limit (
 $\epsilon \gg 1$) these are clearly separated by an unfilled frequency gap. Note that the frequency axes in this figure are in logarithmic scale, as well as in figure 4, in order to visually appreciate the transition between the Matsuno and Margules regimes. All the other frequency plots in the article are displayed in linear scale.

Alternatively, a few years ago, the presence of these two transiting branches in the spectrum of shallow-water waves on the unbounded  $\beta$-plane was interpreted as a manifestation of an underlying topological property. Indeed, after noticing the strong resemblance of this
 $+2$ spectral flow of modes with the topologically protected modes crossing the gap in certain insulating materials, Delplace et al. (Reference Delplace, Marston and Venaille2017) applied the same arguments used in condensed matter physics to define topological integers associated with this spectral flow, the Chern numbers or topological charges. These integers characterise the phase singularities of Kelvin's plane-wave solutions, which are computed for constant
 $f$ and thus require only the diagonalisation of a 3-by-3 matrix. Nevertheless, they happen to be equal to the number of modes gained by the associated wavebands in the more elaborated
 $\beta$-plane model. This counter-intuitive result, which connects the topological properties of Kelvin's
 $f$-plane modes to a spectral property of Matsuno's
 $\beta$-plane spectrum, is a consequence of the more general index theorem (Delplace Reference Delplace2022; Faure Reference Faure2023; Qin & Fu Reference Qin and Fu2023). It has been applied to predict the conditions of existence and number of modes transiting across the frequency gap in a variety of models from a great variety of domains (Wang et al. Reference Wang, Chong, Joannopoulos and Soljačić2009; Khanikaev et al. Reference Khanikaev, Fleury, Mousavi and Alu2015; Nash et al. Reference Nash, Kleckner, Read, Vitelli, Turner and Irvine2015; Shankar, Bowick & Marchetti Reference Shankar, Bowick and Marchetti2017; Souslov et al. Reference Souslov, Van Zuiden, Bartolo and Vitelli2017; Perrot, Delplace & Venaille Reference Perrot, Delplace and Venaille2019; Parker et al. Reference Parker, Marston, Tobias and Zhu2020; Venaille & Delplace Reference Venaille and Delplace2021; Leclerc et al. Reference Leclerc, Laibe, Delplace, Venaille and Perez2022; Perez, Delplace & Venaille Reference Perez, Delplace and Venaille2022; Qin & Fu Reference Qin and Fu2023).
This paper intends to shed a new light on the loss of gapless Kelvin and Yanai modes on a sphere, not with exact analytical resolution but by combining the study of the structure of modes with spectral topology. This analysis relies on numerous previous works in which topology brought new insights into wave properties in geophysical and astrophysical media (Delplace et al. Reference Delplace, Marston and Venaille2017; Perrot et al. Reference Perrot, Delplace and Venaille2019; Venaille & Delplace Reference Venaille and Delplace2021; Leclerc et al. Reference Leclerc, Laibe, Delplace, Venaille and Perez2022; Perez Reference Perez2022; Perez et al. Reference Perez, Delplace and Venaille2022). In the first part, we introduce the equations of the rotating shallow-water model on a sphere, and the relevant dimensionless parameters that characterise it. We recall the asymptotic solutions in both Matsuno and Margules limits. In the second part, we discuss the concept of modal flow and show that the latter is equal to zero for the spectrum of shallow-water waves on a rotating sphere, whereas it is equal to  $+2$ on the unbounded
 $\beta$-plane. In the third part, we provide a topological interpretation of this result. We compute the Chern numbers, which are associated with the points where the symbol of the wave operator has multiple eigenvalues. We show that the metric term induces degeneracy points of non-zero Chern numbers, in addition to that reported by Delplace et al. (Reference Delplace, Marston and Venaille2017). This analysis reconciles the bulk–interface correspondence established by Delplace et al. on the unbounded
 $\beta$-plane with the disappearance of the equatorial spectral flow in spherical geometry.
2. The linearised shallow-water model on a rotating sphere
2.1. Linearised equations
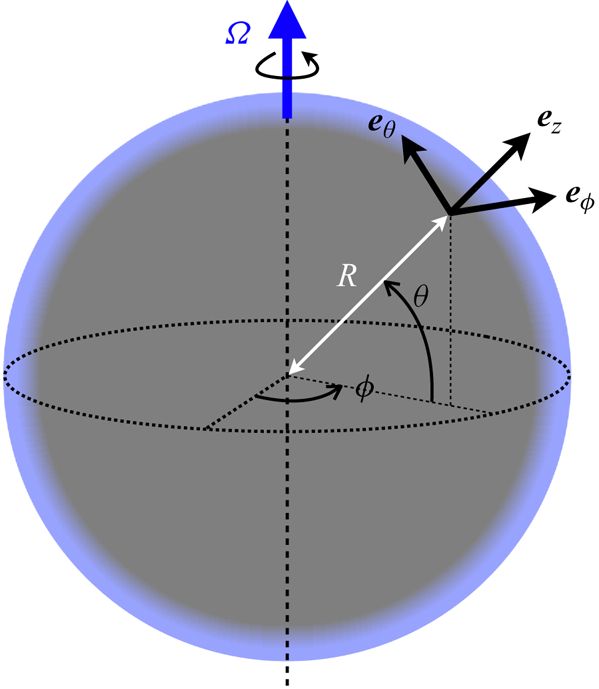
We consider the linearised shallow-water equations of an inviscid fluid layer on top of a sphere of radius  $R$, rigidly rotating with constant rate
 $\boldsymbol {\varOmega }$ (figure 2). The fluid is initially at rest in the rotating frame. Besides, assuming that the gravity
 $g$ at the surface is such that
 $g \gg R \varOmega ^2$, we ignore centrifugal effects. Therefore, the rest state is that of a quiet layer of constant depth
 $h_0$. Denoting the perturbed fields with a prime, we define
 $\boldsymbol {v} = \boldsymbol {v}'(\boldsymbol {x},t)$ and
 $h = h_0 + h'(\boldsymbol {x},t)$ as the two-component velocity and height of the fluid, respectively, both functions of time
 $t$ and position
 $\boldsymbol {x}$ on the sphere. The linearised shallow-water equations can be conveniently expressed in terms of rescaled perturbation fields, i.e.
 $\tilde {\boldsymbol {v}} = \sqrt {h_0} \boldsymbol {v}' = \tilde {u} \boldsymbol {e}_\phi + \tilde {v} \boldsymbol {e}_\theta$ and
 $\tilde {h} = \sqrt {g} h'$, as
 $$\begin{gather} \frac{\partial \tilde{\boldsymbol{v}}}{\partial t} ={-}c \boldsymbol{\nabla} \tilde{h} - \boldsymbol{f} \times\tilde{\boldsymbol{v}}, \end{gather}$$
 $$\begin{gather}\frac{\partial \tilde{h}}{\partial t} ={-}c \boldsymbol{\nabla} \boldsymbol{\cdot} \tilde{\boldsymbol{v}}, \end{gather}$$
where  $c = \sqrt {gh_0}$ is the constant phase speed and
 $\boldsymbol {f} = (2 \boldsymbol {\varOmega } \boldsymbol {\cdot } \boldsymbol {e}_z) \boldsymbol {e}_z$ is the projection of
 $2 \boldsymbol {\varOmega }$ on the local unit vector
 $\boldsymbol {e}_z$ normal to the surface (traditional Coriolis parameter). Since none of the parameters appearing in (2.1) depend on time or longitude, the rotating sphere acts as a waveguide trapping zonally propagating waves in the meridional direction. We can thus expand any perturbation on the set of Fourier modes
 $X(\theta ) \exp ({{\rm i}(m \phi - \omega t)})$, where
 $X$ is any of the three dependent variables of (2.1),
 $(\phi,\theta )$ the longitudinal and latitudinal coordinates, respectively, and
 $(m,\omega )$ the azimuthal wavenumber and frequency associated with the Fourier mode, which corresponds to the solutions of
 $$\begin{gather} \omega \tilde{\boldsymbol{v}} ={-}{\rm i} c \boldsymbol{\nabla} \tilde{h} - {\rm i} \boldsymbol{f} \times \tilde{\boldsymbol{v}}, \end{gather}$$
 $$\begin{gather}\omega \tilde{h} ={-} {\rm i} c \boldsymbol{\nabla} \boldsymbol{\cdot} \tilde{\boldsymbol{v}}. \end{gather}$$
Geometry of the rotating shallow-water model on a sphere. The spherical coordinates and associated unit vectors are different from the usual ones,  $\theta$ being the latitude instead of the colatitude.

The core of the discussion of this article is the metric term that arises from the divergence operator  $\boldsymbol {\nabla } \boldsymbol {\cdot }$ in (2.2b), owing to the geometrical curvature of the surface. This point is discussed in § 4.
2.2. Lamb parameter and asymptotic solutions
If one rather considers the dimensionless frequency  $\omega / \varOmega$, the eigenvalue problem (2.2) depends only on one dimensionless parameter:
 \begin{equation} \epsilon = \frac{c}{R \varOmega}. \end{equation}
The quantity  $2/\epsilon$ is sometimes called the Lamb parameter (Müller & O'Brien Reference Müller and O'Brien1995), not to be confused with the Lamb frequency used in asteroseismology (Aerts, Christensen-Dalsgaard & Kurtz Reference Aerts, Christensen-Dalsgaard and Kurtz2010). The quantity
 $1/\epsilon$ gives the traversal time of a gravity wave over the spherical body in planetary days. Equations (2.2) in dimensionless units are
 $$\begin{gather} (\omega / \varOmega) \tilde{\boldsymbol{v}} ={-}{\rm i} \epsilon \tilde{\boldsymbol{\nabla}} \tilde{h} - 2 {\rm i} \sin(\theta) \boldsymbol{e}_z \times \tilde{\boldsymbol{v}}, \end{gather}$$
 $$\begin{gather}(\omega / \varOmega) \tilde{h} ={-} {\rm i} \epsilon \tilde{\boldsymbol{\nabla}} \boldsymbol{\cdot} \tilde{\boldsymbol{v}}, \end{gather}$$
where  $\tilde {\boldsymbol {\nabla }} = R \boldsymbol {\nabla }$ is the gradient operator on the unit sphere. The parameter
 $\epsilon$ naturally appears in asymptotic expansions to compute the approximate spectrum of shallow-water waves (Müller & O'Brien Reference Müller and O'Brien1995; Paldor Reference Paldor2015) or their ray paths (Longuet-Higgins Reference Longuet-Higgins1965) on the sphere. One can expect to asymptotically recover the Matsuno spectrum as
 $\epsilon \rightarrow 0$. Indeed, expression (1.2) yields
 $L_{eq} / R = \sqrt {\epsilon / 2}$ for the equatorial radius of deformation, which means that, for small
 $\epsilon$, the wavefunctions are equatorially trapped with angular spreading of order
 $\sqrt {\epsilon }$, thus recovering the Cartesian
 $\beta$-plane approximation made by Matsuno. In this limit, the solutions of (2.2) are appropriately described with Hermite polynomials, which are exact solutions on the unbounded
 $\beta$-plane (see § 3.1).
Conversely, for larger values of  $\epsilon$, the solutions are expected to spread away from the equator and eventually over the whole sphere. In the limit
 $\epsilon \gg 1$, sometimes called the Margules limit (Müller & O'Brien Reference Müller and O'Brien1995), there are two kinds of eigenvalues, originally found by Margules (Reference Margules1892) and Hough (Reference Hough1898), that we recall here:
(i) Those such that
 $\omega = {O}(c/R)$. One recovers the non-rotating shallow-water equations from (2.2). The wavefunctions are those of the Laplacian operator on a prolate spheroid, i.e. the prolate spheroidal wavefunctions (Zaqarashvili et al. Reference Zaqarashvili, Oliver and Ballester2009), and we have $R \omega / c \simeq \sqrt {\ell (\ell + 1)} - m / \epsilon$ (see e.g. Müller, Kelly & O'brien Reference Müller, Kelly and O'brien1994; Müller & O'Brien Reference Müller and O'Brien1995) with non-zero integers $\ell$ and $|m| \leq \ell$. These are global surface gravity oscillations on the sphere, perturbed by a small Coriolis term. For these solutions, the number of zeros of $\tilde {v}$ on the open interval $]-{\rm \pi} /2 , {\rm \pi}/2[$ is given by $p = \ell - |m| + 1$ (Müller & O'Brien Reference Müller and O'Brien1995).
(ii) Those such that
$\omega = {O}(\varOmega )$. These are quasi-geostrophic planetary (Rossby) modes. From (2.2), it is straightforward to check that they obey $|\tilde {\boldsymbol {\nabla }} \boldsymbol {\cdot } \boldsymbol {v}'| = {O} ( |\boldsymbol {v}'| / \epsilon ^2 )$, i.e. that these modes have asymptotically divergence-free velocity. Eliminating the other variables from (2.2a), we end up with a second-order differential equation for $V = \cos ^\frac {3}{2} (\theta ) \tilde {v}$:
(2.5)\begin{equation} -\frac{{\rm d}^2 V}{{\rm d} \theta^2} + \left[ \left( m^2 - \frac{1}{4}\right) \tan^2 (\theta) + \left( m^2 - \frac{1}{2} + \frac{2m \varOmega}{\omega}\right)\right] V = 0. \end{equation}Solutions of (2.5) are provided for instance by Taşeli (Reference Taşeli2003). They yield
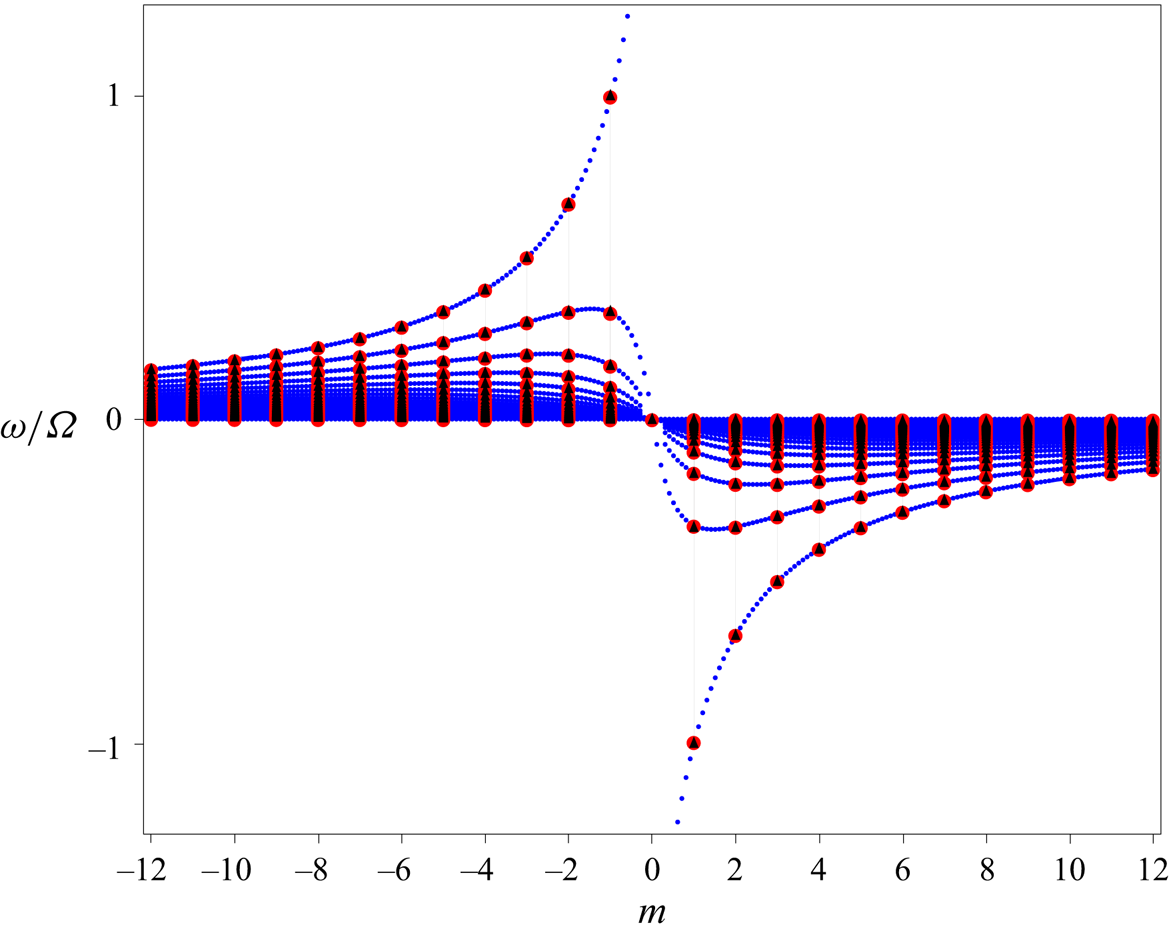
(2.6)where the index\begin{equation} \frac{\omega}{\varOmega} = \frac{-2m}{m^2 + (2p + 1)|m| + p(p + 1)} \quad (\text{with}\ p = 0,1,2,\dots), \end{equation}$p$ indicates the number of zeros of the meridional velocity $\tilde {v}$ in the open interval $]-{\rm \pi} /2 , {\rm \pi}/2[$. In the Margules limit, the largest Rossby frequency is thus $\omega = \varOmega$, for $m = -1$ and $p=0$. The Rossby modes with $p=0$ constitute the westward Yanai modes (Paldor et al. Reference Paldor, Fouxon, Shamir and Garfinkel2018). Expression (2.6), which is exact for any azimuthal wavenumber $m$ in the Margules limit $\epsilon \gg 1$, is the same as (3.2c) obtained by Müller & O'Brien (Reference Müller and O'Brien1995) through a covariant formulation of the wave equations (2.1). Figure 3 provides a comparison of expression (2.6) with numerical simulations, demonstrating the convergence of the Rossby waveband towards the Margules limit as $\epsilon$ increases.


Comparison between expression (2.6) (black triangles) and numerically computed Rossby frequencies for  $\epsilon = 5$. The red circles are obtained by projecting (2.2) on Dedalus’ curvilinear spectral basis (Vasil et al. Reference Vasil, Lecoanet, Burns, Oishi and Brown2019), whereas the blue circles are computed from the problem (4.1) on
 $]-{\rm \pi} /2,{\rm \pi} /2[$, not necessarily with integer values of
 $m$, projecting the wavefunctions on the basis of Chebyshev polynomials (Burns et al. Reference Burns, Vasil, Oishi, Lecoanet and Brown2020) (see Appendix A). The accuracy between the numerically converged frequencies for
 $\epsilon =5$ and the Margules asymptotic formula (2.6) is approximately
 $0.4\,\%$.

There is a large frequency gap between these two wavebands, in which the Kelvin and Yanai modes of the Matsuno spectrum are absent (see figure 1).
2.3. Matsuno and Margules limits on planets and stars
As far as the shallow-water model is valid, the Matsuno regime is common to most fast-rotating planets, but also stars like brown dwarfs (Tan & Showman Reference Tan and Showman2020). Observations of the  $\delta$ Scuti star Rasalhague allows one to estimate
 $\epsilon \simeq 0.36$ (Monnier et al. Reference Monnier, Townsend, Che, Zhao, Kallinger, Matthews and Moffat2010). Atmospheres of exoplanets cover a large range of values of
 $\epsilon$ (see e.g. Showman, Cho & Menou Reference Showman, Cho and Menou2010, table 1), as well as the atmosphere of Earth, for which there is a variety of values of
 $\epsilon$ depending on the type of waves considered (Müller & O'Brien Reference Müller and O'Brien1995; Shamir et al. Reference Shamir, Garfinkel, Gerber and Paldor2023). For instance, the measurements of Kelvin and Rossby–Haurwitz waves in the atmosphere of Venus presented by Del Genio & Rossow (Reference Del Genio and Rossow1990) lead to the estimation
 $\epsilon \simeq 0.9$, whereas
 $\epsilon \approx 70$ for the atmospheric waves considered by Showman et al. (Reference Showman, Cho and Menou2010). On Earth, equatorial Kelvin waves have been detected in both the equatorial ocean (Johnson & Mc Phaden Reference Johnson and Mc Phaden1993; Sprintall et al. Reference Sprintall, Gordon, Murtugudde and Susanto2000) and atmosphere (Kiladis et al. Reference Kiladis, Wheeler, Haertel, Straub and Roundy2009), and their implication for a variety of geophysical phenomena (e.g. the El Niño event and the Madden–Julian Oscillation) is well understood. The first baroclinic modes (the fastest ones) are such that
 $c \simeq 2\,{\rm m}\,{\rm s}^{-1}$ in the equatorial ocean, thus
 $\epsilon \simeq 4.3\times 10^{-3}$, and
 $c \simeq 25\,{\rm m}\,{\rm s}^{-1}$ in the atmosphere, thus
 $\epsilon \simeq 5.4\times 10^{-2}$ (see Vallis Reference Vallis2017, p. 304). However, the barotropic modes in the terrestrial atmosphere propagate at phase speed
 $c \simeq 300\,{\rm m}\,{\rm s}^{-1}$, which corresponds to
 $\epsilon \simeq 0.65$. This value is consistent with the data studied by Sakazaki & Hamilton (Reference Sakazaki and Hamilton2020). Surface motions on giant planets of our solar system are the subject of many recent works (Menou & Rauscher Reference Menou and Rauscher2009; Showman et al. Reference Showman, Cho and Menou2010, Reference Showman, Ingersoll, Achterberg and Kaspi2018; Gavriel & Kaspi Reference Gavriel and Kaspi2021). Atmospheric waves on Jupiter and Saturn are mostly in the Matsuno regime. For instance, eastward-propagating motions strongly localised at the equator on Jupiter have been interpreted as Kelvin waves (Legarreta et al. Reference Legarreta, Barrado-Izagirre, García-Melendo, Sanchez-Lavega and Gómez-Forrellad2016), which is consistent with the estimation
 $\epsilon \simeq 1.4 \times 10^{-4}$.
2.4. Opening of a spectral gap as $\epsilon$ increases

In the Margules limit ( $\epsilon \gg 1$), the minimal inertia–gravity frequency is equal to
 $\sqrt {2} c/R$ and the maximum Rossby frequency is
 $\varOmega$, which yields a frequency gap of width
 $\varOmega (\sqrt {2} \epsilon - 1 )$ in which there is no mode. Conversely, in the Matsuno limit (
 $\epsilon \ll 1$), the frequency gap between Rossby and inertia–gravity modes is filled with the Yanai and Kelvin modes. However, talking about a frequency gap and branches of modes is abusive in this situation. Indeed, contrary to the zonal wavenumber
 $k$ of zonally propagating waves on the unbounded
 $\beta$-plane, the azimuthal wavenumber
 $m$ is not a continuous parameter, since it only takes discrete integer values. Therefore the spectrum
 $(m,\omega )$ does not consist of continuous branches but rather a discrete set of points, which means that, strictly speaking, there are frequency gaps between any allowed values of
 $\omega$. Nevertheless, the equatorial Yanai and Kelvin modes define a clear connection between the Rossby and inertia–gravity wavebands on the unbounded
 $\beta$-plane, which is still visible in the shallow-water spectrum on a sphere with small
 $\epsilon$, even if
 $m$ takes discrete values (see figures 1 and 4). Such a connection in the spectrum is referred to as spectral flow, which is usually defined for a continuous spectral parameter such as
 $k$ in unbounded flow models (Delplace et al. Reference Delplace, Marston and Venaille2017; Shankar et al. Reference Shankar, Bowick and Marchetti2017; Perrot et al. Reference Perrot, Delplace and Venaille2019; Parker et al. Reference Parker, Marston, Tobias and Zhu2020; Venaille & Delplace Reference Venaille and Delplace2021; Leclerc et al. Reference Leclerc, Laibe, Delplace, Venaille and Perez2022; Perez et al. Reference Perez, Delplace and Venaille2022; Zhu, Li & Marston Reference Zhu, Li and Marston2023). The purpose of the following section is to extend the concept of spectral flow in the present situation, i.e. with a discrete wavenumber
 $m$, and show that the net number of modes gained by the inertia–gravity waveband, when those modes are naturally labelled by the zeros of their meridional velocity, is actually zero for any value of
 $\epsilon$, even if there are transiting frequencies for small
 $\epsilon$ (see figure 4).
Numerically computed frequencies  $\omega$ for (a–f) increasing values of
 $\epsilon$ and
 $|m| \leq 20$. These converged values are obtained by projecting (2.2) on a basis of spin-weighted harmonics, a spectral method implemented in the Dedalus solver (Vasil et al. Reference Vasil, Lecoanet, Burns, Oishi and Brown2019) (see Appendix A). While for small
 $\epsilon$ two distinguishable spectral branches, the Yanai and Kelvin modes, transit through the gap between Rossby and gravity modes, these branches progressively break down and a clear gap opens up, separating Rossby and gravity frequencies.

3. Modal flow and zeros of the meridional velocity
To this day, equations (2.2) do not have an exact solution for arbitrary values of  $\epsilon$, although good approximations have been found in certain limits, especially in short wavelength ranges (Longuet-Higgins Reference Longuet-Higgins1968; Paldor Reference Paldor2015), or for special values of
 $\omega$ and
 $\epsilon$ (Müller & O'Brien Reference Müller and O'Brien1995). In this study, we are interested in the transition between the Matsuno and Margules limits, i.e. the evolution of modes and frequencies for finite values of
 $\epsilon$. For this reason, the analysis of this section is mostly based on numerical integration of (2.2), with the spectral solver Dedalus (Vasil et al. Reference Vasil, Lecoanet, Burns, Oishi and Brown2019). The point of this section is the following: the Matsuno spectrum, i.e. the frequencies
 $\omega$ of zonally propagating equatorial waves on the unbounded
 $\beta$-plane, consists of a discrete set of continuous functions of the zonal wavenumber
 $k$, or spectral branches. These branches can be indexed by the number of zeros of the meridional velocity
 $\tilde {v}(\theta )$. For shallow-water waves on a sphere, however, the modes and frequencies depart from Matsuno's solutions as
 $\epsilon$ increases, wavefunctions spread away from the equator and new zeros of
 $\tilde {v}(\theta )$ appear at non-zero latitudes, modifying the natural order of mode branches established by Matsuno. This affects the conclusion regarding the very concept of spectral flow in this model, which must be replaced by a more accurate notion that we name the modal flow.
3.1. Reminder: the Matsuno spectrum and wavefunctions
The shallow-water equations for equatorial waves on the unbounded  $\beta$-plane are the same as (2.2), only with Cartesian coordinates instead of spherical ones (
 $x$ is the zonal coordinate pointing eastward and
 $y$ is the meridional coordinate pointing northward, with
 $y=0$ defining the equator), and
 $f=\beta y$. Once again, we focus on plane waves propagating in the zonal direction, i.e. solutions in the form
 $X(y) \exp ({{\rm i}(k x - \omega t)})$, where the wavenumber
 $k$ can take continuous values. As explained in the introduction, this model captures the physics of equatorial waves in the limit of small
 $\epsilon$. The solutions found by Matsuno (Reference Matsuno1966) obey the dispersion relation
 \begin{equation} \frac{\omega^2}{c^2} - k^2 - \frac{\beta k}{\omega} - \frac{\beta}{c} (2p+1) = 0 \quad (\text{with}\ p ={-}1,0,1,2,\dots), \end{equation}
and the corresponding wavefunctions for the meridional velocity are given by
 \begin{equation} \left.\begin{gathered} \tilde{v}(y) \propto H_p \left( y \sqrt{\frac{\beta}{c}} \right) \exp\left({-\frac{\beta}{2c} y^2}\right) \quad \text{for}\ p \geq 0, \\ \tilde{v}(y) = 0 \quad \text{for}\ p={-}1, \end{gathered}\right\} \end{equation}
with the Hermite polynomials  $H_p$. As depicted in figure 5, the dispersion relation (3.1) can be represented by a discrete set of continuous branches in
 $(k,\omega )$, each indexed by the integer
 $p$. For
 $p \geq 0$, this index is equal to the number of zeros of
 $\tilde {v}$ in the meridional direction
 $y$. Branches with
 $p \geq 1$ are the Rossby and inertia–gravity modes. The branches
 $p=0$ and
 $p=-1$ are those of the Yanai and Kelvin modes, respectively. The Kelvin modes are purely zonal, i.e. with
 $\tilde {v} = 0$. The dispersion relation (3.1) formally associates Kelvin modes with the index
 $p=-1$ and, even though it does not make sense in terms of number of zeros of
 $\tilde {v}(y)$, it is convenient to keep this index
 $-1$ in mind. It is also worth noticing that, for
 $p=0$, (3.1) admits an additional solution
 $\omega = -ck$. This solution corresponds to a diverging mode on the unbounded
 $\beta$-plane, and thus it is discarded as it is not physically acceptable.
The Matsuno spectrum and wavefunctions for equatorial shallow-water waves on the unbounded  $\beta$-plane (Matsuno Reference Matsuno1966). (a) Plot of the dispersion relation (3.1), showing the branches
 $-1 \leq p \leq 3$ for positive frequencies. The Yanai and Kelvin branches transit across the frequency gap between the Rossby and inertia–gravity wavebands as
 $k$ increases. (b) Amplitude of the meridional velocity in the
 $y$ direction, given by expression (3.2). The branch index
 $p$ is equal to the number of zeros of
 $\tilde {v}(y)$.

3.2. Zeros of the meridional velocity
The  $+2$ spectral flow studied by Delplace et al. (Reference Delplace, Marston and Venaille2017) corresponds to the Yanai and Kelvin modes, which transit from the Rossby waveband to the inertia–gravity waveband as
 $k$ increases. Beyond the fact that these modes form continuous curves in
 $(k,\omega )$, what identifies each of them is the number of zeros of the meridional velocity in the
 $y$ direction, as previously shown. Generally speaking, it is straightforward to define the spectral flow of an eigenvalue problem if there is a continuous parameter such as the zonal wavenumber
 $k$, because the spectrum thus consists of continuous branches. However, if the spectral parameter takes discrete values, one must find an alternative way to count the number of modes gained or lost by a waveband as this spectral parameter is swept. For shallow-water waves on a rotating sphere, the azimuthal wavenumber
 $m$ is a discrete parameter; nevertheless we will extrapolate the relation existing between the spectral flow of inertia–gravity waves and the number of zeros of
 $\tilde {v}$ for the unbounded
 $\beta$-plane model. In other words, we will adopt the number of zeros of
 $\tilde {v} (\theta )$ on the open interval
 $]-{\rm \pi} /2, +{\rm \pi} /2[$ as an ordering parameter for the modes of the problem (2.2) (see figure 6). In fact, many works on the spectrum of shallow-water waves associate or label modes according to the number of zeros of their meridional velocity (Hough Reference Hough1898; Longuet-Higgins Reference Longuet-Higgins1968; Iga Reference Iga1995; Müller & O'Brien Reference Müller and O'Brien1995; Paldor et al. Reference Paldor, Fouxon, Shamir and Garfinkel2018). In the Matsuno spectrum, at negative
 $k$, there are modes with no zero of
 $\tilde {v}$ in the Rossby waveband but not in the inertia–gravity waveband, whereas there are modes with no zero in the inertia–gravity waveband at positive
 $k$. Connecting them together forms the spectral flow of Yanai modes, which transits between the Rossby and inertia–gravity wavebands as
 $k$ increases. To clarify, in the rest of the paper, we employ the term modal branch to refer to modes with the same number of zeros of
 $\tilde {v}(\theta )$ on the open interval
 $]-{\rm \pi} /2, {\rm \pi}/2[$, as
 $m$ varies, and say that there is a modal flow when such a modal branch transits between the Rossby and inertia–gravity wavebands. In contrast, the terms spectral branch and spectral flow are used to refer to the continuous curves formed by the frequencies, which is a well-defined concept only if the spectral parameter is continuous, strictly speaking. Spectral and modal branches of the Matsuno spectrum are the same (see figure 5). In the shallow-water spectrum on the sphere, the spectral parameter
 $m$ is not continuous, yet one can argue that there is a spectral flow of frequencies in the Matsuno limit (see figures 1 and 4), but not in the Margules limit.
(a–f) Numerically calculated frequencies of (2.2) (red circles). The modes with the same number of zeros of  $\tilde {v}(\theta )$ are connected by dashed blue curves, which have no physical meaning. The number of zeros is indicated on the curves. For small
 $\epsilon$, the modal branches display an abrupt jump right before
 $m=0$. As
 $\epsilon$ increases, the spectrum progressively loses its east–west asymmetry and the spectral flow collapses.

As shown in the previous section, for small  $\epsilon$, the ratio between the equatorial radius of deformation and the sphere's radius is of order
 $\sqrt {\epsilon }$, which implies that the wavefunctions spread across the whole sphere even for moderate values of
 $\epsilon$, and thus the modes experience the discrepancy with the unbounded
 $\beta$-plane. The spreading of all the wavefunctions reveals additional zeros of
 $\tilde {v}$ at non-zero latitude, which are virtually invisible when
 $\epsilon$ is too small and the modes are strongly trapped at the equator. In fact, all modes with positive phase speed (i.e. positive
 $m$, considering only the positive frequencies) have two additional zeros at opposite latitudes (see figures 7 and 8), compared with the same modes of the unbounded
 $\beta$-plane. However, the zeros of Rossby modes, which propagate westward, are unchanged. In other words, the index
 $p$ of the Matsuno modes propagating eastward is increased by
 $+2$ in spherical geometry. In particular, Yanai modes with negative
 $m$ have
 $p=0$ meridional zeros and
 $p=2$ zeros for positive
 $m$. Similarly, in contrast to the unbounded
 $\beta$-plane, Kelvin modes have a non-zero meridional velocity which cancels once at the equator, i.e.
 $p=1 = -1 + 2$. This
 $+2$ jump in the number of zeros, which was already discussed by Müller & O'Brien (Reference Müller and O'Brien1995), is illustrated in figure 6.
Meridional velocity  $\textrm {Re} (\tilde {v}(\theta ) \,\textrm {e}^{\textrm {i} m \phi } )$ of modes for
 $\epsilon = 0.2$ and
 $m=-2,+1$, computed with Dedalus (red, positive values; blue, negative values). Mode A is a Rossby mode, B and F are Yanai modes, E is a Kelvin mode and C, D, G and H are inertia–gravity modes. On the left, modes are connected by dashed blue curves according to number of zeros of
 $\tilde {v}(\theta )$ on
 $]-{\rm \pi} /2 , {\rm \pi}/2[$. Modes F, G and H have zeros at high latitude, which are not visible on the plot since the wavefunctions vanish away from the equator (see Appendix A). Dashed black lines indicate the zeros of
 $\tilde {v}(\theta )$, and the meridional lines of zeros correspond to the term
 $\textrm {e}^{\textrm {i} m \phi }$ with
 $m \neq 0$ for travelling waves.

Same modes as figure 7, for  $\epsilon = 2$. The wavefunctions are more spread in latitude and extend up to the poles, clearly revealing zeros at high latitudes. The meridional velocity of a Yanai mode has no zero for negative
 $m$ (B), but changes sign at two opposite latitudes for positive
 $m$ (F), contrary to the Yanai mode computed by Matsuno on the equatorial
 $\beta$-plane. Generally speaking, the meridional velocity of modes with eastward phase speed has two more zeros, compared with Matsuno's wavefunctions. Similarly, Kelvin modes (E) have zero meridional velocity on the unbounded
 $\beta$-plane, which is not true on the sphere. Note that the north–south symmetry of the wavefunctions is preserved on the sphere, which implies the parity of these additional zeros. This point is discussed in Appendix B.

To conclude this section, we have shown that the net modal flow of shallow-water waves, equal to  $+2$ on the unbounded
 $\beta$-plane, is null on the sphere. This is evident for large
 $\epsilon$ since the spectrum displays a strong east–west symmetry, i.e. the frequencies
 $\omega$ and wavefunctions are nearly the same for
 $m$ and
 $-m$. As
 $\epsilon$ becomes smaller, the spectrum loses this east–west symmetry, displays an apparent spectral flow of frequencies but the net modal flow remains zero. At small
 $\epsilon$, the spectrum resembles the Matsuno one as there are Kelvin and Yanai modes transiting across the gap for increasing wavenumber
 $m$. However, the Yanai modes do not form a modal branch because the eastward ones have two more zeros than the westward ones. In the present case, the nullity of this modal flow can be surprising regarding the bulk–interface correspondence established by Delplace et al. (Reference Delplace, Marston and Venaille2017), Tauber, Delplace & Venaille (Reference Tauber, Delplace and Venaille2019) and Delplace (Reference Delplace2022), which states that the number of transiting modes of the Matsuno spectrum is equal to a robust topological charge
 $+2$ at the equator. In the following we show that the nullity of the net modal flow is actually in agreement with the index theorem, as the Chern numbers of the shallow-water spectrum on the sphere add up to zero, in contrast to the unbounded
 $\beta$-plane.
4. Topology of the shallow-water model on a sphere
Identifying modes with the number of zeros of their  $\tilde {v}$ wavefunction, we showed that the net modal flow of shallow-water waves on a sphere is null, while it is
 $+2$ for the unbounded
 $\beta$-plane. Many studies (Faure & Zhilinskii Reference Faure and Zhilinskii2000; Delplace et al. Reference Delplace, Marston and Venaille2017; Perrot et al. Reference Perrot, Delplace and Venaille2019; Parker et al. Reference Parker, Marston, Tobias and Zhu2020; Fu & Qin Reference Fu and Qin2021; Venaille & Delplace Reference Venaille and Delplace2021; Delplace Reference Delplace2022; Leclerc et al. Reference Leclerc, Laibe, Delplace, Venaille and Perez2022; Perez et al. Reference Perez, Delplace and Venaille2022) showed that, when the frequencies
 $\omega$ can be expressed as the eigenvalues of a Hermitian differential wave operator
 $\mathcal {H}$, the number of modes gained by a waveband as the spectral parameter increases is equal to a topological invariant characterising the Weyl symbol
 $\boldsymbol{\mathsf{H}}$ of the operator
 $\boldsymbol{\mathcal {H}}$, in virtue of the index theorem (Faure Reference Faure2023). As demonstrated for instance by Delplace et al. (Reference Delplace, Marston and Venaille2017), Faure (Reference Faure2023), Delplace (Reference Delplace2022) and Venaille et al. (Reference Venaille, Onuki, Perez and Leclerc2023), the presence of
 $+2$ transiting equatorial modes on the unbounded
 $\beta$-plane is ensured by a
 $+2$ Chern number characterising the degeneracy point of the symbol at
 $f=0$. More precisely, the Yanai and Kelvin branches constitute a footprint, in the spectrum of
 $\boldsymbol{\mathcal {H}}$, of a degeneracy point of its symbol bearing a Chern number of
 $+2$. In light of the discussion of § 3, the aim of this section is to show that the previous conclusions can be inferred with the index theorem, as accounting for the spherical metric reveals new degeneracy points of the symbol of the wave operator, in addition to the unique degeneracy point of the problem on the unbounded
 $\beta$-plane. We demonstrate that these additional degeneracy points bear topological charges which compensate the
 $+2$ Chern number of the equatorial degeneracy point, thus making the eigenbands of the symbol have zero total Chern numbers, which justifies the absence of transiting modes and the breaking of Yanai and Kelvin mode branches on the sphere for large
 $\epsilon$.
4.1. Hermitian form, analogy with topographic shallow-water waves
In order to apply the index theorem, we first need to express (2.2) in the form  $\boldsymbol{\mathcal {H}} \boldsymbol{X} = \omega \boldsymbol{X}$, where
 $\boldsymbol{\mathcal {H}}$ is a Hermitian differential wave operator and the complex vector
 $\boldsymbol{X}$ contains the three dependent variables
 $\tilde {u}(\theta ),\tilde {v}(\theta )$ and
 $\tilde {h}(\theta )$. To do this, we introduce the rescaled fields
 $u = \sqrt {\cos (\theta )} \tilde {u}$,
 $v = \sqrt {\cos (\theta )} \tilde {v}$ and
 $\eta = \sqrt {\cos (\theta )} \tilde {h}$. Equation (2.2) can thus be recast in the form of a matrix eigenvalue equation:
 \begin{equation} \omega \begin{pmatrix} u \\ v \\ \eta \end{pmatrix} = \begin{pmatrix} 0 & & {\rm i} f{(\theta)} & & \dfrac{c}{R} \dfrac{m}{\cos \theta} \\ -{\rm i} f{(\theta)} & & 0 & & -{\rm i} \dfrac{c}{R} \dfrac{{\rm d}}{{\rm d} \theta} - {\rm i} \beta_{g}{(\theta)} \\ \dfrac{c}{R} \dfrac{m}{\cos \theta} & & -{\rm i} \dfrac{c}{R} \dfrac{{\rm d}}{{\rm d} \theta} + {\rm i} \beta_{g}{(\theta)} & & 0 \end{pmatrix} \begin{pmatrix} u \\ v \\ \eta \end{pmatrix} = \boldsymbol{\mathcal{H}} \begin{pmatrix} u \\ v \\ \eta \end{pmatrix}, \end{equation}
with the Coriolis parameter  $f = 2 \varOmega \sin (\theta )$ and a metric
 $\beta$-term:
 \begin{equation} \beta_{g} = \frac{c}{2 R} \tan (\theta). \end{equation}
The problem is that of identifying the eigenvalues of the wave operator  $\boldsymbol{\mathcal {H}}$, the 3-by-3 matrix of differential operators appearing in the right-hand side of (4.1). It is a Hermitian matrix operator for the canonical scalar product of complex vector functions of
 $\theta$ (see Appendix C). In consequence, unsurprisingly, the spectrum of shallow-water waves on the sphere is purely real. We now introduce the Weyl symbol of the wave operator
 $\boldsymbol{\mathcal {H}}$:
 \begin{equation} \boldsymbol{\mathsf{H}} = \begin{pmatrix} 0 & & {\rm i} f & & M \\ -{\rm i} f & & 0 & & K_\theta - {\rm i} \beta_{g} \\ M & & K_\theta + {\rm i} \beta_{g} & & 0 \end{pmatrix}, \end{equation}
where we have also defined  $M = c m / (R \cos \theta )$, and
 $K_\theta$ the symbol of the Hermitian differential operator
 $-\textrm {i} \textrm {d} / \textrm {d} \theta$ times
 $c/R$, which is therefore a real quantity (see Hall Reference Hall2013, Theorem 13.8). Generally speaking, the symbol of a wave operator, which is obtained via the Wigner transform (see Appendix C), provides a local representation of the wave equations in phase space (see e.g. Littlejohn & Flynn Reference Littlejohn and Flynn1991; Onuki Reference Onuki2020; Perez, Delplace & Venaille Reference Perez, Delplace and Venaille2021; Venaille et al. Reference Venaille, Onuki, Perez and Leclerc2023). It extends the Fourier transform to systems of wave equations with non-constant coefficients. In the present case, the symbol
 $\boldsymbol{\mathsf{H}}$ represents quasi-local dispersion and polarisation relations of shallow-water waves on a sphere. Here
 $\boldsymbol{\mathsf{H}}$ is a continuous matrix function of the conjugated variables
 $\theta, K_\theta$ and
 $m$. To be clear,
 $m$ must be an integer so that the wavefunctions of
 $\boldsymbol{\mathcal {H}}$ are regular on the sphere, but we can formally consider the symbol
 $\boldsymbol{\mathsf{H}}$ as a continuous function of
 $m$ or
 $M$. In the context of this paper, we introduce it in order to apply the index theorem, following Faure (Reference Faure2023), i.e. we investigate the topological properties of the degeneracy points of
 $\boldsymbol{\mathsf{H}}$. This theorem relates the Chern numbers of these degeneracy points to the number and direction of transiting modes of the wave operator
 $\boldsymbol{\mathcal {H}}$, which can be interpreted as the spectral footprint of a degeneracy point of non-zero Chern number in the quasi-local dispersion relations. The symbol (4.3) is a generalisation of that studied by Delplace et al. (Reference Delplace, Marston and Venaille2017) for the unbounded
 $\beta$-plane: indeed, in the Matsuno limit,
 $\beta _{g} / f \approx \epsilon /4 \ll 1$ in the Yoshida waveguide, and thus the metric term
 $\beta _{g}$ can be dropped, as far as equatorially trapped waves are concerned.
A recent paper (Ageev & Iliasov Reference Ageev and Iliasov2024) erroneously states that the shallow-water wave operator on the sphere is non-Hermitian and admits complex eigenvalues, which is not true since this system is linearly stable in the absence of a background flow. The mistake originates from using the Fourier transform (which is not possible since the coefficients of  $\boldsymbol{\mathcal {H}}$ vary with
 $\theta$) on the wave operator, instead of the more relevant Wigner transform. It is known that the Wigner transform must include additional terms on curved manifolds (Gneiting, Fischer & Hornberger Reference Gneiting, Fischer and Hornberger2013), which yields a Hermitian symbol in this case. Moreover, the equivalence between the respective Hermiticity of an operator and its symbol is a known property (Hall Reference Hall2013), and the symbol (4.3) is Hermitian as we used an appropriate rescaling of the variables, implying the Hermiticity of the operator
 $\boldsymbol{\mathcal {H}}$ for the canonical scalar product. Besides, we point out that the topological properties that are presented in the following section do not depend on the choice of
 $\theta$ (and thus its conjugated symbol
 $K_\theta$) as coordinate to express the differential operator
 $\boldsymbol{\mathcal {H}}$ and its symbol. Indeed, one would obtain the same symbol
 $\boldsymbol{\mathsf{H}}$ using any alternative coordinate
 $x=F(\theta )$, as long as the fields are appropriately rescaled so as to preserve the Hermiticity of
 $\boldsymbol{\mathcal {H}}$ (see Appendix C).
We also point out that (4.1) is formally equivalent to the shallow-water model in planar geometry with varying topography, whose transiting modes were investigated by Venaille & Delplace (Reference Venaille and Delplace2021). The metric term  $\beta _{g}$ plays the exact same role as the topographic parameter
 $\beta _t$, although Venaille & Delplace (Reference Venaille and Delplace2021) only considered an
 $f$-plane. In other words, the metric
 $\beta$-term is mathematically analogous to topography in flat metric. Actually, one could consider together the effect of a curved metric (spherical or oblate for rapidly rotating celestial bodies, for instance) with a topography
 $h_0 (\theta )$ varying with latitude (thus the velocity
 $c=\sqrt {gh_0}$ is also a function of latitude). It can be shown that the symbol of this problem is the same as (4.3), with a total
 $\beta$-term that is the sum of
 $\beta _{g}$ and
 $\beta _t$. For the spherical metric with topography, this adds up to
 $\beta _{total} = (c/2R) ( \tan \theta - \textrm {d} \ln c / \textrm {d} \theta )$. We will not be considering a varying topography, as we focus on the curved metric. However, we bring to the analysis of Venaille & Delplace (Reference Venaille and Delplace2021) the case of varying
 $f$ and the additional geometric/topographic term with latitude, which was already addressed by Perez (Reference Perez2022) (part 3.5.1), in the context of the equatorial channel.
4.2. Degeneracy points of the symbol and their Chern numbers
Let us now determine the topological properties of the matrix  $\boldsymbol{\mathsf{H}}$ of expression (4.3). As a function of
 $(m,K_\theta,\theta )$ and a 3-by-3 Hermitian matrix,
 $\boldsymbol{\mathsf{H}}$ has generically three eigenvalues which are real-valued functions defined over the parameter space
 $(m,K_\theta,\theta )$. These are referred to as eigenbands in the following, denoted
 $\lambda _n$ with
 $n=-1,0,+1$ for increasing eigenvalues. It is important to understand that these eigenvalues are not the same as the frequencies
 $\omega$, i.e. the eigenvalues of the operator
 $\boldsymbol{\mathcal {H}}$ as defined in (4.1).
The fields in (2.1) are real-valued. As such, we have  $\overline {\boldsymbol{\mathcal {H}}(m)} = -\boldsymbol{\mathcal {H}}(-m)$, where the overline stands for the complex conjugation of all coefficients of
 $\boldsymbol{\mathcal {H}}$. Consequently, the spectrum of
 $\boldsymbol{\mathcal {H}}$ is completely symmetric under the inversion
 $(m , \omega ) \rightarrow (-m , -\omega )$. In the same way, all eigenvalues of
 $\boldsymbol{\mathsf{H}}$ verify
 \begin{equation} \lambda_{{-}n} (m,K_\theta,\theta) ={-}\lambda_{{+}n} ({-}m,-K_\theta,\theta), \end{equation}
for any band index  $n=-1,0,+1$. Therefore, it is sufficient to consider only the positive frequencies
 $\omega$ of
 $\boldsymbol{\mathcal {H}}$, and the eigenbands
 $n=0$ (quasi-local representation of Rossby waves) and
 $n=+1$ (quasi-local representation of inertia–gravity waves) of
 $\boldsymbol{\mathsf{H}}$. For this reason, even though a given degeneracy point of
 $\boldsymbol{\mathsf{H}}$ has three Chern numbers (one for each eigenband
 $n=-1,0,+1$), we mostly consider the
 $n=+1$ one and simply refer to it as Chern number (without mentioning the band index). The characteristic polynomial of the matrix
 $\boldsymbol{\mathsf{H}}$ reads as
 \begin{equation} X^3 - (M^2 + K_{\theta}^2 + f^2 + \beta_{g}^2) X - 2 f \beta_{g} M. \end{equation}
The polynomial (4.5) has a multiple root, i.e.  $\boldsymbol{\mathsf{H}}$ has a degenerated eigenvalue (
 $\lambda _{0} = \lambda _{+1}$ and/or
 $\lambda _{0} = \lambda _{-1}$), if and only if
 \begin{equation} \beta_{g} ={\pm} f, \end{equation}
as computed by Venaille & Delplace (Reference Venaille and Delplace2021) for the topographic shallow-water model. The degenerated positive eigenvalue ( $\lambda _{0} = \lambda _{+1}$) is equal to
 $|f|$, and the corresponding degeneracy points in parameter space are those such that
 $\beta _{g} (\theta ) = \pm f (\theta )$,
 $M = \mp |f|$ and
 $K_\theta = 0$. Now the modal flow of
 $\boldsymbol{\mathcal {H}}$ for an eigenband
 $n$, i.e. the number of modes gained by the Rossby (for
 $n=0$) or the inertia–gravity (for
 $n=+1$) waveband as
 $m$ goes from
 $-\infty$ to
 $+\infty$, is constrained by the presence of at least one of these degeneracy points in the real system, and the value of this modal flow is given by the Chern number (a negative Chern number corresponds to a net loss of modes as
 $m$ increases) held by this degeneracy point for the band
 $n$ of the symbol (Delplace et al. Reference Delplace, Marston and Venaille2017; Perez Reference Perez2022; Faure Reference Faure2023). Since
 $f$ and
 $\beta _{g}$ have the same sign (negative in the southern hemisphere and positive in the northern one), the problem amounts to solving
 $c \tan (\theta ) / 2 R = 2 \varOmega \sin (\theta )$, which yields
 \begin{equation} \theta = 0 \quad \text{or} \quad \cos (\theta) = \frac{\epsilon}{4}. \end{equation}
Therefore one can distinguish two situations, as illustrated in figure 9:
(i) If
$\epsilon < 4$, there are three latitudes at which a degeneracy between the eigenvalues of the symbol occurs, one at the equator (threefold since all three eigenvalues of $\boldsymbol{\mathsf{H}}$ are degenerated there) and two (twofold) degeneracy points near the poles, at opposite latitude. As $\epsilon$ increases, these get closer to the equator, where they eventually merge with the equatorial degeneracy point for $\epsilon = 4$. The value of $m$ at the non-equatorial degeneracy points for the positive eigenbands is
(4.8)\begin{equation} m_c ={-}\frac{1}{2} \sqrt{1 - \left(\frac{\epsilon}{4}\right)^2} \in ]-1/2, 0[. \end{equation}(ii) If
$\epsilon \geq 4$, there is a unique degeneracy point at the equator. This can be seen as a threshold in the competition between two different $\beta$-effects, the traditional one owing to the variation of $f$ with latitude, which tends to trap waves at the equator, and the geometric one, which conversely tends to spread the wavefunctions away from it, over the whole sphere.


Phase diagram of  $\boldsymbol{\mathsf{H}}$, inspired by Haldane (Reference Haldane1988). The coloured curves represent the trajectory of
 $(\beta _{g}, f)$ as
 $\theta$ goes from
 $-{\rm \pi} /2$ to
 $+{\rm \pi} /2$. Matrix
 $\boldsymbol{\mathsf{H}}$ has a degenerated eigenvalue when
 $f = \pm \beta _{g}$ (dashed lines), thus splitting the parameter space
 $(\beta _{g}, f)$ into four areas, each of which is characterised by an integer
 $0,-1$ or
 $+1$. The Chern number
 $C_{+1}$ (coloured discs) of a degeneracy point (black circles) involving the eigenband
 $n=+1$ is given by their difference as
 $\theta$ increases past the degeneracy point. (b) If
 $\epsilon < 4$, the equatorial degeneracy point has
 $C_{+1}=+2$, the same as in Delplace et al. (Reference Delplace, Marston and Venaille2017), and there are two additional mid-latitude degeneracy points with
 $C_{+1}=-1$. (a) As
 $\epsilon$ increases and reaches
 $4$, they merge with the equatorial degeneracy point, which still exists for
 $\epsilon > 4$ and has zero Chern number. (c) The symbol of shallow-water waves on the unbounded
 $\beta$-plane is obtained by taking
 $\beta _{g} = 0$ and
 $f=\beta y$ in (4.3), which yields the unique degeneracy point of Chern number
 $+2$ studied by Delplace et al. (Reference Delplace, Marston and Venaille2017).

Each of these degeneracy points can be assigned a set of Chern numbers, one for each eigenband involved in the degeneracy (see Appendix D). Again, two situations can be distinguished:
(i) For
$\epsilon < 4$, the equatorial threefold degeneracy point has a set of Chern numbers $(C_{-1},C_{0},C_{+1}) = (-2,0,+2)$ for the three eigenbands ($n=-1,0,+1$) of $\boldsymbol{\mathsf{H}}$, which are all degenerated. This is the result of Delplace et al. (Reference Delplace, Marston and Venaille2017) for the $\beta$-plane shallow-water model, and it still holds with the contribution of the spherical metric, as long as $\epsilon < 4$. The other twofold non-equatorial degeneracy points bear Chern numbers $(C_{0},C_{+1}) =(+1,-1)$ (for the positive-eigenband degeneracies) and $(C_{-1},C_{0}) =(+1,-1)$ (for the negative-eigenband degeneracies). Note that, for small $\epsilon$, the latter are pushed towards the poles, which are then discarded by Matsuno's $\beta$-plane approximation. This is why the $\beta$-plane shallow-water model does not have them accounted for. These negatively charged degeneracy points also appear at wavenumber $m = m_c \in ]-1/2 , 0[$, given by expression (4.8), which is why their footprint is appreciable in the form of a jump of the modal branches right before $m$ reaches $0$ (see figures 6 and 7).(ii) For
$\epsilon \geq 4$, all degeneracy points merge at the equator – and their respective Chern numbers add up – into a unique threefold degeneracy point which is topologically neutral, i.e. of zero Chern numbers: $(C_{-1},C_{0},C_{+1}) = (0,0,0)$. In the spectrum of the wave operator, this fusion manifests as a symmetrisation of the modes between positive and negative $m$, whereas the east–west asymmetry of the spectrum is appreciable for small $\epsilon$, when the degeneracy points are separated.


In conclusion, the metric term  $\beta _{g}$ generates systematic degeneracy points whose Chern numbers compensate that of the equatorial degeneracy point. For small
 $\epsilon$, these degeneracy points are located near the poles and bear Chern number of
 $-1$ for the eigenband
 $n=+1$, and for
 $\epsilon \geq 4$ there is a unique degeneracy point at the equator whose Chern numbers are
 $0$. The eigenbands of
 $\boldsymbol{\mathsf{H}}$ thus have zero total Chern numbers, which confirms that the net number of modes gained by the inertia–gravity waveband as
 $m$ is swept from
 $-\infty$ to
 $+\infty$ is zero, in virtue of the index theorem. As explained in § 3, there is a direct correspondence between this mode imbalance and the evolution of the number of zeros of
 $\tilde {v}$ for waves on the unbounded
 $\beta$-plane. While the same correspondence can only be inferred by extrapolation for waves on the rotating sphere, we showed here that the absence of modal flow is in agreement with the predictions of topology. For the unbounded
 $\beta$-plane, Venaille et al. (Reference Venaille, Onuki, Perez and Leclerc2023) provide a formal proof of the equality between the modal flow (i.e. the difference in number of positive-frequency inertia–gravity modes between the two limits
 $k \rightarrow + \infty$ and
 $k \rightarrow -\infty$) and the Chern number of the symbol's degeneracy point at the equator, based on geometric Wentzel–Kramers–Brillouin analysis of the waves in both limits. This study, which provides an alternative point of view to the index theorem, could also be extended here to demonstrate the nullity of this mode imbalance on a sphere, with the wavenumber
 $m$ instead of
 $k$.
4.3. Collapse of the spectral flow
For  $\epsilon < 4$, one could expect that each of the degeneracy points exhibited in § 4.2 should be associated with its own branch of modes, two of them localised near the equator, transiting from the Rossby waveband to the inertia–gravity waveband as
 $m$ increases (corresponding to the
 $+2$ topological charge at the equator), and two localised near the latitudes
 $\pm \theta$ such that
 $\cos \theta = \epsilon / 4$, transiting from the inertia–gravity waveband to the Rossby waveband as
 $m$ increases (corresponding to the
 $-1$ charges). However, there is no footprint of the modes transiting from the inertia–gravity waveband to the Rossby waveband, and this happens for two reasons:
(i) Although the index theorem applies individually for each degeneracy point of the symbol, the resulting spectral flows are visible only in a semi-classical limit (Faure Reference Faure2023), i.e. as long as the transiting modes are well separated in phase space (Jezequel & Delplace Reference Jezequel and Delplace2023). In the case of shallow-water waves on a rotating sphere, the semi-classical limit in question corresponds to
$\epsilon \ll 1$. Indeed, the equatorial waves spread up to the poles even for moderate values of $\epsilon$ ($\epsilon \sim 1$), which means that the modes corresponding to the opposite spectral flows overlap and hybridise, thus manifesting an avoided crossing between their respective spectral branches (see e.g. the cases studied by Kaufman et al. (Reference Kaufman, Morehead, Brizard and Tracy1999) and Perez (Reference Perez2022), part 3.5.1), which is precisely why the spectral flow of frequencies collapses as $\epsilon$ increases.(ii) Even for
$\epsilon \ll 1$ the modes of negative spectral flow are not visible in the spectrum. We showed in § 4.2 that these are expected to be localised near the poles, as are the corresponding degeneracy points of the symbol, and transit around $m \approx -1/2$. These modes are the spherical counterpart of Matsuno's spurious solutions (for $\omega = -c k$), or coastal Kelvin waves in the equatorial channel (Paldor Reference Paldor2015; Venaille & Delplace Reference Venaille and Delplace2021; Perez Reference Perez2022), if the edges of the channel were moved up to the poles. Owing to the spherical geometry, the dispersion relation of coastal Kelvin modes propagating along a longitudinal wall at latitude $\theta$ is $\omega = -cm/R \cos \theta$. Therefore, the slope of the branches formed by these hypothetical polar modes is large, and they do not appear in the spectrum for integer values of the wavenumber $m$ since they transit around $m \approx -1/2$. For small $\epsilon$, the strong east–west asymmetry is the manifestation of these opposite topological charges being separated, the gap-crossing Kelvin and Yanai frequencies are the footprint of the $+2$ topological charge at the equator, while the abrupt $+2$ modal jump happening between $m=-1$ and $m=0$ (see figure 6) is the footprint of the degeneracy points of charges $-1$ located near the poles.


5. Concluding remarks
The goal of this work is to investigate the topological properties of the shallow-water spectrum on a rotating sphere. In particular, we aimed at answering the following questions: how do the results of Delplace et al. (Reference Delplace, Marston and Venaille2017), which were established using the  $\beta$-plane approximation, extend to the spherical case? What does topology tell us about the transition between the Matsuno and Margules limits? Both regimes have been extensively investigated, and the corresponding solutions can be well approximated; however, there is no analytic solution for arbitrary values of
 $\epsilon$. In the Matsuno limit (
 $\epsilon \ll 1$ or large Lamb parameter), there seems to be a continuous spectral connection between the Rossby and inertia–gravity modes, which is embodied by the Yanai and Kelvin modes, whose frequencies cross the gap as
 $m$ increases (see figure 1). This spectral feature is reminiscent of the Matsuno spectrum on the unbounded
 $\beta$-plane, for which the connection with topological invariant is well established (Delplace et al. Reference Delplace, Marston and Venaille2017; Delplace Reference Delplace2022; Faure Reference Faure2023; Venaille et al. Reference Venaille, Onuki, Perez and Leclerc2023). In the Margules limit (large
 $\epsilon$ or small Lamb parameter), this gapless connection progressively breaks down. All the inertia–gravity modes plus the positive-phase-speed Yanai (with
 $m \geq 0$) and Kelvin (with
 $m \geq 1$) modes move up to values
 $\omega = {O}(c/R)$, while the largest Yanai frequency (
 $m=-1$) remains smaller than
 $\varOmega$ (see (2.6) with
 $n=0$ and figure 4), thus separating the spectrum into two distinct wavebands with an open frequency gap.
For small  $\epsilon$, the frequencies of shallow-water waves on a sphere and those of the Matsuno spectrum on the unbounded
 $\beta$-plane are nearly identical; however, the
 $\tilde {v}$ component of the modes of positive (eastward) phase speed has two more zeros located at opposite latitudes. The latter being close to the poles, they are not captured by the
 $\beta$-plane approximation. Modes on the sphere have been extensively studied, in particular the Yanai modes (Garfinkel et al. Reference Garfinkel, Fouxon, Shamir and Paldor2017; Paldor et al. Reference Paldor, Fouxon, Shamir and Garfinkel2018). Nevertheless, to our knowledge, the existence of these additional zeros is usually not discussed in the geophysical literature. Yet they are consistent with the evolution of the shallow-water spectrum as
 $\epsilon$ varies continuously. To explain why, let us consider a mode with wavenumber
 $m$ and frequency
 $\omega$, for a large value of
 $\epsilon$ (Margules limit). The number
 $p$ of zeros of
 $\tilde {v}(\theta )$ is established by the classification given in § 2.2. The inertia–gravity modes are essentially those of the Laplacian on the sphere, which are insensitive to the sign of
 $m$. As
 $\epsilon$ continuously decreases, the effect of rotation becomes stronger and the spectrum progressively loses this east–west symmetry. For the mode picked in the large
 $\epsilon$ regime, its frequency
 $\omega$ and the wavefunction
 $\tilde {v}$ change as well in a continuous manner. However, the number
 $p$ cannot change as the structure of
 $\tilde {v}$ is governed by a generalised Sturm–Liouville problem (see the arguments of Iga (Reference Iga1995)), whose eigenvalue equation is the spherical generalisation of Matsuno's equation ((3.3) of Müller & O'Brien (Reference Müller and O'Brien1995) is given for the perturbation of potential vorticity, which is proportional to
 $\cos {(\theta )} \tilde {v}$). When decreasing
 $\epsilon$, the frequencies of the eastward modes decrease faster than those of the westward ones, leading to a dislocation (or
 $+2$ branch jump) in the spectrum. This dislocation eventually results in the spectral flow of Yanai and Kelvin modes in the small-
 $\epsilon$ (Matsuno) limit. In the Matsuno limit on a sphere, this spectral flow is thus obtained as a continuous deformation of the Margules spectrum with no spectral flow. It arises from the isolated
 $+2$ topological charge at the equator, whereas the opposite topological charges near the poles generate invisible modes with opposite spectral flow, which manifest in the spectrum through the change in number of
 $\tilde {v}$ zeros of Yanai modes as
 $m$ changes sign. In other words, this spectral flow is not a modal flow, since the westward and eastward Yanai modes do not constitute a single modal branch. In contrast, the shallow-water spectrum on the unbounded
 $\beta$-plane arises from a single non-zero topological charge, because there is no such way to continuously deform it into a spectrum with no modal flow, as the parameters
 $\beta$ and
 $c$ can be absorbed in the definition of length and time units, and thus do not affect the shape of the spectrum discussed in § 3.1. Conversely, for waves on a sphere, both
 $R$ and the Rossby radius of deformation
 $c/2\varOmega$ deeply affect the shape of the solutions, and their ratio defines the effective equatorial trapping of waves.
We then highlighted furthermore this distinction between the unbounded  $\beta$-plane and the sphere by investigating the topology of the symbol of the shallow-water model on the sphere. We showed that the shallow-water eigenbands on the sphere have zero total Chern numbers, in contrast to the eigenbands on the unbounded
 $\beta$-plane. Consequently, in virtue of the index theorem, there is no net modal flow of modes in the spectrum. Precisely, we found that when
 $\epsilon$ becomes higher than
 $4$, several degeneracy points merge into a unique, topologically neutral degeneracy point at the equator. This manifests in the shallow-water spectrum as the loss of east–west asymmetry and the complete collapse of the spectral flow of equatorial Yanai and Kelvin waves. However, for
 $\epsilon < 4$, the symbol of the wave operator on the sphere has several charged degeneracy points: an equatorial one with non-zero Chern numbers, which is reminiscent of the unbounded
 $\beta$-plane (Delplace et al. Reference Delplace, Marston and Venaille2017), plus two others (considering the positive eigenbands
 $n=0,+1$) with opposite charges. As discussed in § 4.3, the spectral footprint of the former are the Yanai and Kelvin waves, whose transiting frequencies are characteristic of the east–west asymmetry at small
 $\epsilon$, and that of the latter is the
 $+2$ modal jump, i.e. the fact that opposite topological charges of the symbol lead, for small
 $\epsilon$, to a spectral flow that is not a modal flow.
This work joins recent efforts towards the comprehension of how topology applies in the spectral properties of continuous physical systems on curved surfaces (Shankar et al. Reference Shankar, Bowick and Marchetti2017; Green et al. Reference Green, Armas, de Boer and Giomi2020; Finnigan, Kargarian & Efimkin Reference Finnigan, Kargarian and Efimkin2022; Li & Efimkin Reference Li and Efimkin2023; Ageev & Iliasov Reference Ageev and Iliasov2024), a subject that still lacks a unified framework. In that sense, we stress the importance of the Weyl symbol and the spectral parameter. With this study, we have shown that the shallow-water model on a rotating sphere has a counter-intuitive topology that is either neutral (all Chern numbers are null for  $\epsilon \geq 4$) or polar in the sense that it has several degeneracy points of non-zero Chern numbers which sum to zero (for
 $\epsilon < 4$), whereas its
 $\beta$-plane counterpart in unbounded flat geometry has a unique, topologically charged degeneracy point. Besides, we demonstrated a peculiar situation, in which different degeneracy points (with different multiplicity) merge and yield a unique degeneracy point which is topologically neutral, yet without the gap opening afterward. This situation is not usual in topological physics. Further investigation is necessary to better understand the spectral properties of continuous systems on curved surfaces, and the manifestation of topology in their dynamics.
Supplementary material
Supplementary material is available at https://github.com/ArmandLeclerc/STArWaRS. The data that support the findings of this study are openly available at https://github.com/ArmandLeclerc/STArWaRS.
Funding
N.P. and G.L. acknowledge funding from the ERC CoG project PODCAST no. 864965. A.L. is funded by a PhD grant allocation Contrat doctoral Normalien. P.D. is supported by national grant ANR-18-CE30-0002-01.
Declaration of interests
The authors report no conflict of interest.
Appendix A. Numerically computed frequencies and wavefunctions
All numerical solutions of the shallow-water eigenvalue problem throughout the paper are calculated with the spectral solver Dedalus. Our scripts can be found at https://github.com/ArmandLeclerc/STArWaRS. The red circles in the spectra of figures 1, 3, 4, 6, 7, 8 and 10 are obtained by projecting (2.4) on the basis of spin-weighted harmonics implemented in the third version of Dedalus (Vasil et al. Reference Vasil, Lecoanet, Burns, Oishi and Brown2019). In the form of (2.4), the eigenvalue problem is solved on the sphere, using  $128$ harmonics for each value of the azimuthal wavenumber
 $m$. In contrast, the blue circles in the plots of figure 3 are obtained by expressing the wave equations with the meridional coordinate
 $\theta$, and projecting the wavefunctions on a basis of
 $128$ Chebyshev polynomials of the variable
 $\theta \in ]-{\rm \pi} / 2,{\rm \pi} / 2[$, which was already implemented in the earlier version of the solver (Burns et al. Reference Burns, Vasil, Oishi, Lecoanet and Brown2020). The Rossby frequencies obtained with both methods are superimposed in figure 3, for comparison. While solving the wave equations on the sphere only requires imposing the regularity of the velocity and height perturbation fields (this automatically implies that
 $m$ takes integer values), solving (4.1) can be done formally for any value of
 $m$ and requires imposing one Dirichlet boundary condition at each pole, i.e.
 $\theta = \pm {\rm \pi}/ 2$. We chose the conditions
 $\textrm {i} m \tilde {u} \mp \tilde {v} = 0$ at
 $\theta = \pm {\rm \pi}/ 2$ to reflect single-valuedness of the velocity at the poles, i.e.
 $\partial _\phi \tilde {\boldsymbol {v}} |_{\theta = \pm {\rm \pi}/ 2} = 0$. Note that, with both methods, the value of
 $\epsilon$ and the number of spectral points are the only parameters that need to be defined.
For small enough  $\epsilon$, the frequencies of shallow-water waves on the rotating sphere coincide with those of the Matsuno spectrum. However, the wavefunction
 $\tilde {v}(\theta )$ has two more zeros compared with the Hermite wavefunctions computed by Matsuno (Reference Matsuno1966). Owing to the Gaussian trapping of waves at the equator, these additional zeros are barely visible for small values of
 $\epsilon$, such as in figure 7, whereas they are appreciable for moderate values of
 $\epsilon$ (figure 8). Figure 10 shows the difference with the Matsuno wavefunction (3.2) for a mode with
 $\epsilon = 0.2$ and
 $m=1$ (taking
 $\theta = y/R$ and
 $\beta = 2\varOmega / R$).
Additional zeros of  $\tilde {v}$ for
 $\epsilon = 0.2$. (a) We consider a mode with azimuthal wavenumber
 $m=1$ (purple circle). (b) Meridional velocity
 $\textrm {Re} ( \tilde {v}(\theta ) \,\textrm {e}^{\textrm {i} m \phi } )$ of the mode. (c) Comparison between the wavefunction
 $\tilde {v}(\theta )$ (red curve) and expression (3.2) for the closest Matsuno mode (black curve). The two wavefunctions fit well in the Yoshida waveguide but not at higher latitudes, and we notice that the mode on the sphere has
 $p=6$ zeros whereas the Matsuno mode has
 $p=4$ zeros.

Appendix B. North–south symmetry of the wavefunctions
Let us demonstrate that the meridional velocity wavefunction  $v(\theta )$ is either even or odd for any mode. Let us consider the mode of frequency
 $\omega$, represented by a complex-valued vector field
 $\boldsymbol{X} = (u(\theta ) \enspace v(\theta ) \enspace \eta (\theta ))^\top$ such that
 $\boldsymbol{\mathcal {H}} \boldsymbol{X} = \omega \boldsymbol{X}$, where the operator
 $\boldsymbol{\mathcal {H}}$ is expressed in (4.1). Since
 $f(\theta )$ and
 $\beta _{g} (\theta )$ are odd functions of the latitude,
 $\boldsymbol{\mathcal {H}}$ commutes with the composition of parity (
 $\theta \rightarrow -\theta$) and complex conjugation, which can be written as
 $\boldsymbol{\mathcal {P}} \boldsymbol{\mathcal {H}}(m) = \overline {\boldsymbol{\mathcal {H}}(m)} \boldsymbol{\mathcal {P}}$. Applying this equality to the vector
 $\boldsymbol{X}$, one sees that
 $\overline {\boldsymbol{\mathcal {P}} \boldsymbol{X}}$ is also an eigenvector of
 $\boldsymbol{\mathcal {H}}$ for the same frequency
 $\omega$, which means that there is a scalar
 $z$ such that
 $\boldsymbol{\mathcal {P}} \boldsymbol{X} = z \bar {\boldsymbol{X}}$. Additionally, since both parity and conjugation are mathematical involutions, the modulus of
 $z$ is
 $1$. Besides, the wavefunction
 $v(\theta )$ obeys a second-order differential equation with real coefficients (equation (3.3) of Müller & O'Brien (Reference Müller and O'Brien1995)). Therefore
 $v$ is a real-valued function, up to a constant phase that we choose to be zero. The scalar
 $z$ is thus equal to
 $\pm 1$ and
 $v$ has thus even (
 $z=+1$) or odd (
 $z=-1$) parity with latitude.
Furthermore, using only the first and third equations of the system (4.1), one can express the fields  $u$ and
 $\eta$ in terms of
 $v$ and its derivative
 $\textrm {d} v / \textrm {d} \theta$, and see that these two fields are purely imaginary. This means that the zonal velocity
 $u$ and height perturbation
 $\eta$ are in phase quadrature with the meridional velocity
 $v$, and that they both have even (odd) north–south symmetry if
 $v$ has odd (even) north–south symmetry. (Note that an odd function
 $v(\theta )$ actually reflects equatorially symmetric meridional velocity, and conversely even
 $v(\theta )$ corresponds to anti-symmetric meridional velocity.) This symmetry of the wavefunctions, which is also true for the modes of the unbounded
 $\beta$-plane, reflects the north–south symmetry of the geometry itself, which is present whether one is dealing with the unbounded
 $\beta$-plane or the sphere. This symmetry of the wavefunction
 $v(\theta )$ also implies that the zeros revealed on the sphere always come in pairs.
Appendix C. Weyl correspondence and symbol
Throughout the paper, we naturally use notions such as scalar product, Hermitian operator and Weyl symbol, assuming an implicit algebraic structure to the fields of the problem. Let us formally define these notions here. First of all, (4.1),  $\boldsymbol{\mathcal {H}} \boldsymbol{X} = \omega \boldsymbol{X}$ with
 $\boldsymbol{X} = (u \enspace v \enspace \eta )^\top$, implies that we work with a Hilbert space of three-component vectors, whose components are complex-valued functions of
 $\theta \in ]-{\rm \pi} / 2, {\rm \pi}/ 2[$. The matrix operator
 $\boldsymbol{\mathcal {H}}$ acts on this space. Since the component fields are defined by multiplying the real perturbed velocity components and elevation (up to factors
 $\sqrt {h_0},\sqrt {g}$) by a metric factor
 $\sqrt {\cos (\theta )}$, the metric term
 $\cos (\theta )$ in quadratic integrals over the sphere is absorbed. For instance, the mechanical energy of the perturbation is proportional to
 \begin{equation} \int_{-({\rm \pi}/{2})}^{{\rm \pi}/2} {\rm d} \theta (|u|^2 + |v|^2 + |\eta|^2), \end{equation}
which is a conserved quantity of the shallow-water equations. This leads to the following definition of the scalar product:
 \begin{equation} \langle \boldsymbol{X}_1, \boldsymbol{X}_2 \rangle = \int_{-({\rm \pi}/{2})}^{{\rm \pi}/{2}} {\rm d} \theta \boldsymbol{X}_1^{\dagger} \boldsymbol{X}_2, \end{equation}
where  $^{\dagger}$ stands for the transposition–conjugation of vectors and matrices. The operator
 $\boldsymbol{\mathcal {H}}$ is thus Hermitian for this scalar product, i.e. for any
 $\boldsymbol{X}_1, \boldsymbol{X}_2$, the equality
 \begin{equation} \langle \boldsymbol{X}_1, \boldsymbol{\mathcal{H}} \boldsymbol{X}_2 \rangle = \langle \boldsymbol{\mathcal{H}} \boldsymbol{X}_1, \boldsymbol{X}_2 \rangle \end{equation}
is satisfied. In detail, absorbing the metric term  $\sqrt {\cos (\theta )}$ in the definition of the fields redefines the scalar product in curved space as a Cartesian scalar product. This allows us to use the definition of the Weyl correspondence (or Wigner map) in flat spatial coordinates (i.e. without the necessity of introducing an elaborated Stratonovich–Weyl operator kernel (Gneiting et al. Reference Gneiting, Fischer and Hornberger2013)), which connects the wave operator
 $\boldsymbol{\mathcal {H}}$ of (4.1) to its Weyl symbol
 $\boldsymbol{\mathsf{H}}$, defined by expression (4.3), through the bijective map
 \begin{equation} \boldsymbol{\mathcal{H}} \boldsymbol{X}(\theta) = \frac{1}{2 {\rm \pi}} \int_{-({\rm \pi}/{2})}^{{\rm \pi}/{2}} {\rm d} \theta' \int_{-\infty}^{+\infty} {\rm d} p_\theta \exp({{\rm i} p_\theta (\theta - \theta')}) \boldsymbol{\mathsf{H}} \left(p_\theta, \frac{\theta + \theta'}{2} \right) \boldsymbol{X}(\theta'), \end{equation}
where we have used the conjugated momentum of  $\theta$,
 $p_\theta = (R/c) K_\theta$. Here
 $\boldsymbol{\mathsf{H}}$ is a function of
 $\theta$ and
 $p_\theta$; however, we rather use the variable
 $K_\theta$ in the paper, to avoid the
 $c/R$ term. Matrix
 $\boldsymbol{\mathsf{H}}$ is the matrix of Weyl symbols of the components of the matrix operator
 $\boldsymbol{\mathcal {H}}$. Those are either products with functions
 $F(\theta )$ (including
 $M$) or the derivative
 $-\textrm {i} \textrm {d} / \textrm {d} \theta$, whose symbols are
 \begin{equation} F(\theta) {\cdot} \longrightarrow F(\theta) \quad \text{and} \quad -{\rm i} \frac{{\rm d} {\cdot}}{{\rm d} \theta} \longrightarrow p_\theta. \end{equation}
An important property of the Wigner map is that an operator is self-adjoint if, and only if, its Weyl symbol is a Hermitian matrix (Hall Reference Hall2013), or just a real-valued function for scalar operators such as those of relations (C5a,b).
Appendix D. Definition and computation of the Chern numbers
The Chern numbers of the degeneracy points of  $\boldsymbol{\mathsf{H}}$ are computed in the same way as in Delplace et al. (Reference Delplace, Marston and Venaille2017), Perrot et al. (Reference Perrot, Delplace and Venaille2019), Venaille & Delplace (Reference Venaille and Delplace2021), Perez et al. (Reference Perez, Delplace and Venaille2022), Leclerc et al. (Reference Leclerc, Laibe, Delplace, Venaille and Perez2022) and Perez (Reference Perez2022). For a degeneracy point involving
 $\mu$ eigenbands (i.e. corresponding to an eigenvalue of
 $\boldsymbol{\mathsf{H}}$ of multiplicity
 $\mu$),
 $\mu$ Chern numbers
 $C_n$ are associated (
 $n$ is the band index), which can be computed as the flux of the Berry curvature of band
 $n$ through a closed surface enveloping the degeneracy point in the three-dimensional parameter space
 $(M, K_\theta, \theta )$ (see figure 11):
 \begin{equation} C_n = \frac{1}{2 {\rm \pi}} \iint_\varSigma {\rm d} \boldsymbol{\sigma} \boldsymbol{\cdot} \boldsymbol{F}_n, \end{equation}
where  $\varSigma$ is an integration surface enclosing the degeneracy point in parameter space and
 $\textrm {d} \boldsymbol {\sigma }$ an element of surface with outward orientation. Note that using either
 $m$ or
 $M$ (which is a function of both
 $m$ and
 $\theta$, strictly speaking) does not change the value of the Chern numbers. We chose the variable
 $M$ for convenience. Besides, the definition (D1) implies that
 $m$ is formally considered as a continuous variable of the symbol
 $\boldsymbol{\mathsf{H}}$, which is not a problem as far as the definition (4.3) is concerned. However, when it comes to finding the modes of
 $\boldsymbol{\mathcal {H}}$,
 $m$ must be an integer so that those are regular and single-valued on the sphere. The Berry curvature (Berry Reference Berry1984) is defined as
 \begin{equation} \boldsymbol{F}_n =
\boldsymbol{\nabla} \times ({\rm i} {\boldsymbol{\mathsf{\Psi}}}_n^{\dagger}
\boldsymbol{\nabla} {\boldsymbol{\mathsf{\Psi}}}_n) ={-}\mathrm{Im} \left(
\sum_{n' \neq n} \frac{{\boldsymbol{\mathsf{\Psi}}}_n^{\dagger}
(\boldsymbol{\nabla} \boldsymbol{\mathsf{H}}) {\boldsymbol{\mathsf{\Psi}}}_{n'} \times
{\boldsymbol{\mathsf{\Psi}}}_{n'}^{\dagger} (\boldsymbol{\nabla} \boldsymbol{\mathsf{H}})
{\boldsymbol{\mathsf{\Psi}}}_{n}}{(\lambda_n - \lambda_{n'})^2}\right),
\end{equation}
where the complex vectors  ${\boldsymbol{\mathsf{\Psi}}} _n$ are the normalised eigenvectors of
 $\boldsymbol{\mathsf{H}}$ for the eigenvalue
 $\lambda _n$ and the operator
 $\boldsymbol {\nabla }$ (
 $\boldsymbol {\nabla } \times$) is the gradient (curl) on the parameter space
 $(M , K_\theta, \theta )$. Expressions (D2) reveal essential properties of the Berry curvature: it is a three-component, real-valued vector field defined over the parameter space, for each band. It is smaller at points where the eigenvalue
 $\lambda _n$ is separated from the others, and it diverges at degeneracy points of the eigenband
 $n$. For any other point, the sum of the Berry curvatures of all eigenbands is zero; thus, for a given degeneracy point, the sum of the Chern numbers is zero as well. By analogy with the electric field produced by a static charged particle, the topological charge
 $C_n$ of a degeneracy point generates a Berry curvature
 $\boldsymbol {F}_n$ which diverges for positive Chern number and converges for negative Chern number (see figure 12). The Berry curvature
 $\boldsymbol {F}_n$ is otherwise divergence-free, i.e. its flux through any closed surface that does not contain a degeneracy point of the eigenband
 $n$ is zero. In terms of topology, the Chern number
 $C_n$ of a degeneracy point
 $P$ characterises and quantises the existence of singularities of the phase (i.e. topological defects) of the complex vector
 ${\boldsymbol{\mathsf{\Psi}}} _n$ when one attempts to continuously define it around
 $P$ (see e.g. Perez (Reference Perez2022), § 2.3). The Berry curvature of the inertia–gravity eigenband
 $n=+1$ is represented in figure 12, for
 $\epsilon < 4$ and
 $\epsilon > 4$.
Eigenbands and Chern numbers of the symbol (4.3). (a) Eigenvalues of  $\boldsymbol{\mathsf{H}}$ as functions of
 $(M,K_\theta )$, for different values of
 $f$ and
 $\beta _{g}$ (which can be formally considered as independent parameters, although they really are both functions of the latitude
 $\theta$). (b) The corresponding locations of
 $(f,\beta _{g})$. The dashed lines
 $f=\pm \beta _{g}$ indicate where the symbol has multiple eigenvalues. Spectra 1 and 3 are the local dispersion relations achieved for the actual prescribed functions
 $f(\theta ),\beta _{g}(\theta )$. (c) Position and Chern numbers
 $(C_{-1},C_0,C_{+1})$ of the degeneracy points of the symbol in parameter space
 $(M,K_\theta, \theta )$, for
 $\epsilon <4$ and
 $\epsilon >4$. The white zeros indicate that the corresponding eigenband is not involved in the degeneracy (integrating the Berry curvature on a closed surface in which there is no degeneracy point yields zero). The blue sphere is an example for the integration surface
 $\varSigma$ of definition (D1).

Berry curvature  $\boldsymbol {F}_n$ of the eigenband
 $n=+1$ of the Weyl symbol
 $\boldsymbol{\mathsf{H}}$. For
 $\epsilon < 4$ (a), there are three topological charges, which merge into a single non-charged degeneracy point for
 $\epsilon > 4$ (b). The centre of each plot is the point
 $(M,K_\theta,\theta )=(0,0,0)$.

The implication of the Chern numbers  $C_n$ for the topology of the complex-valued vectors
 ${\boldsymbol{\mathsf{\Psi}}} _n$, defined over the three-dimensional parameter space, is analogous to the quantisation of the topological defects of a smooth, real-valued vector field tangent to a surface (see e.g. Perez (Reference Perez2022), § 2.3). For each point where the vector field vanishes, one can define an integer which quantises the winding of the vector field around 0, following a closed path around this point in an anticlockwise direction (see figure 13). In this case, the sum of such numbers is equal to the Euler characteristic of the surface, in virtue of the Gauss–Bonnet theorem. However, this analogy cannot be considered as an equivalence, since we are dealing with a complex-valued vector field in a three-dimensional parameter space, instead of a real-valued vector field defined over two-dimensional manifolds.
Topological defects of a tangent vector field over the torus (square with periodic boundary conditions), whose winding numbers compensate, in virtue of the Gauss–Bonnet theorem (the Euler characteristic of the torus is 0). The integers are formally defined as the integral of  $\textrm {d} \xi / 2 {\rm \pi}$ along the corresponding path, where
 $\xi$ is the algebraic angle between the horizontal direction and the vectors. A topological defect having non-zero winding number is characteristic of the fact that such a function
 $\xi$ cannot be continuously defined around a defect (blue curves). However, it can be along a path that winds all three defects of compensating charges (purple curve). This graphic situation illustrates the topology of the shallow-water spectrum on the sphere in the case
 $\epsilon < 4$: there are several degeneracy points with non-zero Chern numbers which add up to zero for each eigenband. The vector field can be continuously deformed until the three charged topological defects merge into a topologically neutral point.

As far as computation of the Chern numbers is concerned, the 3-by-3 matrix  $\boldsymbol{\mathsf{H}}$ is simple enough so it can be done by direct numerical integration, which was performed with Mathematica using expressions (D2) and (D1). Our script can be found at https://github.com/ArmandLeclerc/STArWaRS. The values of the Chern numbers, given in the paper, are summarised in figure 11. For symbol matrices of higher dimension, such direct computation quickly becomes difficult, although other numerical methods are possible, adapted for instance from Fukui, Hatsugai & Suzuki (Reference Fukui, Hatsugai and Suzuki2005).