


1 Introduction
Studies of several deep ice cores have revealed the development of highly preferred c-axes orientations (Gow and Williamson, 1976; Herron and others, 1985; Lipenkov and others, 1989). A detailed study of the textures and fabrics in the GRIP ice core, drilled at Summit (central Greenland) during the years 1989–92, was described in detail by Thorsteinsson and others (1995, in press). An outline of the evolution of these parameters in the interval 100–2800 m is presented in this paper (section 3).
Fabrics generally reflect the entire deformation history of ice particles, from their deposition at the ice-sheet surface down to their present depth (Duval and Castelnau, 1995). Polar ice displays an increasing viscoplastic anisotropy as the fabric develops. A large strain-rate variation with the direction of the applied stress has been observed in both laboratory and in-situ measurements (Russell-Head and Budd. 1979; Duval and Le Gac, 1982; Gundestrup and Hansen, 1984; Shoji and Laogway, 1988; Budd and Jacka, 1989). This property renders the isotropic Norton–Hoff constitutive relation (the “Glen law”) inadequate for modelling large-scale ice flow in cold ice sheets. Polycrystal anisotropy may introduce flow instability and could be the cause of the disturbed stratigraphy observed below 2850 m depth in the GRIP core. Lliboutry (1993) has proposed an anisotropic constitutive relation for polar ice, where the rheological parameters are determined from the polycrystal fabric. However, since fabrics develop with strain, these parameters must also change as the ice deforms. A more general description of the mechanical behaviour is given by physically based polycrystal deformation models, which relate the deformation of individual grains to that of the whole polycrystal. The aim of this paper is to compare fabric development simulated with such an approach with that measured along the GRIP ice core.
Intracrystalline dislocation glide is the dominant deformation mode for polycrystalline ice (Pimienta and Duval, 1989). Ice crystals display an extreme viscoplastic anisotropy, with only two independent easy-glide directions (basal glide). The contribution to the total deformation of other slip systems such as climb of basal dislocations on prismatic planes or non-basal dislocation glide is not significant (Duval and others, 1983; Fukuda and others, 1987). Within a polycrystal, the deformation of grains must be compatible, i.e. the formation of gaps between adjacent grains and an overlap of two adjacent crystallographic lattices is not possible. In the case of hexagonal crystals, Hntchinson (1977) has shown that only four independent slip systems per grain are sufficient Due to the low number of easy-slip systems in ice crystals, a non-uniform stress state develops within polycrystals as deformation proceeds and load is transferred to grains poorly oriented for deformation by basal glide. As a result, the strain rate decreases by several orders of magnitude during the primary creep of polycrystals (Jacka, 1984). In polar ice, grain-boundary migration associated with dynamic recrystallization always occurs. According to Lliboutry and Duval (1985), this migration can relieve incompatibilities at grain boundaries (GB). A lower level of internal stress is then expected.
Three regimes of dynamic recrystallization are distinguished in polar ice (Pimienta and Duval, 1989; Alley, 1992; Duval and Castelnau, 1995): (i) Grain growth, driven by the surface energy of GB. Here, smaller grains are consumed by larger ones and the average crystal size increases linearly with time. This regime is observed generally in the upper few hundred metres of the large polar ice sheets. Since there is no correlation between grain-size and crystallographic orientation, this mechanism can influence fabric development only by relaxing the internal stress field (Castelnau and others, in press). (ii) Rotation recrystallization (polygonization). This results in the progressive misorientation of sub-boundaries, due to heterogeneous deformation within grains, GB migrate slowly, with a velocity slightly higher than that observed in the grain growth regime. The migration is driven by both GB energy and stored strain energy. According to Alley and others (1995a), the polygonization process counteracts further grain-size increase due to grain growth below 400 m depth in the Byrd Station core (Antarctica), In simple shear deformation, this process may stabilize the single-maximum fabric usually observed, where the c axes are normal to the macroscopic shear plane (Duval and Castelnau, 1995), (iii) Migration recrystallization, resulting from the nucleation of grains by GB bulging and the rapid migration of GB. The fabric then reflects the instantaneous stress configuration. The strain corresponding to a wave of recrystallization is around 0.07 (Steinemann, 1954). This regime only occurs above a critical temperature of about −12°C.
The aim of polycrystal deformation models is to link the microscopic with the macroscopic state, i.e. stress and strain rate at the grain and polycrystal scales, respectively. Such models have been developed in glaciology (Azuma and Higashi, 1985; Fujita and others, 1987; Alley, 1988; Lipenkov and others, 1989; Azuma, 1995) but only for uniaxial and biaxial stress states. It is not evident how tins kind of model can be generalized to an arbitrary stress state.
A static model (Sachs, 1928) has recently been applied to polar ice (Van der Veen and Whillans, 1994; Castelnau and Duval, 1994). This model, which assumes a uniform stress state (i.e. each crystal is subjected to the same stress), fulfils the stress-equilibrium condition across GB. However, since only the softest sup systems are active, the deformation of adjacent grains is incompatible. The Other difficulty inherent in this model, which provides a lower bound for the stress, is that the rate of basal glide in each grain is adjusted to reproduce the mechanical response of an isotropic polycrystal. Consequently, this parameter depends on the fabric (Lliboutry and Duval, 1985).
Another simple theory was proposed by Taylor (1938), m which the strain is assumed to be uniform (i.e. each crystal is subjected to the same strain). This model leads to an upper bound for the stress and is not well stated for highly anisotropic materials. Indeed, Eve independent slip systems are required to produce any arbitrary imposed strain rate, since the strain-rate tensor possesses five independent components (ice being assumed to be incompressible). Furthermore, the equilibrium condition across the GB is violated. Applications to geological materials have been given by Wenk and others (1986, 19891). Real polycrystal behaviour necessarily lies between static and Taylor estimations.
A more reasonable estimate of the macroscopic behaviour can be obtained with the viscoplastic self-consistent (VPSC) theory developed by Hutchinson (1976) and formulated in a general way for the large deformation of anisotropic materials by Molinari and others (1987). Within the formulation of Molinari and others, the stress- and strain-rate fields are calculated in the polycrystal by solving stress equilibrium and incompressibility equations. The form of the non-linear constitutive relation of the polycrystal is not explicitly known. It is approximated by its tangent behaviour in the neighbourhood of the applied stress on the polycrystal surface. The whole polycrystal volume is discretized into small volume elements, in which the stress stale is uniform, In its simplest form, the VPSC model consists of regarding each grain of the polycrystal as an inclusion embedded in an infinite homogeneous medium, which behaviour represents that of the polycrystal. This approximated solution has also been presented by Lebensohn and Tomé (1993) for anisotropic materials and will be used in the present work. This approach, briefly presented in section 2, predicts an intermediate solution between uniform stress and uniform strain bounds. Applications to rocks and metals have been given by Wenk and others (1989a), Tomé and others (1991) and Lebensohn and Tomé (1994), The first application to ice polycrystals was presented by Castelnau and others (in press).
The GRIP ice tore was drilled exactly at the actual crest of the Greenland ice sheet. At this location, shear deformation is not expected to be significant in comparison with axial deformation, at least in the upper half of the core. This situation leads to reliable estimates of the total deformation of the ice with depth. The data gathered from the GRIP core thus offer a unique possibility to test polycrystal models. In this paper, we compare the fabric development observed along the GRIP ice core for the depth range 0–2800 m using that calculated with the VPSC model of Lebensohn and Tomé (1993). Limit behaviours given by louer- and upper-bound models are also presented for comparison. The validity of the model, as well as the effects of recrystallization processes, will be discussed.
2 Description of Polycrystal Models
In this section, we present the main equations of the polycrystal deformation models used in this work (equations are expressed here using the Einstein summation convention on repeated indices). The reader will find more details about general VPSC formulation in Hutchinson (1976), Molinari and others (1987), and about the VPSC model we use in this work in Lebensohn and Tomé (1993). A general assumption of these models is that crystals deform by dislocation glide only and dynamic recrysiallization processes are not taken into account.
At the grain level, the resolved shear stress on the slip system s is given by
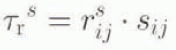
where  denotes the microscopic deviatoric Cauchy stress tensor. The Schmid tensor ṟ
s
expresses the orientation of the slip system s relative to the reference frame in which
 is calculated so that

where n
s
andb
s
are, respectively, unit vectors parallel to the slip-plane normal and to the slip direction associated with the system s. The shear rate  s
on the system s is given by the following power law:

When  0 is a reference shear rate, and n
s
and τ
0
s
denote, respectively, the stress sensitivity and the reference resolved shear stress (RRSS) of the system s. Finally, the strain rate ḏ at the crystal scale is given by a summation over all S slip systems, hence
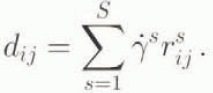
We call  and
 the deviatoric Cauchy stress and strain-rate tensors, respectively, applied uniformly on the polycrystal surface. The aim of polycrystal deformation models is to evaluate the microscopic state within a polycrystalline aggregate. The volume average (denoted 〈…〉) of microscopic stress and strain rate must be equal to the corresponding macroscopic quantities
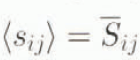
and

Thus, a relation linking microscopic and macroscopic stales must be introduced. This micro–macro relation completely determines the response of the polycrystal.
The calculation principle of the VPSC model, which lies between static (s
ij; =  ij
) and Taylor (d
ij
=
 ij
) limits, is schematically presented in Figure 1: each grain of the polycrystal is replaced by an ellipsoidal inclusion embedded in an infinite homogeneous equivalent medium (HEM), whose behaviour is equivalent to that of the w hole polycrystal. The constitutive relation of the HEM is a result of the calculation and is given in the neighbourhood of
 by the first-order Taylor expansion of the non-linear constitutive relation of the polycrystal (which is not known). It lakes the following pseudo-linear form, which is frame-indifferent:

 ,
 ,
 and Ḏ define here deviatoric stress and strain rates, respectively, at infinity and within the HEM.
 (tg) is the fourth-rank tangent compliance tensor, which depends on
 and also on structure parameters. The stress and strain rate within the inclusion (i.e. the grain) are assumed to be uniform. The so-called “one-site” approximation has been used by Lebensohn and Tomé (1993), i.e. the calculation of stress and strain rate of a grain does not take into account the influence of neighbouring grains. Consequently, only the interaction between the grain and the HEM is considered. This treatment leads to an interaction equation that linearly relates stress and strain rate in each grain with those on the polycrystal surfaces (Eshelby, 1957; Hill, 1965; Lebensohn and Tomé, 1993) so that

The interaction tensor  can be expressed as a homogeneous function of degree 1 in
 and depends on the shape of the inclusion. In the VPSC model of Lebensohn and Tomé, the macroscopic compliance and the interaction tensor are fully determined. This allows the HEM to have any anisotropic response.
Calculation scheme of the VPSC model: each grain is considered as an inclusion in a homogeneous equivalent medium, whose mechanical behaviour is that of the polycrystal.

Once convergence is achieved, the rotation rate  of crystallographic axes, which determines the fabric evolution, is calculated for each grain. It is given by the difference between the rotation rate of the HEM in the neighbourhood of the considered grain and the rotation rate of the grain itself. When the macroscopic rotation is null, it is expressed as

for the VPSC model. The microscopic plastic rotation rate  depends on all shear rates
 s
in a grain and on the orientation vectors n
s
and b
s
. The rotation rate
 of the ellipsoid depends on the strain-rate deviation (d
ij –
 ij
), ou the grain shape and on the macroscopic compliance
 . Within the Taylor model,
 vanishes, and Equation (9) gives

This relation is also used within the static model. It implies that the rotation of the neighbourhood of each grain (the local rotation) is null. Thus, the static model is incoherent, since rotations are completely constrained, and deformations completely free.
In this study, grain shape is not updated during the deformation (i.e. grains remain spherical). This parameter is not found to have a significant influence on fabric development along the GRIP core. Ice crystals are assumed to deform by dislocation glide on basal  , prismatic
 and pyramidal
 slip systems. A stress exponent n
s
= 3 is taken for all systems. In ice sheets, the stress exponent n of polycrystalline ice lies between 1 and 3 (Lliboutry and Duval, 1985). However, it has been verified that the value of n has little influence on the results presented here. The RRSS for basal, prismatic and pyramidal slip was tuned in order to reproduce, with the VPSC model, the mechanical behaviour of both a monocristal and an isotropic polycrystal (Castelnau and others, in press) so that

A very large resistance is then attributed to non-basal systems. Under these conditions, the contribution of basal slip to the total deformation is more than 90% with the VPSC model and more than 99% with the static model. However, it represents only 40% with the Taylor model, i.e. the remaining 60% are due to prismatic and pyramidal slip. This estimation is not satisfactory since a very low density of non-basal dislocations is observed in ice crystals (Fukuda and others, 1987). On the other hand, for conditions leading to n = 3, the strain rate of an isotropic polycrystal calculated with the static model is two orders of magnitude larger than that determined experimentally for the same stress. Thus, static and Taylor models cannot be used for realistic modelling of polycrystalline ice behaviour.
3 Evolution of Textures and Fabrics in the Grip Core
Figure 2 presents an outline of the evolution of textures and fabrics (for more details, see Thorsteinsson and others, 1995, in press), together with the strain history (Dahl-Jensen and others, 1993; personal communication from S. J. Johnsen), temperature profile (Johnsen and others, 1995) and estimated time-scale (Dansgaard and others, 1993).
The schematic grain-size profile is shown in figure 2a. Between 100 and 650 m, average crystal size increases linearly with time in the regime of normal grain growth. Below 650m, no further increase in grain-size is observed. The entire interval 650–2800 m appears to be affected by the subdivision of crystals due to rotation recrystallization. This process likely causes the hait in grain growth at 650 m depth. The transition from Holocene ice to Wisconsin glacial ice is encountered as 1625 m depth and grain-size decreases as the ice age is entered. This can probably be attributed to the effects of soluble impurities, which are believed to impede GB migration if present in sufficiently high concentrations (Alley and others 1986; Paterson, 1991). The GRIP data show an anti-correlation between grain-size and soluble impurity concentration, particularly in the lower Wisconsin and “Eemian” ice below 2800 m (Thorsteinsson and others, 1995, in press). Below 2600 m, grain-size starts increasing again, probably due to the higher ice temperature. Coarse-grained ice is found in the “Eemian” and “Pre-Eemian” ice below 2800 m. There is clear indication that migration recrystallization is associated with ibis texture. The relatively high temperature in this zone (> −15°C) is compatible with this recrystallization regime. The fabric of deep ice, between 2800 m and 3028 m (bedrock), has probably been affected by this rapid recrystallization process and is thus not considered in this study.
The measurements of c-axis orientation (Fig. 2b) have revealed a steady fabric development in the core, from random orientation at the surface to a strongly preferred orientation in the deeper parts. A vertical single maximum has formed at 2200 m and persists clown to 2800 m depth. No sharp contrast in the fabric strength is observed across the Holocene–Wisconsin climatic transition. The steady evolution of the fabric is compatible with the ice-divide location of the Summit drill site, where the ice movement is mainly vertically downwards and hardly any horizontal movement has been recorded (personal communication from N. S. Gundestrup). Since Summit is located at the top of a dome, ice probably deforms by vertical uniaxial compression. The circular shape of the GRIP fabrics is compatible with this deformation state (Alley, 1988).
The time-scale for the GRIP core (Fig. 2e) relies on annual-layer counting in the Holocene ice and flow modelling deeper down (Dansgaard and others, 1993) using a simple Dansgaard–Johnsen type flow model (Dansgaard and Johnsen, 1969). The parameters of this model were determined such that the resulting time-scale matches the age of dated reference horizons down to 1625 m depth. This model assumes steady ice surface and steady bedrock (horizontal, constant elevation). The present accumulation rate (0.23 m ice equivalent year−1) represents the mean annual accumulation rate during the whole Holocene period. The vertical deformation rate is supposed to be constant (with depth) from the surface down to a depth of 1750 m (Dahl–Jensen and others, 1993). Deeper down, the vertical strain rate is assumed to decrease linearly with depth, reaching a zero value at the bedrock. Total thinning of annual hivers from their initial thickness (at the surface) to their present thickness (deep in the ice sheet) has also been derived by this flow model. The profile of the annual-layer thickness ratio a/a 0 is presented in figure 2c. These data yield the cumulative vertical strain ε ZZ (deformation gradient) which the ice has been subjected to along the ice core and
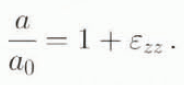
These results indicate that the GRIP ice has experienced considerable vertical compression: 0.25 at 650 m. 0.64 at 1625 m and more than 0.9 below 2400 m depth.
(a) Schematic grain-size profiles from the GRIP core. The full curve shows average horizontal crystal diameters, the dashed curve vertical diameters (Thorsteinsson and others, 1995b). (b) Selected c-axis fabric diagrams from five different depths in the GRIP core: 249.2, 991.1, 1625.8, 2064.2 and 2696.1 m. The centre of the diagrams indicates the in-situ vertical direction (Thorsteinsson and others, 1995b). (c) Ratio a/a0 of the present thickness if the annual layer in the ice sheet to the original thickness of the same layer during its deposition at the surface (Dahl–Jensen and others, 1993; personal communication from S. J. Johnsen). (d) Temperature profile in the GRIP borehole (Johnsen and others, 1995). (e) Estimated time-scale (Dansgaard and others, 1993).

Ice temperature (Fig. 2d) does not deviate more than 0.5°C from the present mean annual surface temperature (−32°C) in the uppermost 1800 m of the drillhole. Below this depth, the temperature increases steadily to −15°C at 2800 m, and reaches −9°C at the bottom of the hole.
4 Results and Discussion
Fabric development along the GRIP core was simulated with the VPSC model. Results will also be compared to those obtained with static and Taylor models. The initial polycrystal, which is an input for the models, is randomly oriented and contains 200 grains. The imposed deformation is a vertical uniaxial compression. The polycrystal models relate the fabric pattern to the vertical deformation ε zz . The depth corresponding to the simulated fabrics is calculated using the estimation of the annual-layer thickness ratio a/a 0 (Fig. 2c).
Figure 3 shows the GRIP c-axis fabric observed at 991.1 m depth, compared to that found with static, VPSC and Taylor polycrystal models for a vertical deformation of 0.387, corresponding to about the same depth (990 m). We found that the general GRIP fabric pattern can be reproduced numerically. c axes rotate towards the principal direction of compression, i.e. towards the in-situ vertical direction. With the static model, the fabric pattern shows a small circular girdle. However, the distribution of c axes around the vertical predicted with each model appears to be very different. A very pronounced fabric is found with the static model and a much more open one with the Taylor model. The self-consistent estimate gives an intermediate result, close to that of the static model. At a depth of 990 m, the measured GRIP fabric lies between the estimations of VPSC and Taylor models.
Comparison of (a) the fabric pattern of the GRIP ice for a depth of 991.1 m (Thorsteinsson and others, 1995b), with fabrics simulated in uniaxial compression with (b) static, (c) VPSC and (d) Taylor model for a vertical strain of 0.387, corresponding to a depth of 990 m. The centre of the diagrams indicates the in-situ vertical direction (a) and the direction of compression (b–d).

Let us now compare in-situ and simulated fabric concentrations for the whole 0–2800 m range of depth. In Figure 4, the average distribution of c-axes orientations is represented with a statistical parameter, c axes are treated as unit vectors (denoted c g ) within a hemisphere. The strength of orientation R is proportional to the norm of the sum of all c g vectors so that

where N is the total number of grains in the polycrystal. The parameter R is equal to 0% for a randomly oriented polycrystal and takes a maximal value of 100% when all c axes are exactly parallel (Wallbrecher, 1978). Front Figure 4, the difference between average fabric concentration predicted by static and VPSC models becomes significant only when the strength of orientation is higher than 80%, i.e. for strongly pronounced fabrics. Both models reproduce very well the strength of orientation of the GRIP ice from the surface clown to 650 m depth. From figure 2a, this depth range exactly corresponds to the entire grain-growth zone. Below 650 m, it clearly appears that the in-situ fabric evolution rate is lower than that predicted by the VPSC model. According to Castelnau and others (in press), this model also gives a good estimation of the fabric concentration for Vostok (1720 m) and Dome C (850 m) ice (Antarctica). These ice samples come from within the grain growth zone of the Antarctic ice sheet.
Below 2000 m depth, the strength of orientation of the GRIP core is best estimated using the Taylor bound model. However, the microscopic behaviour in ice polycrystals is very badly estimated using this model, which requires a large activation of non-basal systems, Thus, the Taylor model cannot be invoked for a realistic prediction of texture development. Features of simple shear (folds) are observed in the GRIP core below 2483 m depth (Alley and others, 1995b). But simulated and measured fabrics start to differ at only 650 m. In an ice sheet, the horizontal shear stress may increase linearly with depth and with the surface slope. Simple shear can then hardly be the predominant deformation in the upper part of the GRIP core and cannot explain this discrepancy. The assumption made in the Dansgaard–Johnsen flow model on the variation of the vertical strain rate with depth could affect results only below 1625 m depth. For Holocene ice, the assumption of the constant vertical strain rate is assessed by direct measurements of the vertical strain. We therefore suggest that the slow fabric evolution below 650 m, as compared with the modelled ones, is probably attributed to the effects of dynamic recrystallization.
Evolution of the strength of orientation with depth. Results of Static, VPSC and Taylor models, compared to the measured GRIP data (triangles). The dash-dot-dot curve is a polynomial fit of these data. GRIP data are from Thorsteinsson and others (1995b).

The nucleation of new strain-free grains by sub-grain rotation is expected below 650 m depth in the GRIP core. According to Thorsteinsson and others (in press), sub-grain boundaries in the GRIP ice were first observed at 380 m depth and appear frequently below 600 m. The halt in grain growth below 650 m was attributed to this polygonization effect, which could also be the origin of the slower fabric-development rate below 650 m. In the following section, we attempt to give a quantitative estimate of the effect of this recrystallization process. We will check whether this regime is compatible with the observed grain-size, vertical deformation rate, fabric evolution and grain shape, at least above a depth of 1625 m.
Let us now assume that grain growth still occurs below 650 m depth but is counteracted by rotation recrystallization. According to Duval and Castelnau (1995), the GB migration rates within a rotation recrystallization regime and within a grain-growth regime are of the same order of magnitude. The variation of ice temperature from the ice-sheet surface down to 1800 m depth is less than 0.5°C. Thus, ice temperature can be considered as being constant with depth. According to the Dansgaard–Johnsen model used to estimate the time-scale, a constant deformation rate down to 1750 m depth seems to be a good estimate of the in-situ flow. We can then consider, as a first approximation, that the grain-growth rate (defined as the growth rate of mean grain area measured on thin sections) is constant for all the Holocene ice and is equal to the value found by Thorsteinsson and others (in press) for depths between 0 and 650 m (K = 3.8 × 10⁻³mm2 year−1). With this value, a constant grain-size between 650 and 1625 m depth is obtained if each grain is subdivided into two parts every 2000 years.
When rotation recrystallization occurs, the misorientation of sub-boundaries increases until the critical angle 2θ c, which determines the transition between sub-boundary and grain boundary, is reached. According to Poirier (1985), the commonly adopted value for this critical angle is about 10–15°. As shown in Figure 5, an increasing misorientation produces changes in grain dimensions. The associated strain rate can be easily calculated and is found to be less than 4% of the vertical strain rate estimated at Summit (≈10−4 year−1), Polygonization effect does then not significantly contribute to the total deformation. This result is in accordance with the initial assumption of a constant strain rate down to a depth of 1750 m.
We consider now a grain from the GRIP ice at 991.1 m depth, with a c axis forming a 45° angle to the vertical. The time needed by this c axis to rotate towards 20° from the vertical, as deformation proceeds, can be estimated with the VPSC model. The result is about 1800 years, a value which is of the same order as the 2000 years found above. This means that rotation recrystallization is not efficient enough to be the predominant process for fabric development, i.e. to produce fabrics completely different from those due to intracrystalline slip. However, the formation of new grains by the progressive misorientation of sub-boundaries should slow down the development of fabrics by slip. The discrepancy between the evolution of fabrics along the GRIP core and that given by the VPSC model (Fig. 4) can be explained by the occurrence of this physical process. Furthermore, a critical misorientation of 10–15° is compatible with the most concentrated fabric found in the GRIP core (at 2586 m depth), which displays an aperture half-angle of 10–20°.
Finally, due to the vertical compression, initially spherical grains will be present after 2000 years, an aspect ratio (i.e. the ratio of horizontal size to vertical size) of 1.4 on average. Due to rotation recrystallization, the mean aspect ratio of grains deep in the GRIP core should then be around 1.2. This value compares well with that measured on thin sections between depths of 650 and 1625 m, which is 1.32 on average (Fig. 2a).
Progressive misorientation of a sub-boundary and associated deformation.

This simple calculation is only a rough quantitative estimate of the influence of rotation recrystallization on fabric development. But it appears that this recrystallization regime is fully compatible with the textures and fabrics of the GRIP ices above 1625 m and could completely explain the constant grain-size and the slower fabric development below 650 m. A similar conclusion, resulting from the observation of the distribution of c-axes orientation in the Byrd Station core, was given by Alley and others (1995a).
We have shown in this study that the VPSC model provides a good estimate of the c-axis fabric development within the grain-growth zone. Below 650 m depth, the influence of dynamic recrystallization is significant. A simple calculation shows that rotation recrystallization could completely explain discrepancies between model predictions and observations. The introduction within the YPSG polycrystal model of the effect of this recrystallization regime needs to be investigated to improve the simulation of fabric development in polar ices.
Acknowledgements
This work is a contribution to the Greenland Ice-core Project, carried out at Summit, central Greenland. Financial support was provided by the national funding bodies of Belgium, Denmark, France, Germany, Iceland, Italy, Switzerland, United Kingdom, under the auspices of the European Science Foundation. This work was also supported by the Programme National d’Études de fa Dynamique du Climat, CNRS–France. We are very grateful to R. Lebensohn and C. Tomé for allowing us to use their self-consistent model, to S. J. Johnsen for having given us the latest estimation of the annual layer thickness ratio, to N. Gundestrup for providing the latest temperature profile and to A. Salamatin for fruitful discussions. This paper is contribution No. 944 of the Alfred-Wegener-Institut.



