Introduction
When an image is projected onto the retina, the edges between regions of different luminance contain much of the information about objects in the world. Typically, edges are characterized by their position, orientation, and contrast. However, in the natural environment, edges are not always sharp; thus, edges can also be characterized by the degree of blur. Image blur may be due to depth relative to fixation, shadows cast by objects, and even by rapid motion.
Fig. 1 is an example of the range of sharp and blurred edges in a natural scene. Objects at the point of fixation will generally be sharp because normal young primate eyes accommodate to bring objects at fixation into focus, but outside of the center of the fovea, edges will be blurred to variable degrees depending on distance from the plane of fixation. Of course, visual acuity is less outside of the fovea, and peripheral vision is inferior to foveal in, for example, sensitivity to crowding effects, but basic acuity falls off surprisingly slowly with eccentricity from the fovea (Kiorpes & Kiper, Reference Kiorpes and Kiper1996), and at least in the parafoveal region, different degrees of image blur should be readily detectable.
In natural scenes, edges typically have a range of sharpness to them, although we tend not to notice this because our judgment of the sharpness of an image is dominated by the fovea.

Sharp and blurred edges of the same overall luminance contrast look different, which suggests that changing the amount of blur of an edge may affect the neuronal responses to that edge. Decreasing the contrast of a sharp edge has the subjective effect of making the edge appear less salient, and as stimulus contrast is reduced, the response latency of visual cortical neuronal responses is increased (Sclar & Freeman, Reference Sclar and Freeman1982; Reid et al., Reference Reid, Victor and Shapley1992; Albrecht, Reference Albrecht1995; Gawne et al., Reference Gawne, Kjaer and Richmond1996; Carandini et al., Reference Carandini, Heeger and Movshon1997; Gawne, Reference Gawne1999a; Gawne, Reference Gawne2000). As a blurred edge could be considered to be subjectively less salient than a sharp edge, it could be that blurring a high-contrast edge might also increase the latency of the visual cortical neurons that are responding to it.
Blurring a sharp edge selectively removes higher spatial frequencies, and sharpening an image selectively increases higher spatial frequencies. A number of studies have shown that the responses of visual neurons show dynamic spatial frequency tuning; that is, visual neurons are initially most sensitive to lower spatial frequencies, but over time, the same neurons become sensitive to higher spatial frequencies (Bredfeldt & Ringach, Reference Bredfeldt and Ringach2002; Mazer et al., Reference Mazer, Vinje, McDermott, Schiller and Gallant2002; Frazor et al., Reference Frazor, Albrecht, Geisler and Crane2004; Allen & Freeman, Reference Allen and Freeman2006). Because blurring an edge changes the balance of spatial frequencies that by themselves elicit different response timings, it is reasonable to suppose that blur could have strong effects on the dynamics of neuronal responses.
There is only one previous study that examined the effects of stimulus blur on single-unit responses in early visual cortex (Siguenza et al., Reference Siguenza, Heide and Creutzfeldt1987), but that study did not examine the response dynamics. The effects of stimulus blur on the visual evoked potential (VEP) in human have been investigated (Sokol & Moskowitz, Reference Sokol and Moskowitz1981; Bobak et al., Reference Bobak, Bodis-Wollner and Guillory1987), and it was found that, for at least some conditions, both decreasing contrast and increasing blur could increase response latency. However, although suggestive, it is not clear that one can directly compare the VEP to the responses of single visual cortical neurons. To date, there are no studies that have investigated the effects of response blur on the temporal response dynamics of visual cortical neurons.
In this study, we directly compared the response dynamics of V1 neurons to edges defined by different levels of contrast and blur. Decreasing the contrast of a sharp edge had the expected effects on response magnitude and latency, but blurring a high-contrast edge had no detectable effect on either the magnitude or the timing of the neuronal responses. Some of the data from this study have been reported in abstract form (Risner & Gawne, Reference Risner and Gawne2007).
Materials and methods
Animals, surgical procedures, and behavioral training
All methods involving experimental animals were approved by the University of Alabama at Birmingham (UAB) Institutional Animal Care and Use Committee. Two macaque monkeys (Macaca mulatta and Macaca fascicularis) participated in this study. Prior to recording, each animal was placed in a stereotaxic device, and a craniotomy was performed over the striate cortex using standard sterile techniques. Custom-made Polyetheretherketone (PEEK) strips were attached to the cranium with ceramic or metal screws in order to mount a head-post holder. A head post could be attached to the holder, which was attached to the animal’s cranium, and then attached to a primate chair to maintain the animal’s head in a fixed position. A stainless steel chamber was placed over the craniotomy, and dental acrylic was used to affix the chamber to the skull. During surgical procedures, the animals were maintained under deep anesthesia with isoflurane.
After the animals recovered from surgery, they were trained to fixate within 0.5 deg of a small white square for a juice reward. Stimuli were presented on a cathode ray tube computer monitor (Korea Data Systems, Garden Grove, CA). The monitor had a refresh rate of 85 Hz, measured 54.34 cm diagonally, and was positioned 57 cm from the subject’s eye. The display was viewed binocularly. A video-based eye tracker (ISCAN, Burlington, MA) was used to monitor eye position.
Electrophysiological recording procedures and data analysis
Recordings were made with glass-coated tungsten microelectrodes of approximately 1.2 MΩ (FHC, Bowdoinham, ME). Microelectrode position was manipulated using a hydraulic microdrive (model 95; Narishige, Tokyo, Japan). The microelectrode was inserted into the recording chamber and advanced through the dura. The neurons classified as V1 were recorded on the surface just posterior to the lunate sulcus, and their receptive field locations changed with changes in position within the recording chamber consistent with previous studies (Gatass et al., Reference Gatass, Gross and Sandell1981). Single-cell and multiunit responses were amplified (model 1800; A-M Systems, Carlsborg, WA), presented on an oscilloscope, and stored on a computer. Action potentials were digitized at a sampling rate of 31.25 kHz.
Fifty-one single- (n = 27) and multiunit (n = 24) responses were collected in area V1 between the two subjects. Spikes were sorted off-line using a method that decomposes the waveform of each spike into two principal components (Abeles & Goldstein, Reference Abeles and Goldstein1977). While this algorithm is as good as or better than most used for isolating extracellular action potentials with a single microelectrode, it is still technically possible that for some recordings, there were more than one neuron in a cluster. Some of our single-unit recordings had high peak firing rates, which might suggest multiunit activity. Single units were defined as well-isolated units that formed discrete clusters in principal component space and had well-defined refractory periods in autocorrelograms. Multiunits did not meet these criteria but still had the appearance of single units. On analyzing single- and multiunit responses, a spike density function was produced by convolving the train of action potentials with a σ = 3 ms Gaussian kernel, which has the effect of low-pass filtering with a cutoff of 44 Hz. When using a spike density function with a σ = 3 ms, it does not take many spikes to get a high peak firing rate. For example, a burst of just three spikes with an interspike interval of 3 ms gives a peak rate of 300 spikes/s.
Response latency was measured from the average of responses to each stimulus between 30 and 200 ms; this interval was chosen so that off-responses were not included in the data analysis. The response latency was defined as the time to when the spike density was half the maximum. This technique matches the latency that one would assign by eye and is not biased by the number of trials (Lee et al., Reference Lee, Williford and Maunsell2007). Responses evoked when the subject’s eye was not directed within 0.5 deg of the fixation target were not analyzed.
It is important to note that, although our fixation window was 1 deg square, for each individual trial, the eyes were much more stable than this. This within-trial drift was too small to be accurately measured with our video tracking system, but previous results have shown that monkeys engaged in a fixation task have average drift rates that range from 0.1 to 11.9 min of arc/s, horizontal and vertical components of eye position both considered (Skavenski et al., Reference Skavenski, Robinson, Steinman and Timberlake1975). This is equivalent to a drift ranging from 0.00032 to 0.03 deg in a 200-ms interval. Thus, the size of the fixation window does not cause the stimuli to be blurred by the image slipping ±0.5 deg because the eye position is stable for each stimulus presentation. If this were not so, then rhesus monkeys would have extremely poor visual acuity. In other experiments, the responses to thin high-contrast single lines and step edges of different contrast were recorded under similar conditions to those employed here (Gawne, Reference Gawne1999b). If averaging the responses to the presentation of a thin line whose position is stable with each presentation, but whose position varies from one presentation to the next, were to result in the same pattern of visual cortical response as to a single thick line of lower luminance, then the averaged responses to the thin high-contrast line should appear to be similar to that of a low-contrast step edge, but instead, the response latency of a thin high-contrast line averaged over multiple stimulus presentations matches that of a high-contrast step edge. Stable fixations with some variability of eye position between trials do not equate to the blurring of a stimulus caused by rapid motion.
Recording from single and multiunits in the visual cortex of awake monkeys has the disadvantage that it is not in general possible to classify or map the receptive fields of the neurons as in an anesthetized paralyzed preparation. However, the units we recorded from were likely all complex cells as the responses appeared to be robust to small eye position changes when hand mapping with oriented bar stimuli and because when correlating horizontal and vertical eye position shifts within the fixation window with response magnitude for none of the neurons studied was the correlation coefficient r significant at P < 0.05.
Temporal modulation of the responses
It has been shown that, under some conditions, significant information about a visual stimulus can be carried by variations in the temporal response profile of visual cortical neurons (Richmond & Optican, Reference Richmond and Optican1990). The majority of this temporally encoded information is carried in changes in response latency (Oram et al., Reference Oram, Xiao, Dritschel and Payne2002), and any significant other temporal modulation should be readily visible in the spike density functions. However, we also explored the possibility that there might be more subtle changes in the temporal responses of these neurons to changes in blur by calculating histograms of interspike intervals and the autocorrelograms. The interspike intervals were only calculated for the isolated single neurons, and the autocorrelograms were calculated both for only single neurons and for all units in this study combined. As there were not enough trials to compute statistics on these indices for each individual unit and each stimulus type, we pooled the data across all relevant units.
Visual stimuli
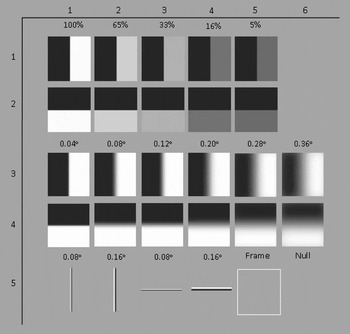
Visual stimuli consisted of sharp edges varied by contrast, high-contrast edges varied by degree of blur, and linear dipoles, which approximate the difference between a high-contrast sharp edge and a high-contrast blurred edge (Fig. 2). There were a total of 28 stimuli, which consisted of five vertically oriented and five horizontally oriented black and white sharp edges that varied in contrast (5, 16, 33, 65, and 100%) (Fig. 2, rows 1 and 2). Stimulus contrast was calculated using the Michelson contrast equation: (L max − L min)/(L max + L min), where L max is the maximum luminance and L min is the minimum luminance.
Visual stimuli used in this study. The stimuli were positioned so that the horizontal and vertical edges bisected the center of the receptive fields of the neurons and were sized so that the edges of the square were outside the receptive field boundaries (2–4 deg of visual angle, not overlapping the fixation point). Stimuli were flashed on one at a time in shuffled random order. Rows 1 and 2 show sharp edges varying in contrast (100, 65, 33, 16, and 5%). Rows 3 and 4 show 100% contrast edges with variable blur profiles (0.04–0.36 deg visual angle). Row 5 shows white and black “linear dipoles” of 0.08 and 0.16 deg visual angle, as well as a white frame control and a null control.

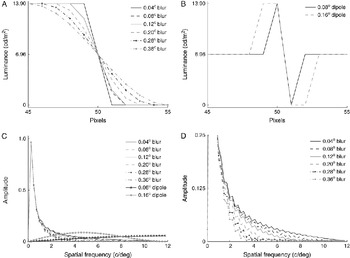
Simulated blur stimuli consisted of six horizontally oriented and six vertically oriented white and black edges where the blur profile varied from 0.04 to 0.36 deg visual angle (Fig. 2, rows 3 and 4). The luminance of the blur profiles ranged from 0 to 13.90 cd/m2. The luminance profiles of the blurred edges were similar to those employed by Siguenza et al. (Reference Siguenza, Heide and Creutzfeldt1987), approximating cosine functions varying by slope (Fig. 3A). Wider blur profiles exhibited banding effects on our monitor and were not used.
The luminance profiles of blur (A) and linear dipole stimuli (B) as a function of pixel position. The blur profile was always centered relative to the high-contrast edge and approximated a cosine function. (C) The spatial frequency spectrum of blur and linear dipole stimuli was calculated using a Hamming window function. Sharp and blurred edges have the same low-frequency components but differ only in the higher spatial frequencies. The linear dipole stimuli contain mostly high spatial frequencies, overlapping the range of separation between sharp and blurred edges. (D) The spatial frequency spectra of the blurred edges seen in (C) are expanded in order to see the different spectral components for each blurred edge.

To determine if the neurons could respond to high–spatial frequency stimuli, 0.08 and 0.16 deg visual angle vertically and horizontally oriented linear dipole stimuli were presented (Fig. 2, row 5, columns 1–4). The linear dipoles consisted of luminance-matched horizontal and vertical black and white parallel lines, and therefore, the linear dipoles contained minimum low spatial frequencies and no “DC” components.
The spatial frequency spectrum of blur and linear dipole stimuli was calculated by multiplying the luminance profile with a Hamming window function and then taking the absolute value of the Fourier transform (see Fig. 3C and 3D). (This ignores the spatial structure of the individual pixels.) The reason for using the linear dipoles is that they have minimal power at the low frequencies that are the same for the sharp and blurred edges, and most of their power lies at higher frequencies overlapping the range that differentiates the sharp and the blurred stimuli. If neuronal responses were unaffected by blur because they were selectively tuned to only the lowest spatial frequency or because overall acuity was low, it is unlikely that they would be able to respond robustly to the linear dipole stimuli.
Two types of control stimuli were employed. The first control stimulus was simply a blank the same luminance as the background that was used to ensure that there were no significant order-of-presentation effects. The second control stimulus was a white “frame” that was the same size as the experimental stimuli and was used to verify that the neurons were responding to the edge in the middle of the stimuli and not to the edges of the square region in which the stimulus was defined (Fig. 2, row 5, column 5).
Stimulus placement
Receptive fields were mapped manually by presenting white or black bars at different orientations (0–180 deg) on a 6.96 cd/m2 gray background. Receptive fields were all parafoveal (range = 1–6 deg; mean = 3.1 deg) from the fixation target. We used vertical and horizontal edge stimuli to avoid aliasing artifacts with the raster of the video display. During receptive field mapping, we found cells that were narrowly tuned to stimuli oriented diagonally; these neurons were not included in this study because our stimuli did not elicit significant responses from them. Stimuli were positioned so that the center of the receptive field was bisected by the center edge of the stimulus, both horizontally and vertically (i.e., the receptive field was centered in the square region that defined our stimuli). All neurons in this study responded robustly to at least one of either the horizontal or the vertical edges; however, some neurons had only weak responses to one of these orientations. In this case, the stimulus-driven background “hash” heard from an audio monitor was used to position the stimulus of that orientation.
Stimulus presentation
Stimuli were presented by flashing them on the receptive fields of the neurons in shuffled random order for a minimum of 10 trials per unique stimulus condition. Flashing stimuli on is essentially how primate vision normally operates, where 200- to 300-ms intervals of stable vision are punctuated by rapid saccadic eye movements. Previous work has determined that flashing a stimulus on with the eyes fixed elicits comparable neuronal responses as moving the receptive field of a neuron onto a fixed stimulus via a saccadic eye movement (Gawne & Martin, Reference Gawne and Martin2002). The stimuli were on for 224 ms, embedded within a 440-ms data collection window. Data collection windows were separated by 500-ms intervals, unless a juice reward was given in which case there was an additional interval of 1 s between stimuli to avoid contaminating the recorded signals with lick artifacts. Rewards were given either every three or four stimulus presentations.
Depth corresponding to simulated blur
We estimated how the blur stimuli used in the experiment compare to the degree of blur of a sharp edge produced at a particular distance relative to fixation. To do so, we calculated the blur circle for a point source at different distances relative to fixation:
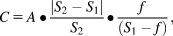
where C is the diameter of the blur circle imaged on the retina, A is the diameter of the pupil, f is the focal length of the lens, S 1 is the distance that the subject is fixated, and S 2 is the distance that the nonfixated object is presented (Cook et al., Reference Cook, Porter and Carpenter1984).
Under photopic conditions, the pupil diameter of the macaque eye is typically 4 mm (Gamlin et al., Reference Gamlin, McDougal, Pokorny, Smith, Yau and Dacey2007), and the focal length is 18 mm (Lapuerta & Schein, 1995). Using the blur circle C, we calculated the luminance profile of a blurred sharp edge by convolving a circle with a two-dimensional step edge (e.g., see Fig. 4). To match our widest blur profile of 0.36 deg for a macaque fixated at 57 cm, this would correspond to an object located approximately either 40 or 100 cm distant. Hence, the range of blur width used in this study is within the range of distances that a macaque monkey normally interacts with objects in the environment.
Depth corresponding to simulated blur. A high-contrast edge was convolved with a disk filter to produce a high-contrast blurred edge. The size of the disk was calculated based on the known optics of the macaque eye. This allowed us to estimate the range of distances that would correspond to the range of blurs used in this study (see text).

Results
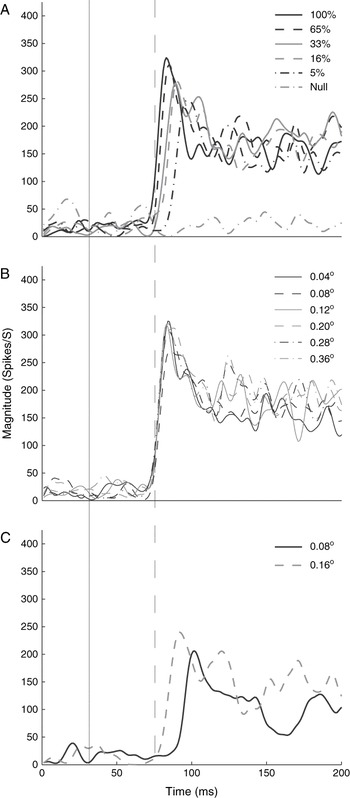
Fig. 5 shows an example of the single-unit responses to the stimuli used in the present experiment. Fig. 5A shows the responses to a series of sharp edges of variable contrast. As expected, the responses showed an increase in response latency as contrast decreased. Fig. 5B shows the responses of this neuron to high-contrast stimuli of variable degrees of blur. We found that neither response latency nor response magnitude was altered by blurring an edge. This suggests that this neuron does not respond to the high spatial frequencies that differentiate sharp from blurred edges, that is, that it is simply a spatial low-pass filter. However, Fig. 5C shows the responses of this neuron to the linear dipole stimuli. This neuron can respond robustly to higher spatial frequencies but with a delay. The linear dipole stimuli approximate the difference between the most blurred and the sharp-edge stimuli; however, the response elicited by the linear dipole stimuli is much greater than the difference between the responses to the blurred and sharp-edged stimuli.
Responses of a single V1 neuron to (A) contrast, (B) blur, and (C) linear dipole stimuli for the optimal orientation. Plotted are the average spike density functions, effectively a smoothed poststimulus histogram (see text). The solid line demarcates the stimulus onset, and the dashed line is used to allow visual comparison of relative onset time across the panels. For this example neuron, the responses to stimuli varying in contrast show little change in response strength but a consistent increase in latency with decreasing contrast. Blurring a high-contrast stimulus had virtually no effect on either response strength or latency. However, this neuron did respond robustly to the linear dipole stimuli, although with an increased latency, suggesting that the lack of sensitivity to changes in blur is not due to an inability to respond to high spatial frequencies.

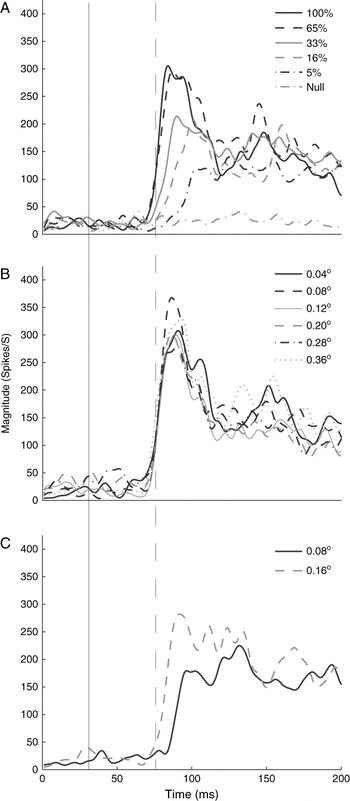
Fig. 6 shows an example of multiunit response. This was typical: the responses obtained from multiunits exhibited the same trends as those obtained from single-cell responses for all stimulus conditions.
Responses of an example V1 multiunit to (A) contrast, (B) blur, and (C) linear dipole stimuli, presented as in Fig. 5. As with the results in Fig. 5, the multiunit data show a consistent increase in response latency with decreasing contrast, little if any change in the response with changes in blur, and responses to linear dipole stimuli that are robust but that show a prolonged latency.

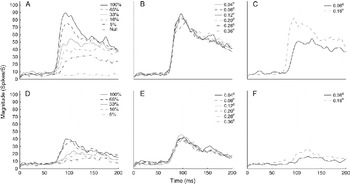
Because there were no significant differences between single- and multiunit responses for each stimulus, we pooled single-cell and multiunit responses together. Fig. 7 shows the average for all units in this study as a function of time, for both optimal (whichever of the horizontal or vertical orientations that gave the strongest response to a sharp high-contrast edge) and nonoptimal (the orientation rotated 90 deg) contrast (Fig. 7A and 7D), blur (Fig. 7B and 7E), and linear dipole (Fig. 7C and 7F) stimuli. Of course, this combines units whose true optimal orientation is close to vertical or horizontal with those whose true optimal orientation is more intermediate between horizontal and vertical. However, it was not uniformly possible to reliably determine the response latency to the nonoptimal stimuli because these responses were often weak. By demonstrating at the population level that the same lack of effect of blurring a stimulus seen for optimally oriented stimuli is also seen for nonoptimally oriented stimuli, this rules out response saturation as a dominant mechanism explaining our results, although it could play a role for individual neurons.
Average responses from all units (single and multi), arranged as in Figs. 4 and 5 of the optimal stimulus orientation for the (A) contrast, (B) blur, and (C) linear dipole stimuli and the nonoptimal stimulus orientation for the (D) contrast, (E) blur, and (F) linear dipole stimuli. Here, “optimal” is defined as either the horizontal or the vertical orientation that elicited the strongest response to the sharp high-contrast stimuli and “nonoptimal” as the other orientation. By averaging across units from different animals, different recording sessions, and different eccentricities, the sharpness of the response onsets is blurred compared to that from any single example, but the same basic response pattern still holds. In particular, because the effects of blurring the stimulus are the same for the optimal and nonoptimal conditions, the lack of effect of blur seen at the optimal orientations cannot be primarily due to response saturation.

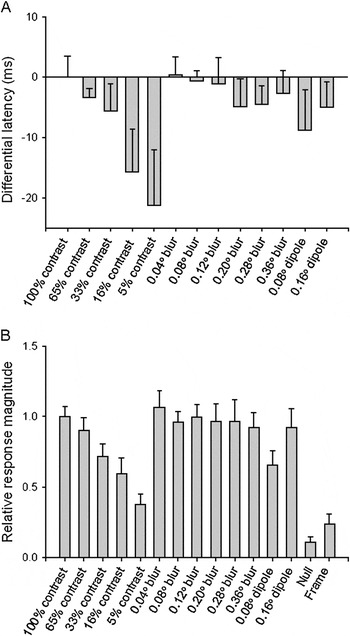
Fig. 8 shows the mean differential latency (Fig. 8A) and mean relative magnitude (Fig. 8B) with 95% bootstrap confidence intervals for the optimal orientation of each neuron to each blur and contrast stimulus. Differential response latency was defined as mean response latency to the 100% contrast sharp stimulus minus the mean response latency of each contrast and blur stimulus. Relative response magnitude was defined as the mean response magnitude for each contrast, blur, and linear dipole stimulus divided by the mean response magnitude for the sharp-edged 100% contrast stimulus. As expected, reducing the contrast of a sharp edge causes progressive increases in response latency (A, leftmost five bars) and decrease in response magnitude (B, leftmost five bars). The responses to the low-contrast stimuli provide a range for the changes in response magnitude and latency that we might expect in response to a variation of a stimulus parameter. Especially when compared to the effects of stimulus contrast, response latency is relatively stable with changes in the degree of blur. We compared the response latencies and magnitudes of single-neuron and multiunit responses to stimuli varied by contrast and degree of blur using one-way analyses of variance. For single-cell and multiunit responses, there was a significant effect of contrast on response latencies, F(4, 233) = 15.07, P = 5.64 × 10⁻¹¹, and response magnitudes, F(4, 248) = 5.47, P = 0.00031; however, blur had no effect on response latencies, F(5, 288) = 0.71, P = 0.61, or response magnitudes, F(5, 289) = 0.04, P = 1.0.
Comparison between the differential latency (A) and the relative magnitude (B) for the optimal orientation of contrast and blur stimuli. Differential response latency was defined as mean response latency to the 100% contrast stimulus minus mean response latency of each contrast and blur stimulus. The optimal orientation for each neuron was based on the response magnitude to the 100% contrast stimulus. Latency data are not shown for the null and frame stimuli because these responses were typically so weak that no reliable latency estimate could be derived. Error bars show 95% bootstrapped confidence intervals.

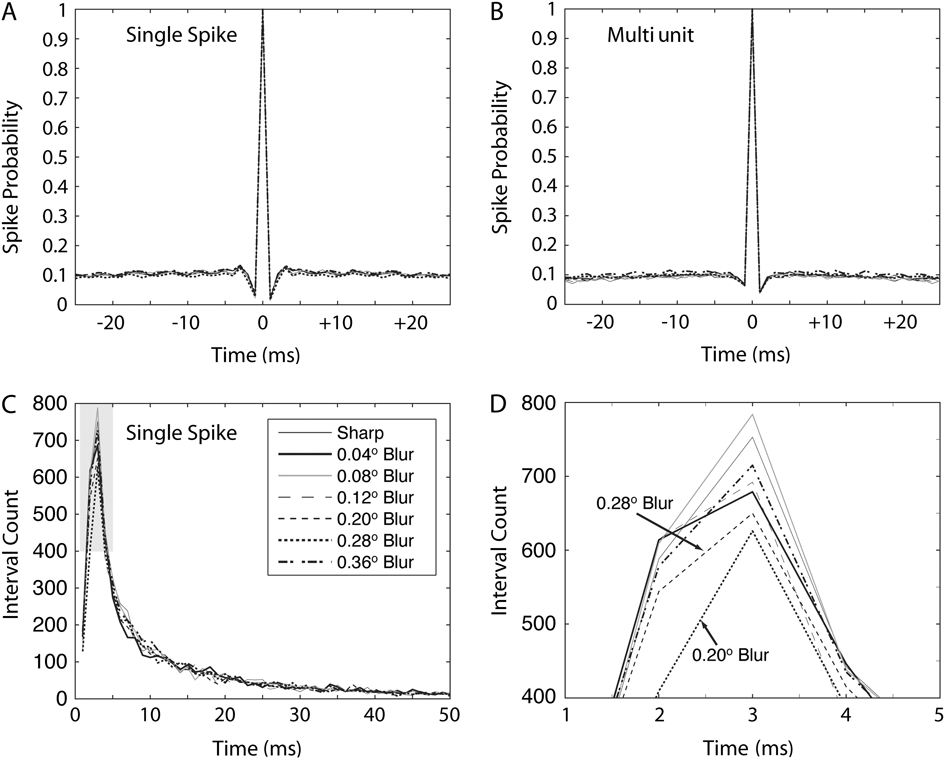
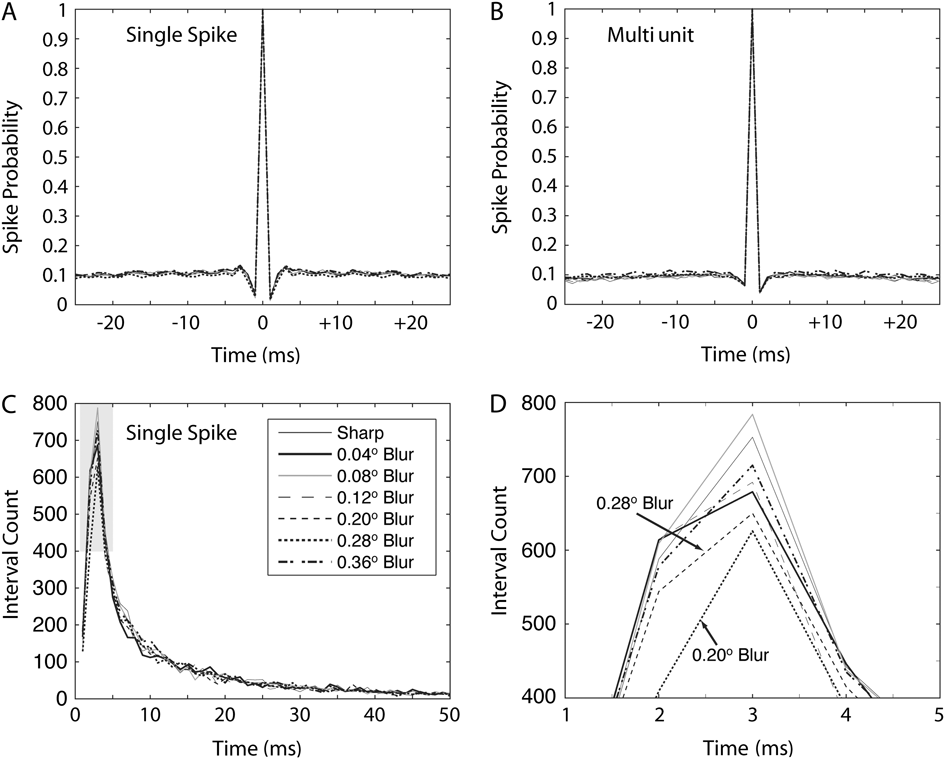
Fig. 9 panels A and B illustrates the autocorrelograms for the single-unit and multiunit data as a function of level of blur. The data are pooled across all units because there are not enough data from a single-unit and a single-stimulus condition to get accurate estimates for all these intervals. The data indicate, across all the units, a lack of any blur-specific oscillation. Panel C indicates a histogram of all the interspike intervals, pooled from the isolated single units only because it is not clear how one would interpret such data from multiunits. Although the overall form of the curves is quite similar as a function of blur, there does seem to be a selective reduction in short (2 and 3 ms) interspike intervals, which is expanded in panel D. This result likely explains the nonsignificant trend for the spike counts at these blur levels to be less (see again Fig. 8). However, no attempt to find differential effects of blur on bursts of action potentials versus all the spikes yielded any significant results for any neuron. Thus, although tantalizing, this apparent difference in the incidence of short interspike intervals with blur is at best a weak trend across the entire population.
(A) Autocorrelogram for the pooled data from all the isolated single neurons in the study. Different lines indicate different levels of blur (see legend in Panel C). The autocorrelograms are virtually identical. (B) Same layout as panel (A) but for the multiunits. (C) Histogram of interspike intervals from the isolated single units only. There is a tendency for there to be a smaller number of short interspike intervals for the 0.20 and 0.28 deg visual angle blur data, but this was only apparent in the pooled data as the data from individual neurons were too variable to make statistical comparisons. (D) Shaded region of panel (C) expanded.
Discussion
Relationship to previous studies examining effects of blur on physiological response
Siguenza et al. (Reference Siguenza, Heide and Creutzfeldt1987) examined the response magnitude and integrated response (total number of spikes in the transient response) of single simple cells and complex cells in striate cortex of anesthetized cat to drifting (5 and 20 deg/s) edge stimuli blurred via a cylindrical lens; edges were blurred 0.14–1.2 c/deg. Most of these cells produced larger responses to a small degree of blur (1.2) than sharp edges, and it was only when edges were highly blurred (0.14–0.62 c/deg) that the response magnitude decreased. Thus, stimulus sharpness does not seem to be encoded within the response magnitude or integrated response.
Sokol and Moskowitz (Reference Sokol and Moskowitz1981) and Bobak et al. (Reference Bobak, Bodis-Wollner and Guillory1987) investigated the latency and magnitude of the visual evoked potential (VEP) to changes in contrast and blur. They found that decreasing contrast produces an increase in response latency, which is expected and consistent with our results. For increased blur, VEP latency did not change until the blur was so extreme that it is likely reducing the magnitude of the lowest spatial frequency components of the stimuli they used, in effect reducing stimulus contrast. These results are consistent with ours, suggesting that the response dynamics of the visual system are different for changes in contrast and blur.
Blur sensitivity
Obviously, the visual system is sensitive to blur because we can tell if a visual scene is blurred or not, so there must be neurons whose responses are affected by the amount of blur. It seems likely that blur is largely encoded by foveally driven cortical neurons because, in primates, accommodation is mostly driven by foveal receptors and accommodation is mostly used to minimize blur at the fovea (Leigh & Zee, Reference Leigh and Zee2006). Parafoveal acuity in the macaque monkey is similar to human and does not degrade very quickly with eccentricity (Kiorpes & Kiper, Reference Kiorpes and Kiper1992, Reference Kiorpes and Kiper1996). Acuity in the adult macaque is 20 c/deg, 4 deg from the fovea: this is well within the range of eccentricities and blur that we studied here. However, primates generally only need to discriminate blur at the fovea. It may be the case that even though parafoveal neurons can respond to spatial frequencies that differentiate between sharp and blurred stimuli, many or most of these neurons do not make use of this information.
Possible mechanisms
What could account for the lack of response of these neurons to changes in blur, even though these neurons can respond to the high spatial frequencies that separate a sharp from a blurred stimulus? There are two main possibilities. First, we note that many researchers using a variety of different techniques have found that low spatial frequencies tend to either elicit shorter response latencies or be processed before higher spatial frequencies (Marr & Poggio, Reference Marr and Poggio1979; Nishihara, Reference Nishihara1984; Anderson & Van Essen, Reference Anderson and Van Essen1987; Parker et al., Reference Parker, Lishman and Hughes1997; Bredfeldt & Ringach, Reference Bredfeldt and Ringach2002; Menz & Freeman, Reference Menz and Freeman2003; Frazor et al., Reference Frazor, Albrecht, Geisler and Crane2004). If the response to the low-frequency fundamental component of an edge had a relatively short latency, it could suppress the longer latency responses to the higher spatial frequency components that differentiate a sharp from a blurred edge. However, in the absence of low spatial frequencies, the neurons can still respond to the higher spatial frequencies only later in time.
On the other hand, our results could be explained by contrast gain control mechanisms (Ohzawa et al., Reference Ohzawa, Sclar and Freeman1985; Bonds, Reference Bonds1991; Albrecht, Reference Albrecht1995; Carandini et al., Reference Carandini, Heeger and Movshon1997). Referring back to Fig. 3C, we see that the high–spatial frequency components that differentiate sharp from blurred edges are much smaller in amplitude than the fundamental frequency. This is because the fundamental occupies a broad spatial extent, whereas the high spatial frequencies that are the difference between the sharp and the blurred edge cover a spatially restricted area. Thus, as long as the low-frequency fundamental is present, the spatially restricted high spatial frequencies present in a sharp edge are automatically suppressed, but in the absence of the fundamental, the effective gain of the neuron is increased and high spatial frequencies alone can elicit robust responses.
Summary
We found that blurring a high-contrast edge from 0.04 to 0.36 deg does not have the same effect as decreasing the contrast of a sharp edge. As expected, response latency increases as contrast is decreased and response latency decreases as contrast is increased. However, our population of V1 cells show little change in response latency as the degree of blur of a stimulus is changed. Although the technique of recording from single units may well result in a biased population of neurons, at the very least, it is clear that there is a significant population of parafoveal neurons that are almost completely insensitive to the degree of image blur over a considerable range even though they are quite capable of responding robustly to the range of spatial frequencies that differentiate sharp from blurred stimuli. We suggest that insensitivity to the degree of blur would be a useful property for neurons used for navigating in space, tracking objects, or hand–eye coordination, where it could be important that an object moving in or out of the plane of fixation not bias the response or alter the timing in any way.
Acknowledgments
Supported by National Science Foundation grant IOB 06222318 (T.J.G.). We would like to thank Drs. Frank Amthor, Allan Dobbins, and Thomas Norton for their helpful suggestions. We thank Julie Rogers for the photograph in Fig. 1 and James Black for technical assistance.