


Introduction
In the UK policy agenda much importance is attached to pre-school programmes for children from disadvantaged backgrounds. But there is far less consensus on the effectiveness of later-life interventions, in particular through various programmes of post-school education and training. Especially important here are questions of how far educational attainment through such programmes compensates for or builds on earlier levels of attainment, and how far it serves to narrow or to maintain or even to widen educational inequalities associated with social origin. In this paper, I aim to shed some light on these issues by studying the role of further education – or ‘life-long learning’ – in intergenerational social mobility. More specifically, I address two interrelated research questions. First, I investigate to what extent individuals acquire qualifications in their later lives and how this form of educational attainment is related to their social origins. Second, I examine to what extent the returns to further qualifications, in terms of class position, differ for individuals coming from different class backgrounds. I focus on social class returns to further education because class captures more fully than simply earnings the intergenerational transmission of economic advantage and disadvantage (Bukodi et al., Reference Bukodi, Goldthorpe, Waller and Kuha2015). I understand class positions as being determined by the social relations in which individuals are involved in their economic lives – that is, in labour markets and production units. This understanding of class is the main social classification in use in British official statistics since 2001: the National Statistics Socio-Economic Classification (NS-SEC). And it is on this classification that the findings of this paper are based (for underlying theory, see Goldthorpe, Reference Goldthorpe2007, vol. 2: chapter 5).
International comparative research shows that Britain is at the top of the league of participation rates in further education. In 2007 around 15 per cent of 25-to-64-year-olds took part in formal education or training of some kind – while participation rates were, for instance, 12–13 per cent in Sweden and Denmark, and only 5 per cent in Germany and 2 per cent in France (Dämmrich et al., Reference Dämmrich, Vono de Vilhena, Reichart and Blossfeld2014).
Past research also shows that the propensity for pursuing further education varies for individuals with different socio-demographic characteristics. Younger people are much more likely than older people to participate in further training, especially in Britain (e.g. Dämmrich et al., Reference Dämmrich, Vono de Vilhena, Reichart and Blossfeld2014). Further, there is ample evidence of the positive effect of initial education on the chance of obtaining new qualifications as adults, both in Britain and elsewhere (e.g. Jenkins et al., Reference Jenkins, Vignoles, Wolf and Galindo-Rueda2003; Blanden et al., Reference Blanden, Buscha, Sturgis and Urwin2010). Employment characteristics also affect participation rates – although the results in this regard are somewhat conflicting, at least for Britain. Wolf et al., (Reference Wolf, Jenkins and Vignoles2006), Duckworth and Cara (Reference Duckworth and Cara2012) and McMullin and Kilpi-Jakonen (Reference McMullin, Kilpi-Jakonen and Blossfeld2014) report particularly high participation rates among the unemployed, but Blanden et al. (Reference Blanden, Buscha, Sturgis and Urwin2012) find that life-long learning is largely undertaken by the working population. Once employed, individuals on permanent contracts appear to be more likely than their counterparts on limited contracts to accumulate further qualifications (Dämmrich et al., Reference Dämmrich, Vono de Vilhena, Reichart and Blossfeld2014).
However, we know surprisingly little about the role of social origins in obtaining further qualifications. Raffe (Reference Raffe1979) found that in the early 1970s further training was an ‘alternative route’ to attaining a higher level of qualification for the children of the middle class rather than for those of the working class. Using data from the 1980s and early 1990s, Egerton (Reference Egerton2001) still reported some advantage of the children of the middle class in terms of mature graduation from universities. But, and perhaps more importantly, she also found that individuals coming from disadvantaged backgrounds to some extent increased their participation rates in higher education as mature students. Egerton's findings would then suggest that children of working class origin in recent cohorts might be more able than their counterparts in earlier cohorts to use further education as an alternative route to attaining higher levels of qualification. Results from a recent study, however, throw some doubt on this possibility in that the children of the low educated still seem to be significantly less likely than the children of the tertiary-educated to participate in further education (Gloster et al., Reference Gloster, Buzzeo, Marvell, Tassinari, Williams, Williams, Swift and Newton2015).
As regards the returns to further education, past research mainly focuses on estimating earnings returns, with somewhat conflicting results for Britain. A large body of research reports no or rather weak returns (Jenkins et al., Reference Jenkins, Vignoles, Wolf and Galindo-Rueda2003; Wolf et al., Reference Wolf, Jenkins and Vignoles2006; De-Coulon and Vignoles, Reference De-Coulon and Vignoles2008; Blanden et al., Reference Blanden, Buscha, Sturgis and Urwin2012), although there is also research pointing to some economic benefits from life-long learning (Feinstein et al., Reference Feinstein, Galindo-Rueda and Vignoles2004; Dorsett et al., Reference Dorsett, Lui and Weale2011). However, none of these studies attempt to link social origins to the earnings returns to further education, and only very few consider occupational or class returns (for an exception, see Blossfeld et al., Reference Blossfeld, Kilpi-Jakonen, Vono de Vilhena and Buchholz2014). The only recent British study that investigates the question of the role of further education in social mobility finds that children of highly educated parents are somewhat more likely than children of lower educated parents to benefit from further training in terms of attaining managerial and professional occupations (Gloster et al., Reference Gloster, Buzzeo, Marvell, Tassinari, Williams, Williams, Swift and Newton2015). However, even this study has limitations: it only considers qualifications returns in terms of accessing the managerial and professional class and, perhaps more importantly, it does not discuss explicitly the link between the effects of social origins on obtaining further qualifications and then the returns to further qualifications for people of different social origins.
Against this background, I aim in this paper to contribute to the literature on the link between further education and social mobility in a number of ways. First and foremost, I give a comprehensive account of the associations existing between social origins, the probability of pursuing further education and training, and changes in class position over the course of working life – an account that has scarcely been given before. Second, I enhance the analyses of past research to cover a later birth cohort: i.e. a cohort of individuals who developed their educational and work careers between the late eighties and the late 2000s. Third, in contrast with most previous studies, I focus not on particular forms of further education – such as late entry into tertiary education or part-time vocational training – but consider the full range of academic and vocational courses that are available for individuals to advance their qualifications. Fourth, I also examine whether or not the effects of social origins on participating in further education and on the returns to further education change over the course of individuals’ working lives. Note, however, that I do not claim to demonstrate the actual causal mechanisms that link social origins, further education and returns to further education. My aim is essentially descriptive. I seek only to establish empirical regularities at the level of associations. Specifying and testing the causal processes at the level of individual action and interaction that generate these regularities would require data and analyses of different kinds from those I use in the present paper (for more details on this approach to causality see Cox, Reference Cox1992; Goldthorpe, Reference Goldthorpe2016: chapters 8,9).
Finally, I should note that I treat further education in terms of the formal, certified qualifications – both academic and vocational – that individuals obtain in the course of their working lives. I use this definition because formal qualifications are thought to be more consequential than non-formal training for both intra- and intergenerational social mobility (Kilpi-Jakonen et al., Reference Kilpi-Jakonen, Vono de Vilhena and Blossfeld2015).
Further education and intergenerational social mobility: two possible scenarios
There is no doubt that education is a key determinant of individuals’ opportunities in later life, and is a key channel for attaining high-level occupational and class positions. Politicians and policy-makers also tend to believe that further education can have compensatory effects. In other words, further education can provide opportunities for disadvantaged individuals, in terms of social origin, initial education or employment, to upgrade their qualifications and can, in turn, contribute to increasing social mobility across the life-course and across generations. But in contrast with this ‘second-chance’ view, the alternative possibility is that further education in fact helps preserve the prevailing structure of inequalities via the logic of cumulative (dis)advantages. The idea behind the cumulative (dis)advantages – or ‘Matthew-effect’ – thesis is simple: small initial differences among individuals are magnified over time, and this makes it difficult for an individual who is behind at an early stage in educational attainment, occupational status or income to catch up. In other words, a favourable relative position becomes a resource that produces further relative gains; or to put it yet another way: ‘advantages beget advantages’ (Merton, Reference Merton1968; DiPrete and Eirich, Reference DiPrete and Eirich2006; Rigney, Reference Rigney2010).
As far as education and social mobility are concerned, ‘Matthew effects’ can manifest themselves in different ways. As an obvious example, an individual with origins in the managerial and professional salariat may leave full-time education with a high level of qualification that allows a smooth labour market entry into an advantaged occupational position that itself provides good opportunities for subsequent career advancement, leading thus to intergenerational stability of class position. Or, conversely, an individual of working-class origin who leaves school with no, or very low-level, qualifications and enters the labour market in some form of ‘dead-end’ job may then find it difficult to enter into further education and training, at least of a kind that could result in upward social mobility out of the working class. However, another possibility has to be recognised that is of particular relevance in the present context. This would arise with an individual from an advantaged social background who does not do especially well in full-time education and thus enters the labour market at a relatively low level. In this case, one could suppose that a strong motivation will exist to pursue further education and training (Goldthorpe, Reference Goldthorpe2007) – with family resources and other forms of support then being drawn on to increase the chances of success. In this case, the ‘Matthew effect’ would be expressed in the form of what has been called ‘counter-mobility’ (Girod et al., Reference Girod, Fricker and Körffy1972) whereby advantages deriving from social origins operate over the life-course so as to enable initial downward movement to be reversed.
In the remainder of the paper I investigate which scenario – the compensatory or the cumulative (dis)advantages – applies in the British case.
Data and key variables
I use the data-set of the British Cohort Study 1970 (BCS70), which has aimed to follow all children born in Britain in one week in 1970 through their life-courses (Elliott and Shepherd, Reference Elliott and Shepherd2006). Drawing on this study, it has been possible to establish – in person-year form – cohort members’ continuous educational qualifications histories together with their continuous employment and social class histories, extending from their first ‘significant’ job – i.e. one lasting at least six monthsFootnote 1 – up to age 38.
Cohort members’ educational qualifications histories include detailed information on all the academic and vocational qualifications that they had obtained in their working lives, up to age 38. For my purposes, I have created an ordered, nine-category classification of academic qualifications that ranges from ‘no qualification’ to ‘postgraduate qualifications’. I use this classification for recording cohort members’ academic qualifications throughout their life-course. The UK vocational qualifications system is complex and, to simplify the system, qualifications are recorded into the six-level National Vocational Qualifications (NVQ) classification, which allows an approximate conversion between academic and vocational qualifications. I use this classification for recording cohort members’ vocational qualifications throughout their working lives. Table 1 describes the classifications of the academic and vocational qualifications that I work with.
The two qualification classifications
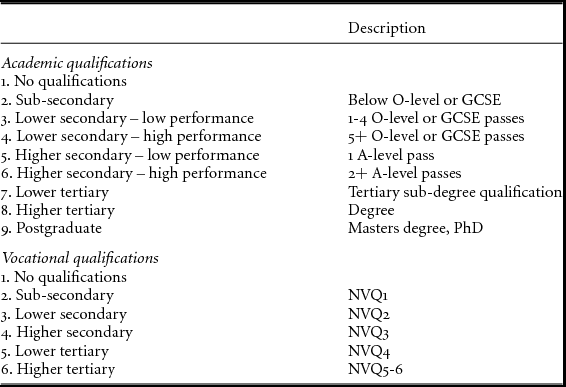
The definition of my main variable of interest, further qualifications, is based on the two above classifications. I define further qualifications as the attainment of any certified qualifications – academic or vocational – following on an individual's completion of his or her first period of continuous full-time education and entry into first significant job. I use this definition to make sure that further qualifications are not ascribed to life-stages when cohort members are still in the transition from school to work (e.g. in a ‘gap year’).
Figure 1 shows the distribution of all qualifications that cohort members attained by age, distinguishing between qualifications obtained through life-long learning (further qualifications) and qualifications obtained through full-time education. As expected, the highest concentration of new qualification attainment occurs between ages 17 and 22, when respondents are still taking part in full-time education. The incidence rates of further qualifications are different for academic and vocational qualifications. In the case of further academic qualifications, the rate is steadily increasing up to age 26–27 when it starts declining. In contrast, the incidence rate of further vocational qualifications is highest at age 36–38 for women, and for men has a bi-modal distribution: i.e. the rate peaks at age 19–21, before declining in the twenties and then picking up again after age 34. This upward surge in participation in further vocational training around age 34 may be due – at least partly – to policy initiatives of the 2000s aiming to increase the number and level of qualifications to be attained by the British population (HM Treasury, 2007).
Table 2 presents some additional summary statistics. Four points of interest emerge. First, overall, more than half of the respondents obtain some further qualifications between first significant job and age 38; most of them do so via vocational rather than academic education. Second, the large majority of new qualifications attained through further education raise cohort members’ highest level of qualification – as measured by the ordered classification introduced in Table 1. Third, further education is an important feature of cohort members’ lives even after age 29 (as also indicated by Figure 1): almost a third of them obtain new qualifications in their thirties. Fourth, there are no significant gender differences in participation rates in further education.
Proportion of individuals obtaining further qualifications
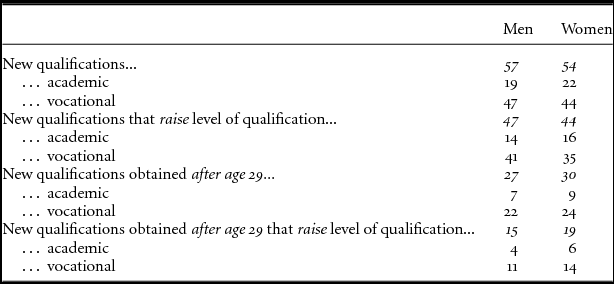
Note: The figures for academic and vocational qualifications do not add up to 100%, because cohort members can obtain both academic and vocational qualifications.
With regard to the level of further qualifications, new academic qualifications are clearly concentrated at the tertiary level: around 70–75 per cent of these qualifications are degrees or sub-degrees. In contrast, new vocational qualifications are distributed more evenly across levels: only around 20 per cent are at the tertiary level (NVQ 4, 5 or 6), 25 per cent are at the upper secondary level (NVQ 3) and slightly more than half are at the lower secondary or sub-secondary level (NVQ 1 or 2 qualifications).
As indicated above, BCS70 allows me to establish a continuous social-class history for every cohort member, on a person-year basis. This is a crucial feature of the data for my purposes, as one of my core interests is to estimate the returns to further qualifications in terms of class position over cohort members’ working lives. To construct the variable of social class, I use the 7-category version of the UK National Statistics Socio-Economic Classification (NS-SEC), as shown in Table 3. As argued in the Introduction, the strength of NS-SEC lies in the degree to which it differentiates individuals in terms of their economic situation, which it does to a greater extent than a focus simply on their incomes would achieve. NS-SEC is in fact strongly associated with income level. But, in addition, it is also associated with three other important aspects of individuals’ economic lives: income security, short-term income stability and longer-term income prospects (McGovern et al., Reference McGovern, Hill, Mills and White2007; Chan and Goldthorpe, Reference Chan and Goldthorpe2007). Moreover, and contrary to popular belief, the increasing inequality in incomes evident in Britain over recent decades has occurred to a greater extent between rather than within social classes (Williams, Reference Williams2013).
Class (origin and destination) description
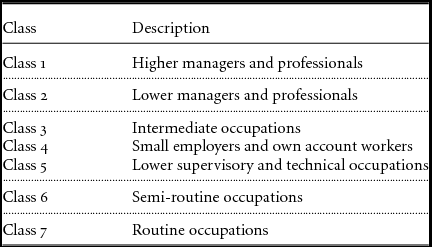
I leave out of the analyses cohort members for whom there is no information at all on their class positions – mainly individuals who have never been in employment. In the case of person-years when respondents are not in employment, I allocate them to their most recent class, unless there is no information on their class position for a spell of over ten years, in which case I drop them from the analyses. I operationalise respondents’ upward and downward movements in class position over the course of their working lives according to the five hierarchical levels of NS-SEC (as indicated by the dotted lines in Table 3).
I also use NS-SEC to measure social origin. I index cohort members’ class of origin by their father's social-class position taken at age 10. Where this information is missing but is available at age 16, I use this alternative information.
Results
Social origin and further qualifications
To address my first research question on the link between social origin and further qualifications, I construct two dependent variables: the conditional probability of obtaining (1) an academic and (2) a vocational qualification at any point of cohort members’ working lives. I then apply binomial logistic regression models, in which time-dependency is taken into account via age-year dummies. To allow for the possibility of cohort members obtaining two or more qualifications during the observation period – i.e. between first significant job and age 38 – the models include random effects. More precisely, the model I work with can be written as:
 $$\begin{equation}
logit\ \left[ {F{Q_i}\left( t \right)} \right] = \ \alpha \left( t \right) + \ {\beta _1}{{{\bf X}}_i} + \ {\beta _2}\ {{{\bf Z}}_i}\left( {t - 1} \right) + \ {u_i}
\end{equation}$$
 $$\begin{equation*}
u_i \sim( 0,\sigma _u^2 )
\end{equation*}$$
In this equation FQi (t) is the probability that cohort member i obtains a qualification at time t, α(t) are coefficients for time (in this case age-year dummies); β1 are coefficients for time constant covariates X (i.e. these variables do not vary over the life-course); β2 are coefficients for time-varying covariates Z (i.e. these variables can vary over the life-course); and ui is a person-specific random error term. The random error term is assumed to follow a normal distribution with zero mean and variance of σ2 u . The term ui represents all of the unobserved characteristics of individual i that are common to each newly obtained qualification.
The focal explanatory variables of the analyses are class of origin and a dummy indicating whether or not in year t-1 cohort members’ class position is lower than that of their parents. The motivation for including this latter variable in the analysis is to test whether or not the fact that an individual is downwardly mobile intergenerationally generates a motivation to gain further qualifications that could then serve as a means for moving up to his or her parents’ class position: i.e. these new qualifications could serve as a channel for intergenerational class maintenance.
The analyses also include as controls a range of individual characteristics that may be thought to affect the probability of obtaining new qualifications via life-long learning. I include two time-variant variables to capture cohort members’ highest level of academic and vocational qualifications up to date – more precisely, in year t-1 – using the classifications introduced above. Regarding cohort members’ labour market attachment, the following two variables are included: a 4-category variable to measure employment status (full-time employee/self-employed, part-time employee/self-employed, unemployed, inactive of other kinds), and a variable to measure respondents’ current or, in case of the non-employed, most recent social class positions. Since it is conceivable that individuals’ incentives to gain further qualifications to some extent depend on their career trajectories, I include a variable to characterise cohort members’ class histories in the past five years, distinguishing between those who have not experienced any movement in terms of class, those who moved up and those who moved down the social class hierarchy as shown in Table 3 (indicated by dotted lines).
Before turning to the effects of the explanatory variables of main interest, I summarise the effects of controls (Appendix, Table A1). As expected, the probability of obtaining further qualifications – either academic or vocational – is higher for individuals who already have some academic qualifications than for individuals with no academic qualification at all. But the association between the level of academic qualification and the probability of obtaining new qualifications is not entirely linear, although the non-linearity shows up differently for new academic and new vocational qualifications. The probability of obtaining a new academic qualification is highest for individuals with a middling level of qualification – i.e. with A-levels and sub-degrees (Columns 1 and 3 in Table A1). In contrast, the probability of obtaining a new vocational qualification is highest among individuals with lower secondary qualifications – i.e. with O-levels (Columns 2 and 4 in Table A1). In general, the incentive for pursuing further education appears to be less dependent on the current level of vocational qualification. The only contrast that is significant in this regard is between individuals with tertiary-level qualifications and individuals with lower level qualifications. Men and women who already have some tertiary-level vocational qualification – i.e. NVQ 4 or 5 or 6 – are more likely than others to obtain new academic qualification, but they are in fact less likely to obtain new vocational qualifications. In sum, these results imply that having some academic qualification in the first place is a pre-requisite for accruing further qualifications, whether academic or vocational, via life-long learning. But having some vocational qualification in the first place seems to matter much less in this respect.
Further, and in line with the results of most previous research, men who are unemployed, or otherwise out of the labour market, are more likely than their employed counterparts to advance their qualification levels via further education. But, interestingly enough, this pattern does not show up for women. Overall, the probability of obtaining new qualifications of any kind is higher for employees than for the self-employed (see Ishida et al., Reference Ishida, Müller and Ridge1995). Furthermore, managers and professionals are clearly those employees who are the most likely to accrue further academic qualifications. Finally, class career trajectories in the past five years do not seem to affect the probabilities of obtaining new qualifications: individuals who moved down the class hierarchy are just as likely as individuals who moved up to attain further qualifications.
Table 4 displays the effects of the two focal explanatory variables, class of origin and class maintenance. I work with three models. Model 1 is limited to the variable of class of origin (along with a series of age-dummies that are included in all three models). The main points of interest are the following. The association between parental background and participating in further education differs by the type of new qualification attained. Individuals of working class – i.e. Class 6 and 7 – origins are significantly less likely than those of intermediate class, and, especially, of salariat – i.e. Class 1 and 2 – origins to obtain further academic qualifications. But parental background does not seem to matter much in the case of new vocational qualifications; if anything, individuals – women in particular – originating in Classes 5 and 6 are more likely than others to take part in vocational training. Model 2 adds the controls. As can be seen, although individuals’ educational and employment characteristics to some extent explain class of origin effects – especially for men – the main pattern remains: the probability of pursuing further academic education is significantly higher for the children of the salariat than for individuals coming from less advantaged origins, and from working class backgrounds in particular. Model 3, which adds a dummy for class maintenance, provides a possible explanation. Apparently, individuals with a current class position that is lower than their class of origin are more likely than others to pursue further academic education, presumably because they see this as a channel for attaining their parents’ class position or even moving beyond it. This then indicates that further qualifications earned in the course of a working life could be of importance in promoting counter-mobility for individuals of advantaged origins whose initial educational attainment was only modest.
Effect of class of origin on the probability of obtaining further qualifications
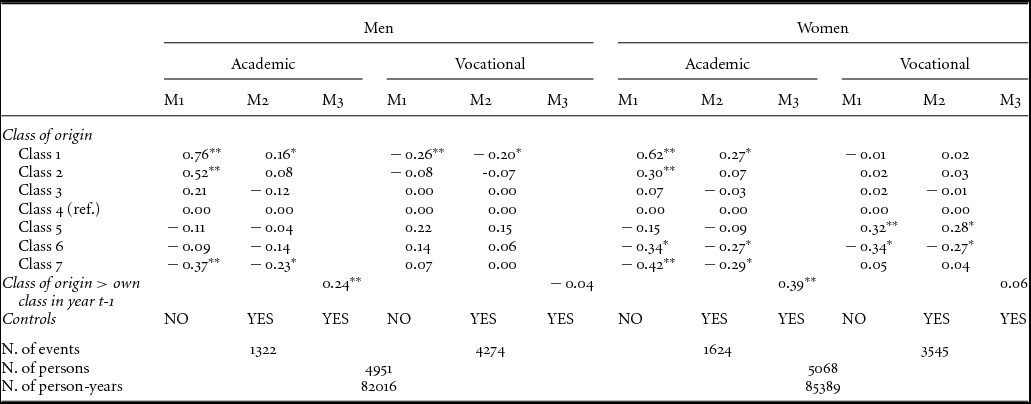
Note: Coefficients from random-effects logistic regression. To avoid over-identification, Model 3 does not include the variable of class of origin.
** p<0.01; * p<0.05
As an auxiliary analysis, I rerun the models with somewhat different dependent variables. My main aim is to see whether the higher probability of obtaining academic qualifications via life-long learning among individuals of salariat origins exists only at particular qualification ‘thresholds’. For this purpose, I focus on four qualification thresholds: first, that which divides attaining 5+ O-levels (i.e. lower secondary – high performance) or higher levels of academic qualifications from lower attainment; second, that which divides obtaining A-levels (i.e. higher secondary) or higher levels of academic qualifications via life-long learning from any lower attainment; third, that which divides obtaining sub-degrees or degrees from lower attainment; and, finally, that which divides obtaining university- or postgraduate degrees from any lower attainment. I run the same set of regressions as in Table 4; the results are presented in Tables A2.1 and A2.2. It is apparent that individuals of salariat origins have a significantly higher probability than their counterparts coming from less advantaged origins to obtain new academic qualifications via life-long learning at each qualification threshold, except the third: i.e. the one that divides sub-degree or degree qualifications from lower level qualifications. It also appears that class maintenance is a major factor for pursuing further academic education, regardless of the level of academic qualification attained.
All the analyses presented above have been conducted across all ages, between labour market entry and age 38. But a further question may arise. Do individuals of working-class origins fare better later in their working lives in terms of their chances of improving their qualification level via further education? Or, put another way: are they able to ‘catch up’ with their more advantaged counterparts later in their life-course? To address this question, I take a hypothetical person and calculate the probabilities of his/her obtaining new academic or vocational qualifications at each age, supposing that he/she came from either a salariat (Class 1 and 2) or a working class (Class 6 and 7) background. I calculate the probabilities under Model 2 of Table 4, but with the inclusion of interactions between the age-year dummies and class of origin. Results are presented in Figure 2 for men and in Figure 3 for women.
Distribution of full-time and further qualifications by age, men
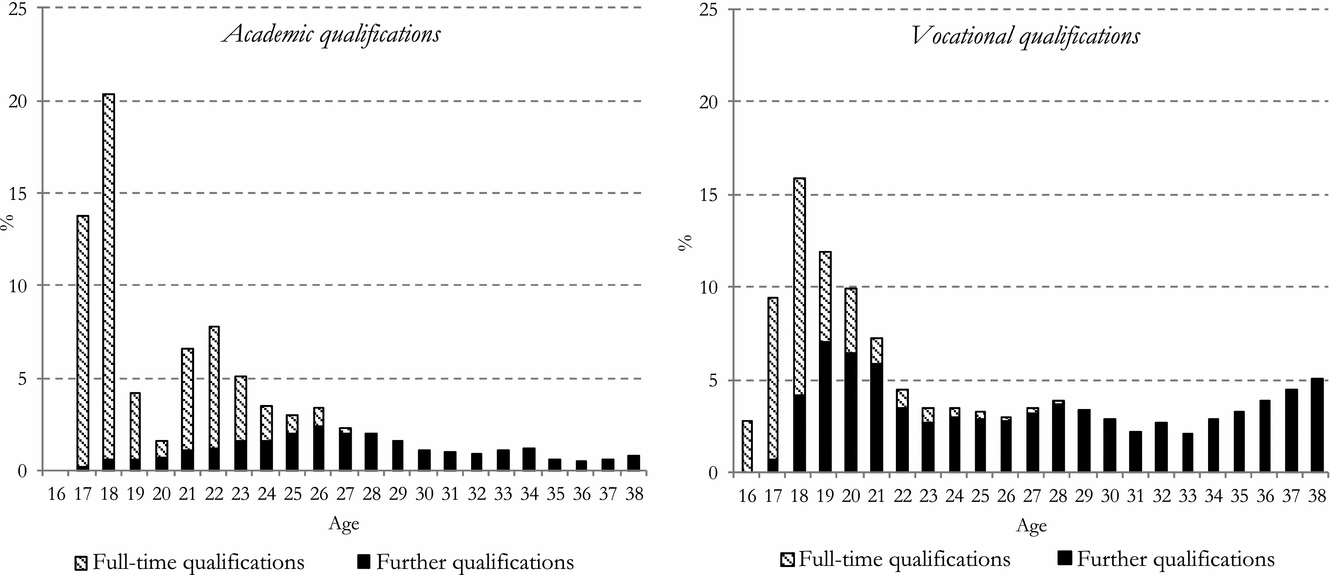
Distribution of full-time and further qualifications by age, women

Predicted probability (with 95% Confidence Interval) of obtaining further qualifications by class of origin and age, men
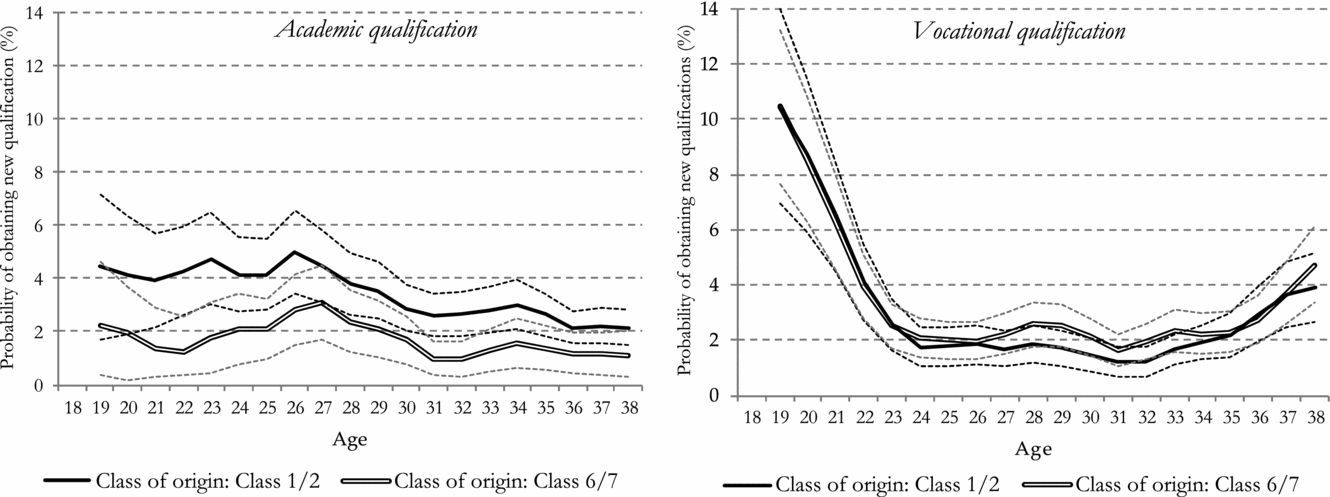
Predicted probability (with 95% Confidence Interval) of obtaining further qualifications by class of origin and age, women

In line with the results in Table 4, the graphs for obtaining further academic and vocational qualifications contrast in that the disparities between the probabilities of individuals with similar educational and employment characteristics but differing class origins are greater with academic than with vocational qualifications. Even more importantly, the disparities in the probabilities remain more or less constant across individuals’ working lives, especially for women. This means that individuals originating in the salariat are significantly more likely than those originating in the working class to attain further academic qualifications at all ages. But this also means that the latter are, at all ages, able to use further vocational training to update their qualification levels to the same – or for women even to a slightly greater – extent as are their counterparts from salariat origins.
To summarise the effects of class of origin on the chances of obtaining further qualifications, the following points should then be noted. The pattern and strength of social origin effects depend on the type of qualifications attained. In the case of academic qualifications, a managerial or professional class background is a clear advantage: individuals with this class background are more likely than those with intermediate, and especially with working-class, backgrounds to gain further academic qualifications, even if they started out with a relatively low level of education and from a disadvantaged class position in their own working lives. It is also suggested that one of the main motivations for individuals of salariat origins to accumulate academic qualifications is that of maintaining their parents’ class position. In the case of vocational qualifications, however, the pattern is different. If anything, individuals of working-class origins are more, not less, likely than individuals from more advantaged backgrounds to obtain new vocational qualifications.
The question that now arises is what the implications of all this might be for the role of further education in intergenerational class mobility. If new academic qualifications attained via life-long learning lead to an increased chance of upward career mobility, and more so for individuals of salariat origins, then further education helps maintain intergenerational class stability. The same applies if these individuals are able to use further academic education to guard against downward worklife mobility. But if new vocational qualifications increase the likelihood of moving up the class career hierarchy, and more so for individuals coming from working class backgrounds, then further education could promote intergenerational upward mobility. These are the issues I will address in the next section.
Further qualifications and worklife class mobility
Since I am interested in examining the chances of moving up and the risks of moving down the class hierarchy over working life, I take the following dependent variables. The first, upward class mobility, is defined as the conditional probability of a job change that entails moving upwards (=1, otherwise 0) within the class hierarchy (see Table 3). The second dependent variable is designed to capture job changes that lead to upward mobility to the salariat (=1 if a cohort member moves to Class 1 or Class 2, otherwise 0); the third dependent variable measures the probability of job changes involving upward mobility to the higher salariat only (=1 if a cohort member moves to Class 1, otherwise 0)Footnote 2 . Analogously, I construct another set of three dependent variables to measure the risks of downward class mobility in general, and from the salariat and the higher salariat, in particular.
I then set up a series of logistic regression models of the same kind as given in equation (1). The BCS70 enables me to avoid the problem of reverse causation by regressing the probability of experiencing an upward/downward career move in year t on obtaining new qualifications in previous years. By including lags in the attainment of new qualifications, I am able to estimate the timing of the effects of obtaining further qualifications on the chances and risks of worklife class mobility. I include five lags of new qualifications in the model: i.e. I measure whether or not a new qualification obtained in year t-1, year t-2, year t-3, year t-4 and year t-5 has any effect on the probability of a respondent moving up or down the class hierarchy. In principle, the maximum number of lags in the data-set is 22, but I only consider 5, mainly to avoid small cell sizes. The models also include a variable of class of origin and the same controls that were used in equation (1). The effects of the controls are presented in Table A3.
As expected, the higher educated are more likely than the lower educated to experience upward mobility and are less likely to experience downward mobility over their working lives. Worklife class mobility of any kind is more frequent among individuals who are currently out of employment or work part-time (except upward mobility for female part-timers). This means that a large bulk of mobility events are attached to re-entry into the labour market and transitions from part-time to full-time working or between part-time jobs. Overall, the more advantaged the class position that individuals hold, the less likely they are to be upwardly mobile – the well-known ceiling effect. But individuals in working-class positions are almost as likely as individuals in managerial and professional jobs to move down the class hierarchy. Class career trajectories in the past five years also affect future career mobility. The probability of an upward move is particularly high if the individual experienced at least one downward move in the recent past. But the probability of a downward move is highest for those with stable class histories in the past five years. Finally, individuals from more advantaged origins are clearly more likely than those from less advantaged backgrounds to move up the class ladder, even when all individual characteristics reviewed above are controlled for. The risk of downward mobility, however, is scarcely affected by class of origin.
Turning now to the effects of further qualifications, as presented in Tables 5 and 6, the following four points of importance should be noted. First, obtaining new qualifications has a greater effect on upward than on downward mobility. Individuals who gained some qualifications in the recent past are more likely than those who did not to move up the class hierarchy. However, further qualifications do not have systematic – negative – effects on the risk of falling down the career ladder. Second, if any effect of further education shows up, it tends to be rather immediate: i.e. it manifests itself within two or three years of obtaining the qualification in question. Third, for upward mobility, new academic qualifications are more consequential than new vocational qualifications, at least for men. Fourth, overall, new qualifications appear to play a greater role in women's than men's worklife mobility. In addition – and, again, in contrast with men – new vocational qualifications obtained in the recent past increase the probability of women moving up but also down within the class hierarchy – a seemingly paradoxical finding that is explored further below.
Effects of further qualifications on upward class career mobility

Note: Coefficients from random-effects logistic regression.
Models simultaneously include new academic and vocational qualifications. Models include all controls.
**p<0.01; *p<0.05
Effects of further qualifications on downward class career mobility
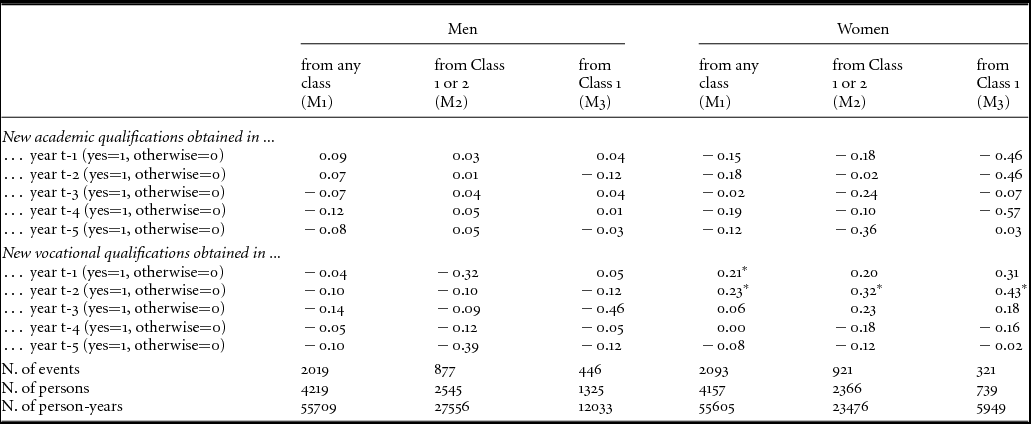
Note: Coefficients from random-effects logistic regression.
Models simultaneously include new academic and vocational qualifications. Models include all controls.
** p<0.01; * p<0.05
It is conceivable that there are additional individual characteristics that affect both the probability of obtaining further qualifications and that of class career mobility. The two most obvious characteristics of this kind are cognitive ability and non-cognitive attributes. As a robustness check, I therefore re-ran the analyses presented in Tables 5 and 6, but with the inclusion of these two additional controls, both measured in childhoodFootnote 3 (see Tables A4.1 and A4.2). It is clear that, although cognitive ability and non-cognitive attributes do affect class career mobility, the effects of further qualifications are essentially the same as in Tables 5 and 6: i.e. the empirical regularities here demonstrated are robust.
I have then established that further education is beneficial in terms of promoting individuals’ upward class mobility over their life-course. But it is conceivable that the ‘mobility returns’ to further education are limited to new qualifications that raise the level of individuals’ educational attainment. In order to investigate this issue, I replace the five lags of further qualifications with four dummy variables: whether or not – with reference to the ordered classification of Table 1 – a respondent obtained a new academic qualification that (1) raised or (2) did not raise the level of his/her academic qualifications; and whether or not a respondent obtained a new vocational qualification that (3) raised or (4) did not raise the level of his/her vocational qualifications. I only consider new qualifications attained in the past three years, as the analyses above indicate that the effect of further education dissipates after three years of obtaining the qualification in question. Table 7 reports the results.
Effects of further qualifications that raise and do not raise highest level of qualification on upward class career mobility

Note: Coefficients from random-effects logistic regression.
Models simultaneously include new academic and vocational qualifications. Models include all controls.
** p<0.01; * p<0.05
Further academic qualifications have mobility returns in terms of helping individuals move up to Class 1 (the higher salariat) regardless of whether or not these raise individuals’ level of qualification. But to increase the chances of promotion to Class 2 (the lower salariat) for men at least, or to intermediate class positions, individuals need to gain new academic qualifications that improve on their previous qualifications. As shown in Table 5, new vocational qualifications help women but not men to move upwards on the class career ladder. The relevant statistics in Table 7 further show that vocational qualifications of any kind – i.e. not only those that raise their level of qualification – can serve as means to promote female respondents’ upward career mobility, although not to the most advantaged class positions.
Table 8 summarises the results of an analogous set of analyses, but now with the risk of downward mobility as the dependent variable. One would expect that further qualifications that advance individuals’ qualification level should be more likely than further qualifications of other kinds to guard against downward mobility. However, this is not the case. New academic qualifications that raise individuals’ level are not more likely than new academic qualifications that do not do so to prevent individuals from moving downwards. Moreover, for women, new vocational qualifications actually lead to increased risks of downward mobility, even when these certificates improve on their level of vocational qualification. At a first sight, this latter result may seem surprising. To examine the issue further, I re-run Model 1 of Table 8, but now with an explanatory variable that differentiates between the levels of new vocational qualifications.
Effects of further qualifications that raise and do not raise highest level of qualification on downward class career mobility

Note: Coefficients from random-effects logistic regression.
Models simultaneously include new academic and vocational qualifications. Models include all controls.
** p<0.01; * p<0.05
As can be seen in Table A5, new tertiary or upper secondary vocational qualifications (i.e. NVQ 3–6) do not lead to a heightened risk of downward mobility for either women or men. However, new vocational qualifications at lower levels (i.e. NVQ 1 or 2) do increase the risk for women – but not for men – moving down the class career ladder. To shed more light on this, I made a closer inspection of the working lives of women who were downwardly mobile after obtaining new lower level vocational qualifications. This investigation reveals that around 90 per cent of these women moved down from either the salariat or intermediate classes. Furthermore, roughly 45 per cent of these downward moves were preceded by employment breaks, and occurred upon re-entering the labour market in part-time jobs. This suggests that new – lower level – vocational qualifications may in fact help women who previously occupied relatively advantaged class positions re-enter the labour market after a period of inactivity, even if in lower level class positions (cf. Dex and Bukodi, Reference Dex and Bukodi2012).
We have seen that qualifications – academic qualifications in particular – attained via life-long learning promote upward career mobility, but do not guard against downward mobility. It is conceivable, though, that the ‘promotion effect’ of further qualifications differs for individuals with different social origins; e.g. that it is stronger for individuals of salariat origins than for those of working-class origins. It is also conceivable that further qualifications prevent downward moves for individuals coming from more advantaged parental backgrounds. To allow for these possibilities, I include interactions between further qualifications and class of origin in the analysis. For the sake of simplicity, I measure further qualifications through two dummy variables: whether or not the respondent obtained (1) any academic, (2) any vocational qualifications in the past three years. I measure class of origin through a 3-category collapse of the 7-category version of NS-SEC into simply the salariat, intermediate classes and the working class. The results are reported in Table A6. As is apparent, we cannot detect a significant and systematic pattern of interactions between class of origin and further qualifications. In other words, the positive effects of new – academic – qualifications on the chances of upward career mobility are neither stronger, nor weaker for individuals with more or less advantaged origins. Likewise, further qualifications do not seem to diminish the risk of falling down the career ladder for anyone, even for individuals of salariat origins.
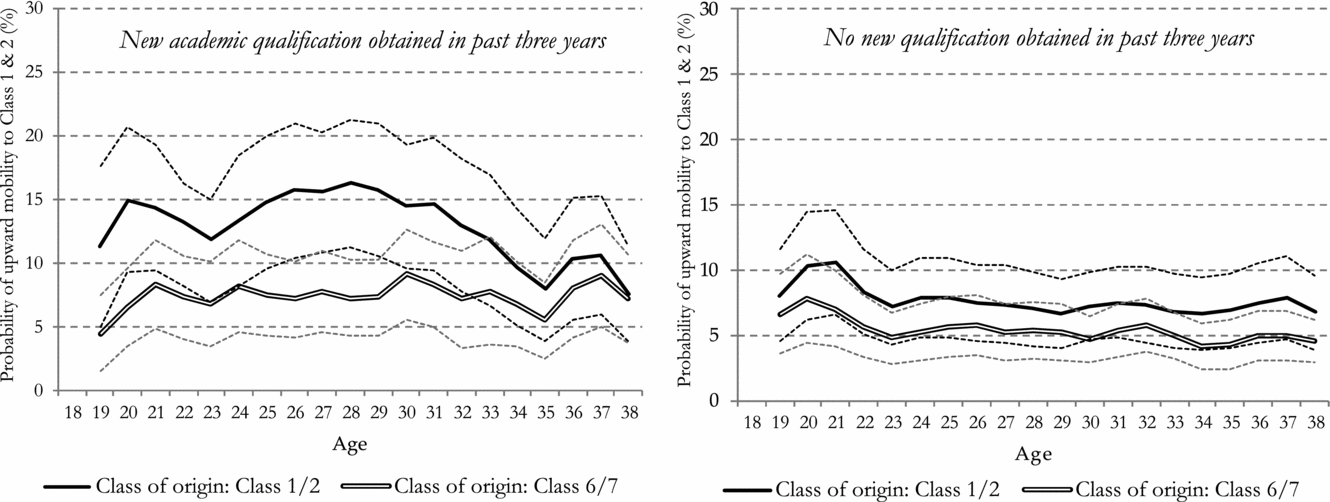
In order to further illustrate the relationship between social origin and class returns to further education, I calculate predicted probabilities of upward career mobility to the managerial and professional salariat at each age, for individuals coming from different origins (Figures 4 and 5). The probabilities are calculated separately for individuals who obtained new academic qualifications in the past three years and for those who did not obtain any new qualification in the reference period. I focus on academic qualifications only, because, as shown above, new academic qualifications are more likely than new vocational qualifications to promote upward mobility. The probabilities are calculated under a model that includes all controls, plus interactions between obtaining new qualifications and age. As can be seen, overall, individuals from salariat origins are more likely than individuals from working-class origins to move up to managerial and professional positions during their working lives. But, more importantly, the disparities between individuals of salariat and of working class origins are much greater for those who recently obtained some new academic qualifications than for those who did not take part in further education in the past three years.
Predicted probability (with 95% Confidence Interval) of men moving up to the higher salariat (Class 1) by class of origin and age, separately for men who obtained new academic qualifications in past three years and for men who did not

Predicted probability (with 95% Confidence Interval) of women moving up to the salariat (Class 1 and 2) by class of origin and age, separately for women who obtained new academic qualifications in past three years and for women who did not
Conclusions
In this paper, I have examined the possibility that further education promotes intergenerational class mobility. On the basis of complete educational and class histories of individuals in a British birth cohort, I have addressed the following questions. Is there evidence that further education provides individuals coming from less-advantaged origins with a second chance to improve on their educational attainment? And, second, is there evidence that the returns to further qualifications, in terms of chances of upward class career mobility, are greater for children from less-advantaged backgrounds than for children from more-advantaged backgrounds?
The findings are in both cases mainly negative. The analyses indicate that individuals originating in the managerial and professional salariat benefit most from further education. They are more likely than their less-advantaged counterparts to obtain new academic qualifications during their working lives, and especially if their own class position is lower than their parents’ position. And these new academic qualifications then increase their chances to move upwards within the class hierarchy, in most cases to the higher or lower levels of the salariat. But new academic qualifications do not guard against downward mobility, even for the children of the salariat.
The analyses also indicate that while individuals from less-advantaged origins – and women of working-class origins in particular – are more likely to obtain further vocational qualifications than are individuals from more advantaged origins, new vocational qualifications are of variable value in the labour market. For men, new vocational qualifications do not seem to increase their chances of moving up the class ladder while, for women, their role in worklife mobility is quite complex. Obtaining new vocational qualifications is associated with better chances of moving up within the class hierarchy, although not to the level of the higher salariat, but is also associated with increased risks of downward mobility. The explanation lies in the specificity of women's employment careers. Obtaining new vocational qualifications helps women who previously had managerial or professional positions to re-enter the labour market after a career break, although in less advantaged class positions.
How then can we interpret these findings in the light of the two possible scenarios that were set out regarding the link between further education and intergenerational social mobility: the compensatory and cumulative (dis)advantages scenarios? In general, it is the latter scenario that the findings of the paper support – echoing the results of two other recent studies in this area (Gloster et al., Reference Gloster, Buzzeo, Marvell, Tassinari, Williams, Williams, Swift and Newton2015; Blossfeld et al., Reference Blossfeld, Kilpi-Jakonen, Vono de Vilhena and Buchholz2014). But what neither of these studies was able to show is the following. Further education appears to be a particularly effective means of career advancement for individuals of salariat origin who, because of a relatively poor initial academic performance, start out in relatively low-level class positions. Via further education they can increase or update their academic qualifications, and in turn enhance their chances of being counter-mobile back to their class of origin, i.e. to the salariat. Individuals of working-class origin who enter the labour market in working-class position may later raise the level of their qualifications, especially their vocational qualifications, but this improvement does not lead to increased chances of upward worklife, and thus intergenerational mobility, at least for men. For women, any upward mobility that follows is more to intermediate than to higher level class positions.
Overall, then, the analyses reported in this paper, though of an essentially descriptive kind, lead to the conclusion that qualifications attained through life-long learning primarily serve, in Britain at least, to maintain, rather than to narrow, inequalities in life-chances that are attached to social origins. To understand why policy in this regard has largely failed to meet its compensatory objectives, a deeper analysis would be required of the actual causal mechanisms – at the level of individual action and interaction – that underlie the empirical regularities that have been demonstrated. One obvious hypothesis, that is at all events consistent with the results reported, is that the psychology of ‘loss aversion’ (Kahneman, Reference Kahneman2011) plays a crucial role. A strong motivation may be created on the part of individuals who have been downwardly mobile from relatively advantaged families to reverse this loss of social position. And this may in turn create a more powerful drive to exploit opportunities for further education – and one supported by greater economic and socio-cultural resources – than that which exists on the part of individuals of less advantaged origins to take up further education as a route to upward mobility. Post-school education and training would not therefore appear to be the most effective way to promote intergenerational social mobility. Policy-makers would appear to have good grounds for attaching greater importance to educational programmes and interventions that target children from disadvantaged backgrounds in pre-school and early school years.
Appendix
Effects of controls on probability of obtaining further qualifications

Effect of class of origin on the probability of obtaining further academic qualifications, men
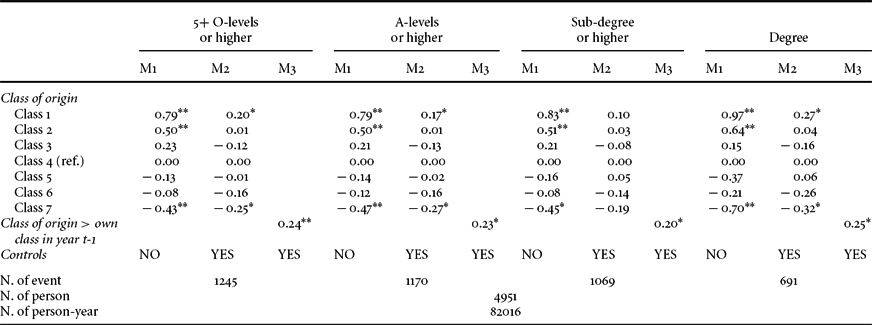
Effect of class of origin on the probability of obtaining further academic qualifications, women

Effects of controls on probability of upward and downward career mobility

Effects of obtaining further qualifications on upward class career mobility - including additional controls

Effects of obtaining further qualifications on downward class career mobility - including additional controls
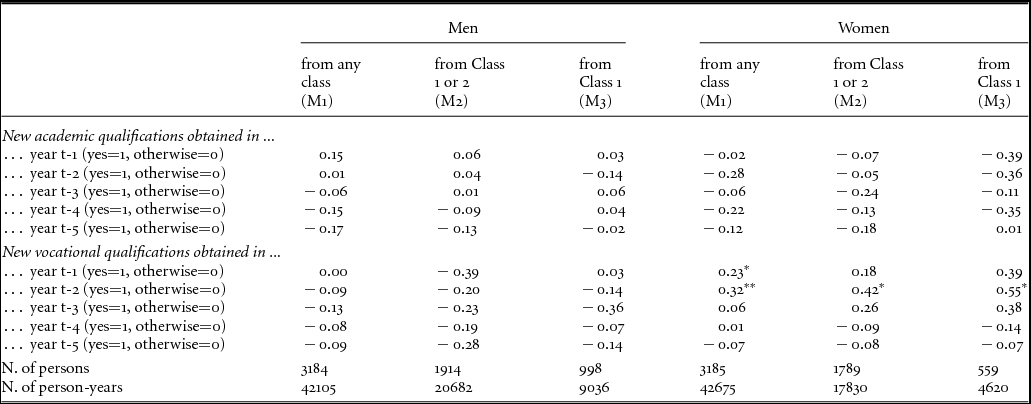
Effects of further vocational qualifications that raise the highest level of vocational educational attainment on downward class career mobility by level of new qualification
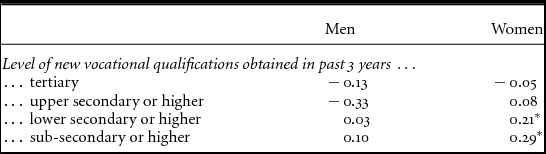
Interaction effects between class of origin and further qualifications on upward class career mobility

Interaction effects between class of origin and further qualifications on downward class career mobility



