


INTRODUCTION
Meningococcal meningitis (MM) caused by Neisseria meningitidis is a major public health problem in the ‘Meningitis Belt’, a region in sub-Saharan Africa extending from Senegal to Ethiopia with an estimated population of 400 million people [Reference Lapeyssonnie1, Reference Molesworth2]. MM is a highly contagious disease transmitted from person-to-person through infected respiratory droplets. The mortality rate in the Belt is about 10%, even with appropriate treatment, and 10–15% of survivors suffer long-term neurological sequelae [Reference Smith3]. Asymptomatic carriage is a notable feature of the disease, with carriage rates varying between 3% and 30% across countries and seasons [Reference Trotter and Greenwood4]. Incidence rates in the Belt are among the highest in the world, and show a marked seasonal increase together with recurring localized epidemics [Reference Greenwood5, Reference Mueller and Gessner6].
Little is known about the underlying process that drives the observed pattern of the disease. The annual rise in incidence coincides with the onset of the dry and dusty season and ends with the arrival of the rain [Reference Lapeyssonnie1, Reference Molesworth2]. It is believed to involve complex interplays among transmission dynamics, re-introduction or arrival of new strains, climate forcing [Reference Mueller and Gessner6], and immunity [Reference Mueller7–Reference Girard9]. Due to the complexity of the epidemiological process and lack of detailed knowledge, no statistical model has yet been able to describe the variation in incidence at the spatio-temporal scale required for in-year response to emerging epidemics, namely district-level spatial resolution, and weekly temporal resolution.
These considerations, in addition to the supply shortage, cost-effectiveness and short-term efficacy of the currently used polysaccharide vaccine, have necessitated a reactive public health strategy [10]. In order to distinguish an emerging outbreak from an expected seasonal increase at district level, two epidemiological thresholds have been introduced. When the alert threshold is reached, surveillance and epidemic preparedness are enhanced; when the epidemic threshold is exceeded, a mass vaccination campaign is launched. Efficacy of the currently used polysaccharide vaccine is believed to be ∼3 years [Reference Girard9]. Timely immunization could prevent an estimated 60% of cases [Reference Woods11]. However, quality and timeliness of the surveillance, lack of infrastructure, logistic constraints and limited global vaccine supply often delay implementation. As a consequence, this strategy has not proved fully effective. In particular, a reliable method for anticipating epidemics by a few weeks would be a material improvement.
Our objective in this study was to develop a statistical model that will give weekly predictions of emerging epidemics at district level. We took an empirical approach, using historical time-series of weekly incidence in Niger to build the model and assess its ability to predict past epidemics. The model captures the infectious nature of the disease by allowing incidence to be correlated in both space and time, rather than by mimicking the underlying transmission mechanism. Mechanistic models for meningitis epidemics have also been developed [Reference Irving12] but to use these models for prediction would require more detailed knowledge of the underlying biological, environmental and social processes involved than is currently available.
Empirical modelling has been used previously for infectious diseases to describe times and locations of individual cases [Reference Rowlingson, Diggle and Su13], or to fit discrete models to incidence data aggregated to small-area level [Reference Paul, Held and Toschke14]. In our study, we used a spatially and temporally discrete framework, and further categorized incidence into three states according to the alert and epidemic thresholds. We adopted a multinomial logistic Markov chain model [Reference Diggle15] to describe the weekly transitions among states. This categorization of the incidence data potentially loses information, but avoids the need for possibly inappropriate distributional assumptions, and may therefore be more robust to inaccuracies in the data. As no predictive model has previously been developed for MM in the Belt, our approach represents a pragmatic baseline relative to which predictive performances of more complex models could be compared in due course.
METHODS
Data
Within the Belt, Niger has the longest history of MM weekly reporting, with district-level number of suspected cases being reported through the national enhanced surveillance system since 1986. Data are available up to 2007. We used the 1986 partition of Niger into 38 districts. Four districts were created in 2002, each as a result of the division of a single district: for consistency, data were aggregated into the 1986 partition. Suspected cases were identified by a standard case definition based on clinical criteria [16]. Census-based estimates of district-level population denominators were available for 1977, 1988 and 2001; in other years, denominators were estimated by linear interpolation.
Model definition
The definitions of the district-level alert and epidemic thresholds depend primarily on the incidence, with minor modifications for districts with small populations or high incidence in neighbouring districts [10]. However, Niger records among the highest incidence rates every year, and most of its district-level population denominators are sufficiently large to allow us to consider constant alert and epidemic thresholds of 5 and 10 cases/100 000 population, respectively, very close approximations to the WHO definitions. We assume that Y d(t) denotes the incidence rate (in cases/100 000 population) in district d, week t (t = 1 to 52*21 for the 52 calendar weeks of the 21 years of the study period) and S d(t) the corresponding state:
 $$S_{d} ( t) = \left\{ {\matrix{ 0 \hfill & {{\rm if\ }Y_{d} ( t) \lt 5} \hfill & {( {\rm latent\ state}) } \hfill \cr 1 \hfill & {{\rm if\ }5\les Y_{d} ( t) \lt 10} \hfill & {( {\rm alert\ state}) } \hfill \cr 2 \hfill & {{\rm if\ }Y_{d} ( t) \ges 10} \hfill & {( {\rm epidemic\ state}) } \hfill \cr} } \right.$$
We describe transitions between states by a spatial multinomial Markov model, in which the conditional probability distributions at any time t are explicit functions of past outcomes [Reference Cox17]. We allow p dij(t) to denote the probability that district d switches from states {S d(t −1), S d(t − M)} = {i 1, i M}=i to state S d(t)=j. It should be noted that i is an M-element vector, whereas j is a scalar. The value of M defines the temporal order of the Markov model, which we assumed to be either M = 1 or M = 2. We modelled the log-odds of the transition probabilities by multiple linear regressions whose specification is informed by exploratory analysis of the data.
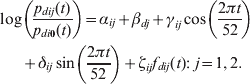
Incidence exhibits a strong seasonality (Fig. 1a) and heterogeneity among districts (Fig. 1b), which may be related to population density (Fig. 1c). Moreover, the incidence time-series from different districts show a distance-related cross-correlation structure (Fig. 1d). We therefore considered a class of models that include additive effects for time trends, spatial trends and spatio-temporal interactions, the latter denoted by f dij(t) as follows:
 $$\eqalign{ \log & \left( {{{p_{dij} ( t) } \over {p_{di0} ( t) }}} \right)= \alpha _{ij} + \beta _{dj} + \gamma _{ij} \cos \left( {{{2\pi t} \over {52}}} \right) \cr & + \delta _{ij} \sin \left( {{{2\pi t} \over {52}}} \right) + \zeta _{ij} f_{dij} ( t) \colon \ j = 1\comma 2. \cr} $$
[colour online]. (a) Time plot of nationally aggregated cases in Niger (log-transformed) over the 1986–2007 period, (b) mean annual incidence per 100 000 population computed over the 1986–2007 period by district, (c) district-level population density, and (d) plot of correlation between district-level time-series of cases against related distance between district centroids.

In this model, βdj are the district-specific intercepts, i.e. they represent differences between districts with respect to their likelihood of entering the alert (j = 1) and epidemic (j = 2) states. The spatio-temporal interaction terms, f dij(t), represent transmission of infection between neighbouring districts and capture the spatial structure of the data. We assumed that d′∼d denotes that d′ is considered a neighbour of d. We defined neighbours either as all other districts, or as only those districts sharing a boundary with d. Weights w d′,d represent the strength of the influence of d′ on d. We considered several definitions of w d′,d: constant, inversely proportional to the number of neighbours of d, inversely proportional to the distance between the centroids of d and d′, and proportional to the population density of d′. For given definitions of neighbourhood and weights, we defined the spatio-temporal interaction term as
 $$f_{dij} ( t) = \sum\limits_{d ^\prime ~ d} \,w_{d ^\prime\comma d} \ast \max \lcub S_{d ^\prime} ( t - 1) \comma \ldots \comma S_{d ^\prime} ( t - N) \rcub\comma $$
where N is the order of the spatio-temporal interaction effect. We consider that N = 1 and N = 2.
Model selection: proper scoring rules
The parameters of each model were estimated by maximum likelihood. Model selection was assessed through the use of the logarithmic proper scoring rule, which measures how well-calibrated the modelled transition probabilities are compared to the observed transitions [Reference Gneiting and Raftery18]. The score for a candidate model is SR = Σd,t log(pdiv(t)) where the vector i and the scalar v are the values that materialize for {S d(t − 1), S d(t − M)} and S d(t), respectively. We selected the candidate model that gave the highest value of SR.
Measuring forecasting performance
Given data up to and including time t, the selected model can be used to derive the predictive probabilities that a district will be in the epidemic state in week t + k (called k-week forecasting) or in any of weeks t + 1, t + 2, …, t+k (called within-k-week forecasting). Because our model is a short-memory process, forecasts converge towards the equilibrium distribution with increasing forecast horizon k, irrespective of past incidence. We therefore considered only k = 1, 2, 3, 4, 5.
To assess the forecasting performance of the selected model, we used a form of cross-validation per meningitis-year, defined as a 12-month period beginning during the wet season [Reference Lewis19, Reference Thomson20]. For each meningitis-year m = 1 (1986–1987) to 21 (2006–2007), we re-estimated the model parameters using all the data excluding meningitis-year m and used this model to forecast weekly outcomes in meningitis-year m. In practice, coefficient values for a predictive model would be updated after each meningitis season, and used in the following year.
From a public health policy perspective, the most important prediction is entry into the epidemic state. We therefore focused on correctly predicting that a district will be in the epidemic state either in exactly k weeks, or at any time within k weeks. In either case, to convert these predictive probabilities into operational forecasts, we specified a critical probability c such that, if the predictive probability is greater than c, we make a positive forecast. The choice of c will affect the sensitivity (Se), specificity (Sp), positive predictive value (PPV) and negative predictive value (NPV) of the forecasting system. It is important to take all four criteria into account as the overall proportion of epidemic state observations is small, implying that a rule that performs well with respect to sensitivity and specificity could perform badly with respect to PPV and NPV. We selected c pragmatically as the value that minimizes:
 $$( 1 - {\rm Se}) ^{2} + ( 1 - {\rm Sp}) ^{2} + ( 1 - {\rm PPV}) ^{2} + ( 1 - {\rm NPV}) ^{2}. \ $$
Although our focus for evaluation is on predicting entering the epidemic state, including an alert state in the model provides a better fit to the data and is in accord with current public health policy, in which exceedance of the alert threshold triggers a warning to prepare for possible vaccination in the district concerned.
Weekly-scale and annual-scale forecasting performance
We evaluated the models' forecasting performance on two different time-scales. For a weekly-scale evaluation, we classified forecasts for each district at each time t as positive or negative according to whether the corresponding predictive probability was or was not greater than c.
For an annual-scale evaluation, we argue as follows. The important public health decision for each district in each meningitis-year is whether, and if so when, to vaccinate; once a district has been vaccinated, there is no scope for further vaccination later in the same year. Hence, for each district and each meningitis-year, the relevant considerations are whether the epidemic threshold was exceeded at some point during the year, and whether our predictions were able to forecast an epidemic state in advance, even if the positive forecast did not predict the exact week in which the epidemic threshold was exceeded. We therefore re-defined a single forecast for each meningitis-year and district as: true positive if the epidemic state was entered following a positive epidemic forecast; false positive if the epidemic state was not entered at any time in the year, but at least one positive epidemic forecast was made during the year; true negative if the epidemic state was not entered at any time and no positive epidemic forecast was made; false negative if either the epidemic state was entered before the first positive epidemic forecast, or the epidemic state was entered at some point in the year and no positive epidemic forecast was made at any time.
To optimize the annual-level forecasting performance, we again chose c to minimize equation (1). In addition to classifying each forecast as described above, for each true positive forecast we calculated the number of weeks gained, i.e. the number of weeks between the first positive forecast and the subsequent entry into the epidemic state.
Software implementation
All statistical analyses were performed in the R software environment (R Project for Statistical Computing; http://www.r-project.org). Maximum likelihood estimation used the R function multinom. R code for prediction is available from the corresponding author.
RESULTS
Model selection
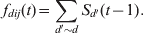
The model giving the highest value of SR is of temporal order M = 2, with neighbours defined as districts that share a common boundary and spatio-temporal interaction of order N = 1:
 $$f_{dij} ( t) = \sum\limits_{d ^\prime ~ d} S_{d ^\prime} ( t - 1). $$
SR values for competing models are displayed in Supplementary Table S1. Maximum likelihood estimates and standard errors for parameters for the selected model are tabulated in Supplementary Tables S2 and S3. As expected, transitions into the epidemic state are more likely from the alert state than from the latent state (Supplementary Table S4). The spatial term had the highest impact when the state for the previous 2 weeks was latent (parameters ζij in Supplementary Table S2).
We examined the spatial and temporal disparities in the model fit by disaggregating the score SR, according to district and year. Districts with the highest incidences recorded the smallest scores, averaged over years (Supplementary Fig. S1). We found no overall link between population density and model parameters, although some of the highest incidences were seen in high-density districts close to the Nigerian border (Supplementary Fig. S1). The 2005 epidemic could have been expected to show a different seasonality because of the circulation of an unusual W135 strain of the bacterium [Reference Collard21], but the scores for this year were not markedly different from those for other years. Cross-validated predictive probabilities were generally very close to the corresponding probabilities obtained by fitting the model to the complete dataset (Fig. 2). The largest differences averaged per year were observed in 1995 and 1996, which recorded the largest number of cases (Supplementary Table S5); the points with the largest differences were recorded in 1996 and 1999 (Supplementary Fig. S2).
Fitted values (y axis) are compared to cross-validated values (x axis) for the probabilities of entering (a) the latent state, (b) alert, and (c) epidemic state. This figure is given in colour in Supplementary Figure S2.

Forecasting capabilities and time gained
The 1-week epidemic state forecasts had specificity 99·3%, NPV 99·1%, sensitivity 72·4% and PPV 76·5%.
Results for the k-week and within-k-week-ahead epidemic forecasts (k = 2–5) are given in Table 1. Specificity and NPV values all remained >97%, while small overall decreases in sensitivity and PPV were observed for increasing k values. The within-k-week predictions are more accurate than the k-week-ahead predictions. With regard to annual-scale forecasting, it should be noted that over the 798 district-years covered by our data, 226 were epidemic, i.e. the epidemic state was entered at least once. The observed performance characteristics relating to the 1-week-ahead predictions were: sensitivity 65·0%; specificity 73·2%; NPV 84·1%; PPV 49·0%. In all, 147 epidemic district-years were correctly predicted in advance, with an average time between the first positive forecast and the actual exceedance of the epidemic threshold of 4·6 weeks. Among the 572 non-epidemic district-years, 153 were mistakenly predicted to be epidemic.
Sensitivity, specificity, PPV and NPV values for forecasting an epidemic state using the k-week and within-k-week-ahead predictions, k = 1–5

PPV, Positive predictive value; NPV, negative predictive value.
All values are percentages.
DISCUSSION
Model
Multinomial Markov models have been used in a range of health-related settings for individual-level outcomes [Reference Bizzotto22, Reference Yu23]. To our knowledge, this study is the first that applies multinomial Markov models to categorized spatio-temporal incidence data. The model formulation directly reflects current operational guidelines, not only with respect to the choice of categorization, but also by the incorporation of spatial neighbourhood information in forecasting future incidence [10]. Codifying incidence as a three-level categorical variable represents a potential loss of information, but avoids the need to make possibly incorrect distributional assumptions. This relatively simple model provides a first prediction-oriented model for MM epidemics in the Meningitis Belt. The results are encouraging, with 1-week-ahead predictions for entering the epidemic state giving specificity and NPV >99%, and sensitivity and PPV >72%.
Selecting second-order rather than first-order temporal dependence is consistent with the intuitive idea that the incidence trajectory has greater predictive value than current incidence alone; while a time-lagged spatial effect captures the transmission of infection across district boundaries. In view of the relatively large geographical scale of Niger's districts, this stochastic dependence between adjacent districts might, however, be a proxy for unmeasured large-scale spatial variation in environmental factors that affect disease risk, rather than representing a direct transmission effect between infected and susceptible individuals. Including more covariates in the model could further improve the results, although there would be an attendant risk of overfitting. Other modelling approaches could also be investigated and evaluated using the current model as a benchmark.
Population density is thought to play a key role in the dynamics of the disease process, by directly affecting the risk of infectious-susceptible contacts [Reference Moore24]. We therefore explored several ways of replacing the district-specific intercept βdj by a modelled population density effect, but none of these provided as good a fit as the selected model. A likely explanation is that a single population density value for a district cannot capture its uneven population distribution. Other possible covariates that could explain between-district heterogeneity, but which were not available to us for this study, include immunity of the population, history of vaccination campaigns, knowledge of locally circulating strains or unmeasured environmental covariates.
Our model accounts for seasonal forcing by fitting harmonic terms. These can be viewed as proxies for climatic factors that are thought to affect susceptibility in the local populations, but they cannot explain inter-annual variation. Two ways to do so would be to add to the model climatic variables that might better capture the changing seasonality of MM over time, or to fit dynamic versions of the harmonic terms in the model, whereby the regression coefficients change smoothly over time [Reference Fanshawe25]. Pluri-annual seasonal components have been described in the literature [Reference Broutin26], and could also be included to reflect the dynamics of different MM strains and of natural and vaccine-related immunity in the population.
We have already acknowledged that minimizing equation (1) to choose the ‘optimal’ value of c is a pragmatic strategy. We would argue that the role of a statistical forecasting model is to provide accurate predictive probabilities for the various outcomes of interest. Decisions on what to do in response to this information need to take account of many other context-specific considerations, including the relative monetary and social costs of acting on a false positive or failing to act on a false negative.
Limitations
Under-reporting can easily occur, as well as over-reporting due to cases of Streptococcus pneumoniae or Haemophilus influenzae type B being reported as MM cases. Nevertheless, MM (especially group A MM) is unique in its ability to cause large-scale epidemics in Africa [Reference Mueller7], the level of awareness and concern in the local population is high, and health professionals are trained to report suspected cases according to a consistent case definition following WHO guidelines. Any bias in reported incidence is therefore likely to be approximately constant throughout the country, and in any case was taken into account when the recommended intervention thresholds were defined using data reported according to the same WHO guidelines.
The epidemiology of MM disease is expected to change within the next few years following the introduction of a new conjugate A vaccine. This vaccine promises longer-term protection and a better herd immunity than is delivered by the current polysaccharide vaccine. If the overall risk of MM decreases, it might be appropriate to lower the probability threshold for probabilistic forecasts to declare a high risk of an outbreak, or to focus on transition into the alert state, rather than the epidemic state, as the trigger for intervention.
Finally, our model has been constrained by the limited spatial resolution of the data. More finely resolved spatial information on population distribution and incidence would be expected to lead to better results, as epidemics have been observed to occur at subdistrict level [Reference Mainassara27]. In principle, the model could also be adapted to handle changing geography over time. For example, if a single district is subdivided during the observation period, subdistrict-level transition probabilities for the district in question prior to its subdivision could be calculated by summing the corresponding subdistrict-level transition probabilities. In practice, a simpler but approximate solution would be to impute subdistrict-level counts from the observed district-level counts and check the sensitivity of the results to different imputations.
CONCLUSIONS
Although the results presented here are encouraging, model-based forecasts alone should not be used automatically to launch pre-emptive vaccination campaigns. Rather, they can and should inform decisions on preparatory actions, such as the predisposition of material and resources according to the suspected risk of an outbreak. This could enable more timely intervention when outbreaks do occur. Models of this kind could be applied to other diseases in similar settings, i.e. when knowledge about the disease mechanism is limited and individual-level data are not available. In such situations, the use of a more complex model can lead to parameters being poorly identified, with consequently poorer predictive performance.
SUPPLEMENTARY MATERIAL
For supplementary material accompanying this paper visit http://dx.doi.org/10.1017/S0950268812001926.
ACKNOWLEDGEMENTS
We thank the Nigerian Ministry of Health, the Centre de Recherche Medicale et Sanitaire (CERMES), Niger and the World Health Organization for providing the data. We also thank Helene Broutin, Stephane Hugonnet and Judith Mueller for general advice on meningococcal meningitis, and helpful suggestions. This work was supported by Lancaster University through the award of a Ph.D. studentship to Lydiane Agier.
DECLARATION OF INTEREST
None.



