Introduction
Given their critical role in the aftermath of disasters, hospitals must establish a disaster-safe environment to effectively fulfill their functions as providers of health services. Reference Seyghalani Talab, Ahadinezhad and Khosravizadeh1–Reference Cruz-Vega, Elizondo-Argueta and Sánchez-Echeverría3 Continuing hospital operations during a disaster depends on several components, including buildings, plans for disaster response and recovery, human resources, communication and information management, and the availability of essential resources, such as medicine, supplies, and equipment for disaster events. Reference Husaini, Sugiarto and Rahmanand4–Reference Samsuddin, Takim and Nawawi7
Although various instruments have been recommended for evaluating hospital safety in disasters, the Hospital Safety Index (HSI) is a critical instrument in this regard. Developed by the World Health Organization (WHO; Geneva, Switzerland) and Pan American Health Organization (PAHO; Washington, DC USA) in 2008 and updated in 2015, the HSI offers recommendations for enhancing hospital safety and promoting disaster risk reduction world-wide. This instrument comprises four modules: Hazard and Vulnerability Analysis, Structural Safety, Non-Structural Safety, and Emergency and Disaster Management. Reference Goniewicz, Khorram-Manesh and Timler8–11
Iran is a disaster-prone country, and the imperative to mitigate the vulnerability of non-structural components has drawn heightened scrutiny from pertinent organizations. In addition to their detrimental effects on communities and infrastructural integrity, incidents can significantly affect hospitals and their non-organizational facets. Functioning as the primary bastion of medical service delivery in the aftermath of a disaster, hospitals are compelled to uphold stability, safeguard the well-being of their patients and staff, and sustain uninterrupted operations, mirroring standard conditions. Therefore, the assessment of non-structural safety is paramount in guaranteeing their proficient performance under exigent situations. Reference Basiri, Farajzadeh and Belal12
Ensuring the operational continuity of hospitals during disasters necessitates the annual assessment of these facilities using the HSI. It is imperative that this evaluation be conducted by each Hospital’s Disaster Risk Reduction (HDRR) Committee. Although several national studies have reported a moderate to high level of safety in Iranian hospitals, Reference Roshani and Karimian13–Reference Bahadori, Izadi and Ghardashi15 evidence from past disasters presents a different reality. Historical events have shown that several health care facilities have sustained significant structural damage or were rendered non-operational, thereby failing to deliver critical services in the aftermath of an emergency. Reference Amini Hosseini, Izadkhah and Mansouri16,Reference Ardalan, Kandi Keleh and Saberinia17 This could be rooted in several technical and non-technical issues, including poor prioritization, lack of commitment from decision-makers, and insufficient understanding and knowledge about the health system. These challenges led to the development of the Lost in Translation (LiT) effect, which in some cases created a culture of complacency. Reference Achour18
Given that the evaluation using the HSI relies primarily on the self-assessment of investigators, it can lead to subjective judgments and perceptual biases. To mitigate this bias, adherence to the guidelines outlined in the “WHO Guide for Evaluators” is required. Furthermore, the assessment by one evaluator minimized bias associated with inter-observer variability. Reference Lamine, Chebili and Zedini19
To address this discrepancy and guarantee functional resilience, it is recommended that the provincial universities of medical sciences, the main health care authorities, establish a supplementary oversight process. This process adds a second layer of annual evaluation, in which external auditors assess hospitals to independently confirm their safety. The objective is to ensure that these facilities can withstand and respond effectively to future disasters.
Recognizing this limitation, this study seeks to complement these internal perspectives by incorporating external evaluations conducted by experts from the Deputy of Treatment at Kermanshah University of Medical Sciences (KUMS; Kermanshah, Iran). This study aims to quantify the extent of this bias by comparing internal HSI self-assessments with external evaluations, thereby testing the validity and reliability of the current self-reporting mechanism.
The primary outcome of this study was to compare the Total Hospital Safety Score between internal and external evaluators. Secondary objectives included comparing the structural safety, non-structural safety, and functional safety scores between internal and external evaluators.
Materials and Methods
Study Design
This was a cross-sectional study conducted to compare the internal and external disaster safety of hospitals under the official supervision of KUMS.
Study Settings
KUMS is responsible for health care delivery and auditing in Kermanshah Province, which is located in western Iran. The region is prone to various natural hazards, including annual dust storms, a major earthquake with a magnitude of 7.3 in 2017, and severe flooding in 2019. Additionally, KUMS plans and provides health services to Arbaeen pilgrims annually.
Participants
Data were collected from 24 hospitals with different affiliations: educational, community, social security, military, and private. As KUMS is the responsible organization in Kermanshah Province, it supervises all of these hospitals. The study was approved by the KUMS Institutional Review Board (IR.KUMS.REC.1400.599). The anonymity of the participating hospitals was maintained throughout the study.
Outcome Measurement
The data collection tool used by both the internal and external evaluation teams was the second edition of the HSI, which comprises 151 items. This tool consists of four main modules: Hazard Analysis (covering main hazard types), Structural Safety (two subcategories and 18 items), Non-Structural Safety (12 subcategories and 93 items), and Functional Safety (seven subcategories and 40 items). Each item is scored on a three-point Likert scale: low (0), moderate (1), and high (2).
To calculate the primary outcome of Total Hospital Safety Score, all HSI modules including non-structural, structural, and functional safety have equal weight (33.3%). A constant value is applied to each safety level to prevent any distortion during the evaluation. The safety index for each submodule is scaled from zero to 100, where zero indicates the lowest and 100 the highest level of safety. 11 The hazard analysis category is excluded from the computation of the overall hospital safety score.
The HSI was subsequently translated into Persian and culturally adapted by a multidisciplinary expert team comprising specialists in engineering, medical sciences, and disaster management. This adapted instrument, designated the Farsi Hospital Safety Index (FHSI), was then piloted at Tehran University of Medical Sciences (Tehran, Iran) to assess its validity. In addition, the validation team developed a dedicated Microsoft Excel spreadsheet (Microsoft Corp.; Redmond, Washington USA) for data entry, storage, and the presentation of assessment results according to the WHO HSI calculator. Reference Ardalan, Kandi Keleh and Saberinia17,Reference Ardalan, Najafi and Sabzghabaie20 The test-test reliability of the HSI tool has been reported as 93% in previous research. Reference Ardalan, Najafi and Sabzghabaie21
Data Collection
The data used in this study were collected in 2022. Both internal and external evaluations were conducted in the same year. In accordance with the accreditation protocol of Iranian hospitals, the HDRR Committee was required to conduct an annual safety assessment of its respective hospital. This evaluation was usually performed at the beginning of each year. The HDRR Committee members served as the internal evaluators and formed a multidisciplinary team composed of hospital managers, nurses, engineers, and safety officers. This group participated in annual hospital safety training sessions held at their own hospitals. The results of the assessment were subsequently submitted to the Disaster Risk Reduction (DRR) Office at the Treatment Deputy of KUMS for organizational oversight.
Additionally, the DRR Office within the Treatment Deputy conducted annual evaluations to oversee HDRR programs and to offer recommendations for strengthening disaster response planning. The results of these assessments served as the external evaluation data. These evaluations were conducted according to a schedule designed by the DRR Office of the Treatment Deputy. The external evaluation team consisted of DRR coordinators from other hospitals and representatives from the KUMS Engineering Technical Office. Most external evaluators had backgrounds in nursing and engineering. This team participated in annual hospital safety training sessions at their respective hospitals, in addition to centralized training held by the DRR Office of the Treatment Deputy of KUMS.
The assessment results from both internal and external evaluators were entered into a Microsoft Excel spreadsheet designed by the FHSI developer team and stored in the DRR Office of the Treatment Deputy of KUMS.
The research team requested and subsequently received the collected data from the DRR Office at the Treatment Deputy. From the internal and external assessment reports, hospital-related characteristics and safety assessment scores (covering structural, non-structural, and functional attributes) were extracted. Missing values were imputed using the most frequent response within the corresponding safety component. It should be noted that the internal and external evaluations were conducted separately and at different time points.
Data Analysis
Information on hospital characteristics and safety components (structural, non-structural, and functional attributes) was imported into IBM SPSS Statistics version 24 (IBM Corp.; Armonk, New York USA). The mean scores for each safety component are presented with their standard deviations (SD). For the primary and secondary outcomes, the difference between scores from internal and external evaluators were compared using the independent samples t-test. Exploratory outcomes included the agreement between evaluators which was assessed using the Intraclass Correlation Coefficient (ICC). An ICC less than 0.5 indicated poor agreement, 0.51 to 0.75 indicated moderate agreement, and greater than 0.75 indicated good agreement. Agreement was assessed visually in Bland-Altman plots by examining the mean difference and the limits of agreement, with the expectation that 95% of the differences would lie within these limits. A P value of <0.05 was considered significant. The width of 95% confidence intervals for secondary and exploratory outcomes has not been adjusted for multiplicity, and the intervals should not be used in place of hypothesis testing.
Results
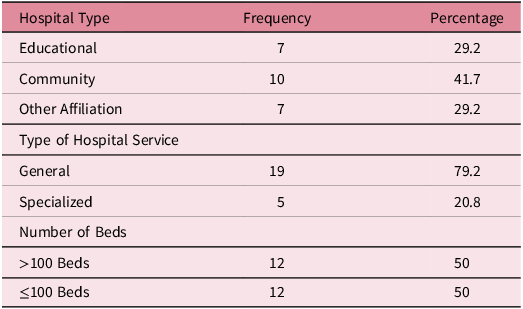
Data from 24 hospitals were analyzed. Nearly 30% of hospitals were educational centers, 42% were community hospitals, and the remaining hospitals were private, social security, or military organizations. Approximately 80% of the hospitals were general hospitals, with one-half of them having fewer than 100 beds (Table 1).
Hospital Characteristics which Participated in the Study

Table 1. Long description
A table summarizing hospital characteristics in a study. The table has three sections: Hospital Type, Type of Hospital Service, and Number of Beds. Hospital Type section includes three rows: Educational with a frequency of 7 and a percentage of 29.2, Community with a frequency of 10 and a percentage of 41.7, and Other Affiliation with a frequency of 7 and a percentage of 29.2. Type of Hospital Service section includes two rows: General with a frequency of 19 and a percentage of 79.2, and Specialized with a frequency of 5 and a percentage of 20.8. Number of Beds section includes two rows: greater than 100 Beds with a frequency of 12 and a percentage of 50, and less than or equal to 100 Beds with a frequency of 12 and a percentage of 50.
For the primary outcome of Total Hospital Safety Score, internal evaluators rated their hospitals higher than external evaluators by an average of 8.22 points (95% CI, 3.13 to 13.30; P = 0.001) with the ICC indicating poor agreement between the two groups (ICC = 0.40).
A comparison of mean scores for structural safety and its components is presented in Table 2. For total structural safety, the mean difference was 0.24 (95% CI, −9.19 to 9.67). The mean difference was −4.19 (95% CI, −15.24 to 6.86) for prior events affecting hospital safety and 3.98 (95% CI, −6.74 to 14.71) for building integrity. The ICC analysis indicated moderate agreement between evaluators for prior events affecting hospital safety (ICC = 0.63), but agreement was poor for building integrity (ICC = 0.02) and the overall structural safety score (ICC = 0.44).
Comparison of Internal and External Evaluations in Structural Safety Components of Hospitals

Table 2. Long description
A table comparing internal and external evaluations of hospital safety components. The table has 3 rows and 4 columns. Column headers are Internal Evaluation, External Evaluation, Mean Difference (Unadjusted 95% CI for Difference*), and ICC. Row labels are Prior Events Affecting Hospital Safety, Building Integrity, and Total Structural Safety. Row 1: Internal Evaluation, 74.99 (SD = 18.38); External Evaluation, 71.01 (SD = 18.53); Mean Difference, -4.19 (-15.24 to 6.86); ICC, 0.63. Row 2: Internal Evaluation, 69.71 (SD = 21.23); External Evaluation, 73.91 (SD = 16.52); Mean Difference, 3.98 (-6.74 to 14.71); ICC, 0.02. Row 3: Internal Evaluation, 72.48 (SD = 17.51); External Evaluation, 72.24 (SD = 14.85); Mean Difference, -0.24 (-9.19 to 9.67); ICC, 0.44.
* The width of the 95% confidence intervals has not been adjusted for multiplicity and should not be used in place of hypothesis testing.
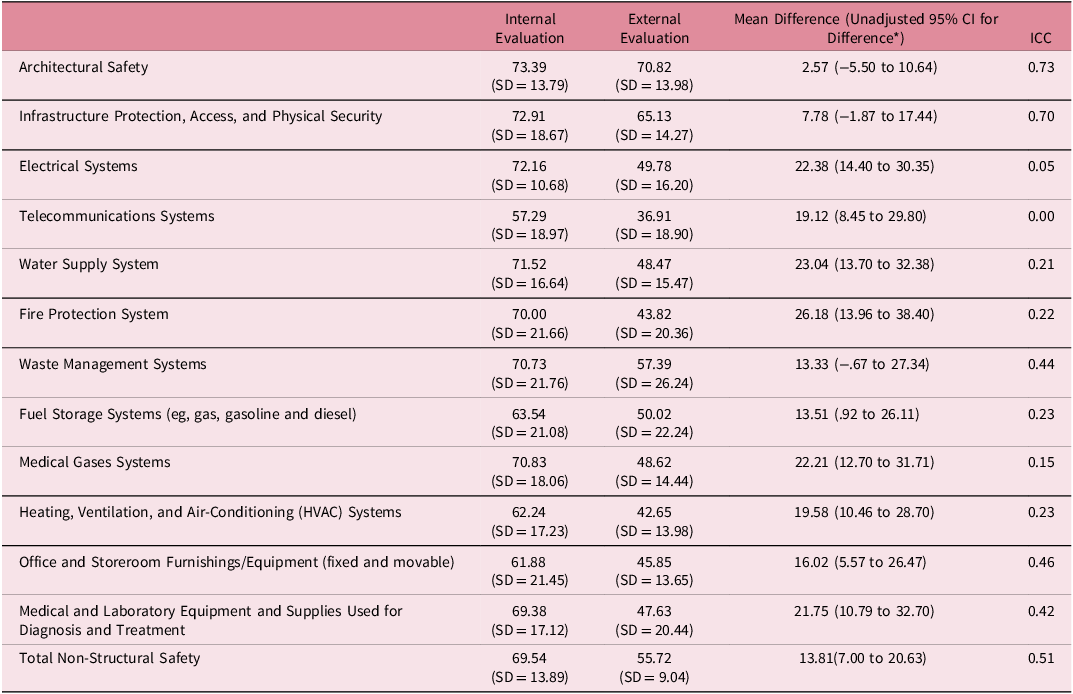
In the non-structural safety domain, internal evaluators rated their hospitals higher across all components (Table 3). The total non-structural safety mean difference was 13.81 (95% CI, 7.00 to 20.63). The largest mean differences were observed for fire protection system (26.18; 95% CI, 13.96 to 38.40), water supply system (23.04; 95% CI, 13.70 to 32.38), electrical systems (22.38; 95% CI, 14.40 to 30.35), and medical gases systems (22.21; 95% CI, 12.70 to 31.71). Smaller mean differences were seen for architectural safety (2.57; 95% CI, −5.50 to 10.64) and infrastructure protection, access, and physical security (7.78; 95% CI, −1.87 to 17.44). Agreement between evaluators was generally poor to moderate, with most components showing an ICC of less than 0.50. Architectural safety (ICC = 0.73) and infrastructure protection (ICC = 0.70) showed moderate agreement.
Comparison of Internal and External Evaluations in Non-Structural Safety Components of Hospitals

Table 3. Long description
The table has 13 rows and 5 columns. The columns are labeled Internal Evaluation, External Evaluation, Mean Difference (Unadjusted 95% CI for Difference), and ICC. The rows are labeled with different safety components such as Architectural Safety, Infrastructure Protection, Access, and Physical Security, Electrical Systems, and more. Each row contains values for internal and external evaluations, mean differences, and ICC scores. Notable components with higher mean differences include Fire Protection System, Water Supply System, Electrical Systems, and Medical Gases Systems. Components with smaller mean differences are Architectural Safety and Infrastructure Protection. The ICC scores vary, with Architectural Safety and Infrastructure Protection showing moderate agreement.
* The width of the 95% confidence intervals has not been adjusted for multiplicity and should not be used in place of hypothesis testing.
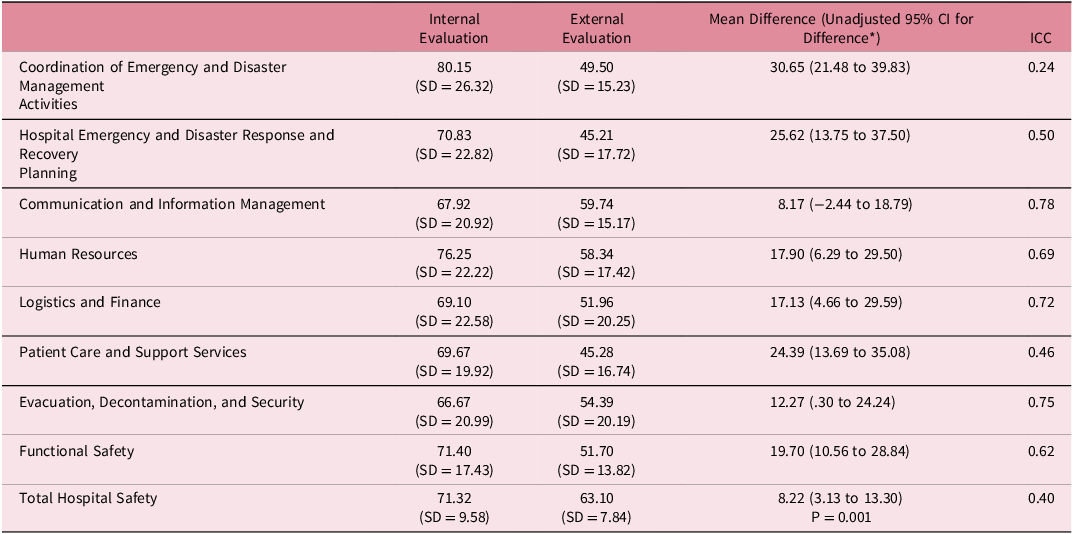
For functional safety, internal evaluators also assigned higher scores across all components (Table 4). The total functional safety mean difference was 19.70 (95% CI, 10.56 to 28.84). The largest mean differences were observed for coordination of emergency and disaster management activities (30.65; 95% CI, 21.48 to 39.83), hospital emergency and disaster response and recovery planning (25.62; 95% CI, 13.75 to 37.50), and patient care and support services (24.39; 95% CI, 13.69 to 35.08). Smaller mean differences were seen for communication and information management (8.17; 95% CI, −2.44 to 18.79) and evacuation, decontamination, and security (12.27; 95% CI, 0.30 to 24.24). The ICC results demonstrated good interrater agreement for communication and information management (ICC = 0.78), evacuation, decontamination, and security (ICC = 0.75), logistics and finance (ICC = 0.72), and human resources (ICC = 0.69). In contrast, agreement was poor for coordination of emergency and disaster management activities (ICC = 0.24) and patient care and support services (ICC = 0.46). Hospital emergency and disaster response and recovery planning showed moderate agreement (ICC = 0.50).
Comparison of Internal and External Evaluations in Functional Safety Components of Hospitals

Table 4. Long description
A table comparing internal and external evaluations of hospital functional safety components. The table has 10 rows and 5 columns. The columns are labeled Internal Evaluation, External Evaluation, Mean Difference (Unadjusted 95% CI for Difference), and ICC. The rows are labeled with different components of functional safety: Coordination of Emergency and Disaster Management Activities, Hospital Emergency and Disaster Response and Recovery Planning, Communication and Information Management, Human Resources, Logistics and Finance, Patient Care and Support Services, Evacuation, Decontamination, and Security, Functional Safety, and Total Hospital Safety. Each row contains values for internal and external evaluations, mean differences, and ICC scores. Notable trends include higher internal evaluation scores across all components and varying levels of interrater agreement.
* The width of the 95% confidence intervals for secondary and exploratory outcomes has not been adjusted for multiplicity and should not be used in place of hypothesis testing.
The Bland-Altman plot for structural safety showed good agreement, with most points clustered near the line of no difference and within the limits of agreement. In contrast, the plots for non-structural, functional, and total safety revealed a systematic bias, with the majority of points falling above the line of no difference, visually confirming that internal evaluators consistently provided higher scores than external evaluators (Figure 1).
Internal and External Evaluators’ Agreement Regarding HSI Main Components.

Discussion
This study provides empirical evidence of a significant and systematic discrepancy between internal and external evaluations of hospital disaster safety. These differences reveal a pronounced “optimism bias” among internal evaluators. The comparison of structural safety results indicated that both internal and external evaluators rated hospitals as having good structural safety (internal evaluation 72.48 versus external evaluation 72.24). This finding indicates that the structural safety of these hospitals is substantially higher than the national structural safety score of 57.20 reported by Ardalan, et al. Reference Ardalan, Kandi Keleh and Saberinia17
The results indicate that while the overall mean of “total structural safety” is nearly identical between the internal and external evaluations, the level of agreement in the specific variables varies greatly (ICC < 0.5). High and significant agreement regarding “Prior events affecting hospital safety” (ICC = 0.63) suggests an alignment in judgments based on objective records and past evidence. In contrast, the very low ICC for “Building Integrity” (ICC = 0.02) indicates a serious divergence in interpretive and qualitative judgments.
This result may be due to the lack of a standardized definition for the qualitative assessment of structural integrity in the HSI or a difference in the level of engineering expertise of internal evaluators compared to external teams. This difference in a critical component like the structure raises a serious concern that calls into question the credibility of internal assessments in interpreting the physical stability of the building and necessitates a review of technical guidelines for qualitative assessments.
Comparison of the non-structural safety of hospitals indicates a great gap between two groups of evaluators; internal evaluation consistently yields higher scores than external evaluation, and this difference is important in most non-structural safety components. The largest discrepancies are observed in fire protection, water supply, and electrical systems (differences > 20). Conversely, the comparison of architectural safety, infrastructure protection/physical security, and waste management system scores revealed the differences to be low (ICC > 0.5). These similarities may be attributed to the greater objectivity of the assessment criteria in these three areas, which reduces the need for subjective interpretation and operational judgment. These findings suggest that relying solely on internal self-assessments leads to an over-estimation of safety in vital sectors and reinforces a false sense of safety in response to disaster. A theoretical framework that may further explain this pattern is the LiT effect introduced by Achour (2024). This effect describes the mechanical, “paper filing” application of guidelines without a genuine understanding of their underlying goals and conceptual foundations. Reference Achour18 In the context of this study, internal evaluators may be more prone to such mechanical application of checklists, contributing to scoring discrepancies—particularly in domains requiring subjective interpretation. While organizational optimism bias captures the systemic tendency to over-estimate preparedness, the LiT Effect operates at the individual evaluator level, reflecting the gap between theoretical knowledge and practical application. Reference Achour18 Furthermore, the difficulties to implement the result of hospital safety assessment in the hospital operation may create a culture of complacency among the internal hospital evaluators.
In contrast to these findings, Valesky, et al (2013) reported that the hospital’s internal evaluators rated their surge capacity significantly lower than external evaluators did. Reference Valesky, Roblin and Patel22 Kaji, et al (2008) emphasized that different evaluation methods can lead to different results in assessing hospital non-structural safety, so no single method can reveal the actual level of non-structural safety in hospitals. Reference Kaji, Langford and Lewis23 Kaji, et al (2008) emphasized that different evaluation methods yield qualitatively different results regarding hospital disaster preparedness, concluding that “perhaps no single method adequately characterizes overall hospital preparedness.” In line with this reasoning, assessing non-structural safety with a single approach – particularly one relying solely on internal self-assessment – may not accurately capture the true non-structural safety status of a hospital. Reference Kaji, Langford and Lewis23
Although in other comparative studies, the main disagreement (and internal optimistic bias) is mostly observed in managerial and functional areas (such as disaster response planning, training, or equipment inventory). Reference Mishra, Patnaik and Pradhan24,Reference Patel, Tomar and Garg25 The study findings indicate that this difference can also extend to technical sections. Further research is needed to identify the main reason for these differences and the accuracy of hospital safety in the preparedness phase. Additionally, the safety of such non-structural systems should be tested in functional disaster exercises to resolve potential weaknesses.
Internal evaluators of hospital functional safety consistently scored higher than external evaluators across almost all areas in functional safety components (mean differences >19). This finding also indicates a potential organizational optimism bias regarding hospital safety for disasters. The most substantial discrepancy between internal and external perspectives was found in the coordination of emergency and disaster management and hospital emergency and disaster response and recovery planning (mean differences >25). This suggests a major gap in the hospital’s actual capability in response to disasters. Conversely, the smallest difference was observed in communication and information management (mean differences <10). This finding suggests that the main weakness is concentrated in the preparedness soft functions rather than in more objective aspects like communication and information management. Reference Samei, Babaie and Tabrizi26 Kaji, et al (2008) demonstrated that the rank correlation coefficient between on-site surveys and video analysis was -0.34. Reference Kaji, Langford and Lewis23 This negative correlation further highlights the lack of agreement between different assessment approaches, which aligns with the pattern of internal-external discrepancy observed in this study.
Furthermore, these findings strongly emphasize the need for impartial internal evaluations to validate actual functional safety and guide corrective actions towards the most critically deficient areas. This finding indicates a significant difference between internal (more optimistic) and external (more realistic) evaluations of functional safety, a phenomenon known as “Organizational Optimism Bias.” Reference Kaji, Langford and Lewis23 Furthermore, it is recommended that hospital managers do not consider the result of external evaluators as a conspiracy theory, which is more prevalent in most countries when there is a lack of transparent process.
The comparison of total hospital safety also shows that hospitals with other affiliations demonstrated the highest optimism, with their internal evaluation scores being higher than the external evaluation in all hospital safety dimensions. In contrast, community hospitals were the only group where the external evaluation reported a higher score than the internal evaluation for structural safety, suggesting a more self-critical or rigorous view of their structural safety. Ghanbari, et al (2024) also reported that hospitals with private and social security affiliations demonstrated higher levels of safety in response to disasters. Reference Ghanbari, Hidari and Salari27 This consistency may stem from the functional characteristics and the need for greater self-reliance in non-university settings. Cruz-Vega, et al (2018) have demonstrated a significant difference between the internal assessors of the HSI and the external assessors. This study emphasizes that internal hospital assessors are reluctant to see the realities and that most damages are observed in non-structural components, while the self-assessment score was medium to high. Reference Cruz-Vega, Elizondo-Argueta and Sánchez-Echeverría3 This issue strongly indicates the low validity of the self-assessment scores. Moreover, this finding suggests that the high internal score in non-structural components might simply be an over-estimation of confidence or result from the inherent weakness of the self-assessment method, rather than a true reflection of actual safety and preparedness.
Ignoring these vulnerabilities can lead to partial or total failure in disaster response. It is therefore recommended that hospital disaster safety assessment team members participate in more practical training and take part in the external evaluation of other hospitals. Such exposure would familiarize them with the challenges of assessing subjective components and help mitigate the LiT effect. Furthermore, hospital managers should be engaged in the implementation of hospital disaster risk reduction in the daily activities of their hospitals.
Limitations
Several limitations should be considered when interpreting these findings. First, the professional characteristics of the internal and external evaluators were not assessed. Differences in expertise, training, or experience may have influenced their assessments and contributed to the observed discrepancies. Second, the retrospective design of this study necessitated reliance on existing data, which could not be controlled and may have introduced information bias. Finally, as the research was conducted exclusively in hospitals within a single Iranian province, the generalizability of these findings to other regions or health care systems may be limited. Confidence intervals for secondary and exploratory outcomes were not adjusted for multiplicity and should not be used in place of hypothesis testing.
Conclusion
The findings indicated that, across most submodules of the HSI, internal evaluators rated their hospital safety as good. In contrast, external evaluators rated hospital safety as medium. These findings revealed low agreement between the two groups of evaluators regarding hospital safety. Relying solely on self-assessments could therefore mask critical hospital vulnerabilities.
Author Contributions
Vahid Ghanbari: Conceived and designed the study; analyzed the data and approved the final version of the manuscript.
Afshin Goodarzi: Writing the first draft of the manuscript and approved the final version of the manuscript.
Ali Mohammadi: Entering the data; read and approved the manuscript.
Javad Miri: Conceived the study; prepared and approved the final version of manuscript.
Leili Rostamniya: Writing first draft of manuscript; approved final version of the manuscript and response to the reviewers’ comment.
Competing Interests
The authors declare that they have no known competing financial interests or personal relationships that could have appeared to influence the work reported in this paper.
Use of AI Technology
During the preparation of this work, the authors used DeepSeek (Hangzhou DeepSeek Artificial Intelligence Basic Technology Research Co., Ltd.; Hangzhou, China) for language editing and paraphrasing of the sentences. After using this tool, the author(s) reviewed and edited the content as needed and take full responsibility for the content of the published article.