





Highlights
-
• Four hyperactivity/inattention trajectory classes were identified across childhood.
-
• Early multilingual exposure was associated with remitting over persistent or increasing trajectories.
-
• Associations persisted after adjustment for cognitive ability and socio-demographic/family factors.
-
• Findings are correlational and should be interpreted cautiously given the coarse exposure measure.
1. Introduction
1.1. Symptoms and developmental trajectories of hyperactivity and inattention
Hyperactivity and inattention are presentations of Attention deficit/hyperactivity disorder (ADHD), which is a lifelong neurodevelopmental condition with a global prevalence of ~7%–8% in children and adolescents (Ayano et al., Reference Ayano, Yohannes and Abraha2023; Salari et al., Reference Salari, Ghasemi, Abdoli, Rasoulpoor, Mohammadi, Shohaimi and Khaledi-Paveh2023);
however, underdiagnosis is common (Kooij et al., Reference Kooij, Bijlenga, Salerno, Jaeschke, Bitter, Balázs, Thome, Dom, Kasper, Nunes Filipe, Stes, Mohr, Leppämäki, Casas, Bobes, Mccarthy, Richarte, Kjems Philipsen, Pehlivanidis and Styr2019), especially among females (Mowlem et al., Reference Mowlem, Agnew-Blais, Taylor and Asherson2019).
Core symptoms of ADHD include inattention (difficulty paying attention to details, sustaining attention, following instructions and remembering things, poor organisational strategies, and a tendency to be easily distracted by external stimuli), hyperactivity (frequent fidgeting, excessive movement such as walking or running, and an inability to stay still), and impulsivity (poor self-control, impatience, excessive talking, making unintentional disruptions, and interrupting others). These symptoms form diagnostic specifications in the Diagnostic and Statistical Manual of Mental Disorders (American Psychiatric Association–APA, 2022).
Crucially, symptoms of ADHD are not limited to those with a formal diagnosis. Subthreshold symptoms are also highly prevalent in the general population and can significantly impair academic, social, and emotional functioning (Larsson et al., Reference Larsson, Dilshad, Lichtenstein and Barker2011; Murray et al., Reference Murray, Hall, Speyer, Carter, Mirman, Caye and Rohde2022; Norén Selinus et al., Reference Norén Selinus, Molero, Lichtenstein, Anckarsäter, Lundström, Bottai and Hellner Gumpert2016). These symptoms are increasingly understood as dimensional traits that follow diverse developmental trajectories across childhood (Murray et al., Reference Murray, Hall, Speyer, Carter, Mirman, Caye and Rohde2022), influenced by a range of cognitive, familial, and environmental factors.
The varied manifestation of ADHD symptoms is closely linked to specific cognitive impairments. For example, a meta-analysis showed that children with ADHD are characterised by deficits in multiple components of working memory, independently of the co-occurrence with other conditions and general intellectual ability (Martinussen et al., Reference Martinussen, Hayden, Hogg-Johnson and Tannock2005). Studies have further demonstrated that deficits in executive functions (EF), particularly working memory, can contribute to inattention and hyperactivity/impulsivity (Karalunas et al., Reference Karalunas, Gustafsson, Dieckmann, Tipsord, Mitchell and Nigg2017; Karr et al., Reference Karr, Rodriguez, Goh, Martel and Rast2022; Kofler et al., Reference Kofler, Irwin, Soto, Groves, Harmon and Sarver2019, Reference Kofler, Singh, Soto, Chan, Miller, Harmon and Spiegel2020). These cognitive impairments may also contribute to reading and writing difficulties (Adi-Japha et al., Reference Adi-Japha, Landau, Frenkel, Teicher, Gross-Tsur and Shalev2007; Cain & Bignell, Reference Cain and Bignell2014; Miller et al., Reference Miller, Keenan, Betjemann, Willcutt, Pennington and Olson2013). Moreover, individuals with ADHD often demonstrate reduced response selection capacity, limited selectivity in word recall (Castel et al., Reference Castel, Lee, Humphreys and Moore2011), and poorer pragmatic language abilities (Bishop & Baird, Reference Bishop and Baird2001; Staikova et al., Reference Staikova, Gomes, Tartter, McCabe and Halperin2013).
Beyond these academic and linguistic challenges, the experience of inattention, hyperactivity and impulsivity can also lead to considerable emotional and social difficulties. Specifically, these symptoms may contribute to emotional dysregulation (Shaw et al., Reference Shaw, Stringaris, Nigg and Leibenluft2014; Soler-Gutiérrez et al., Reference Soler-Gutiérrez, Pérez-González and Mayas2023), lower self-esteem (Harpin et al., Reference Harpin, Mazzone, Raynaud, Kahle and Hodgkins2016; Pedersen et al., Reference Pedersen, Edvardsen, Messina, Volden, Weyandt and Lundervold2024) and broader mental health difficulties (Pisula et al., Reference Pisula, Płatos, Banasiak, Danielewicz, Gosztyła, Podgórska-Jachnik, Pyszkowska, Rumińska and Winczura2024). Furthermore, due to challenges in automating behavioural rules and interpreting emotions (Cadesky et al., Reference Cadesky, Mota and Schachar2000), individuals experiencing hyperactivity and inattention may appear intolerant and aggressive (Barkley, Reference Barkley1997, Reference Barkley2006).
1.2. Hyperactivity/inattention symptoms, bilingualism, and cognition
Research directly examining the relation between multilingual exposure and ADHD-related symptoms remains limited. Evidence from children with neurodevelopmental conditions does not indicate that multilingual exposure is disadvantageous, while ADHD-specific findings on cognitive performance and behaviour remain limited and mixed (Köder et al., Reference Köder, Sharma, Cameron and Garraffa2022; Sharma et al., Reference Sharma, Katsos and Gibson2022; Uljarević et al., Reference Uljarević, Katsos, Hudry and Gibson2016). For example, Sharma et al. (Reference Sharma, Katsos and Gibson2022) found that bilingualism slightly reduced ADHD-like behaviours in primary school children with English as an additional language, whereas a meta-analysis by Uljarević et al. (Reference Uljarević, Katsos, Hudry and Gibson2016) on bilingualism and neurodevelopmental disorders confirmed that multilingual exposure was not disadvantageous, and a review by Köder et al. (Reference Köder, Sharma, Cameron and Garraffa2022) suggests no specific effect of bilingualism on cognitive performance or behaviour in individuals with ADHD. Recent work has also highlighted the need for more systematic research on the relation between additional-language experience and ADHD, given the heterogeneity of both language-learning contexts and symptom profiles (Silawi et al., Reference Silawi, Degani and Prior2025).
Regarding the potential cognitive benefits of multiple language exposure (MLE) more broadly, several studies have suggested positive effects on executive functioning (e.g., Bialystok, Reference Bialystok2017; Yang & Yang, Reference Yang and Yang2016), including improvements in inhibition (e.g., Bialystok et al., Reference Bialystok, Craik, Grady, Chau, Ishii, Gunji and Pantev2005; Poarch & van Hell, Reference Poarch and van Hell2012) and cognitive flexibility (e.g., Bialystok et al., Reference Bialystok, Craik, Klein and Viswanathan2004; Marzecová et al., Reference Marzecová, Bukowski, Correa, Boros, Lupiáñez and Wodniecka2013). However, this bilingual cognitive advantage appears to be modulated by factors such as vocabulary development and socioeconomic status (MacLeod et al., Reference MacLeod, Castellanos-Ryan, Parent, Jacques and Séguin2019; Naeem et al., Reference Naeem, Filippi, Periche-Tomas, Papageorgiou and Bright2018). More recent meta-analyses and reviews confirm the limited effect of bilingualism on EF (see, e.g., Giovannoli et al., Reference Giovannoli, Martella, Federico, Pirchio and Casagrande2020; Lowe et al., Reference Lowe, Cho, Goldsmith and Morton2021).
1.3. The current study
While research on hyperactivity and inattention is abundant, little is known about the developmental trajectories of these symptoms across childhood, particularly in the context of environmental and familial factors that may modulate them over time. One such environmental factor, early MLE, remains significantly understudied. Thus, this study examines the association between early MLE and hyperactivity/inattention trajectories from early childhood into pre-adolescence. Given the rising multilingual demographics globally, understanding how MLE affects child behavioural development not only fills a critical gap in the literature but also motivates more precise, mechanism-focused research using richer language-exposure measures and multi-informant hyperactivity/inattention outcomes in relation to ADHD. To this end, the current study replicates established models of hyperactivity/inattention trajectories, applying them within a multilingual context, leveraging data from the MCS, the UK’s most recent and largest birth cohort. The objectives of this research are threefold: to identify distinct classes of children aged 5 to 11 with varying trajectories of hyperactivity/inattention symptoms, to assess the influence of early MLE on these trajectories and to evaluate the persistence of this influence after accounting for differences in cognitive ability and socio-demographic characteristics. By doing so, the study aims to clarify whether early MLE is associated with differences in hyperactivity/inattention trajectory membership, and whether any association persists after sequential adjustment for cognitive ability and socio-demographic/family factors.
In the MCS, MLE is captured via a single parent-report indicator of whether any non-English language is spoken at home at age 3; this does not measure intensity, balance, stability, or the child’s active use/proficiency. We therefore interpret MLE here as a coarse marker of early home language context and do not draw mechanistic conclusions from this measure. We include early cognitive measures to reduce confounding and to test whether the association between MLE and symptom-trajectory membership persists after accounting for general cognitive ability. We do not assume these measures are causal drivers of hyperactivity and inattention symptoms; rather, they capture individual differences correlated with both early language context and behavioural development.
We asked the following research questions:
-
1. What are the distinct hyperactivity/inattention symptom trajectories in the general population from ages 5 to 11?
-
2. Is MLE at age 3 associated with varying hyperactivity/inattention symptom trajectories?
-
3. Does the association between MLE and hyperactivity/inattention trajectory membership persist after sequential adjustment for (i) cognitive ability and (ii) socio-demographic and family factors?
2. Methods
2.1. Sample
We used data from the 2nd through 5th assessment waves of the MCS, a population-based study of a total of 19,243 children born in the UK over a 12-month period starting on 1 September 2000 (Joshi & Fitzsimons, Reference Joshi and Fitzsimons2016). The children were approximately 3 years old at Sweep 2, and at Sweeps 3 through 5, they were around 5, 7 and 11 years old, respectively. The number of families who participated in these sweeps was 15,590, 15,246, 13,857, and 13,287. Ethical approval for the MCS sweeps used here was obtained from multiple NHS Multi-Centre Research Ethics Committees (MCS2 age 3: MREC/03/2/022; MCS3 age 5: 05/MRE02/46; MCS4 age 7: 07/MRE03/32; MCS5 age 11: 11/YH/0203). Parents provided informed consent prior to the interviews, and at age 11, children gave their assent.
The analytic sample of our study included 13,175 children. Only one child per family was included (that is, singletons and first-born twins or triplets). The sample was also restricted to participants with available data on the question assessing MLE at age 3, and with data available for at least one measure of hyperactivity/inattention at ages 5, 7 or 11 years. We also applied some additional exclusion criteria. First, we excluded 289 Welsh speakers, following the example of previously published studies, because there was the possibility that Welsh was the sole language children were exposed to (Clayden et al., Reference Clayden, Hope, Argyri, Goksan, Stefani, Wei and Liegeois2023). We also excluded 599 cohort members whose parents reported that a doctor had ascertained a diagnosis of autism spectrum disorder (ASD) or Asperger’s for the cohort member, because these are known to impact cognitive and behavioural development (Visser et al., Reference Visser, Rommelse, Greven and Buitelaar2016) and share similar symptoms (Hours et al., Reference Hours, Recasens and Baleyte2022). We also excluded children with a reported ADHD diagnosis to focus on population-level variation in symptom trajectories in non-clinically ascertained children and to reduce heterogeneity introduced by diagnosis-related pathways (e.g., treatment, service contact, differential reporting). Including clinically diagnosed children would likely alter the latent class structure, as diagnosis is associated with distinct symptom distributions and developmental courses, thereby shifting the focus to a mixed clinical–population model addressing a different research question. We make this scope limitation explicit and note that sensitivity analyses including diagnosed children would be informative but would require re-estimation of the trajectory model and conceptual reframing.
2.2. Measures
We derived a measure of MLE at age 3 using parent-reported information on whether a non-English language was spoken at home (see Appendix A.1 for item wording). If a parent reported the use of a non-English language, the child was considered to have exposure to additional language(s), as exposure to English was assumed to be implicit.
Hyperactivity/inattention symptoms were measured using five items of the parent-reported Strengths and Difficulties Questionnaire (SDQ) at ages 5, 7 and 11 years (see Appendix A.2 for item wording). The SDQ is a short, psychometrically valid and widely used behavioural screening tool (Goodman, Reference Goodman1997). Scores on the hyperactivity/inattention scale range between 0 and 10, with higher scores indicating higher levels or more severe symptoms of hyperactivity/inattention.
Cognitive ability at cohort members’ age 5 was assessed with three scales from the British Ability Scales Second Edition (BAS II; Elliott et al., Reference Elliott, Smith and McCulloch1996): Naming Vocabulary, Pattern Construction (measuring spatial problem-solving), and Picture Similarities (measuring non-verbal reasoning). As these assessments were administered as part of the MCS protocol, we relied on the standardised scores available in the dataset.
We also controlled for important individual- and family-level early predictors of behaviour problems and cognitive ability in children. These included biological sex (male/female), maternal education (university degree or not), family structure [living with both biological parents (henceforth referred to as nuclear families) or not], sibship size (0, 1, ≥2 siblings), and socioeconomic status (household income above or below 60% median national income obtained from the Organisation for Economic Co-operation and Development (OECD)).
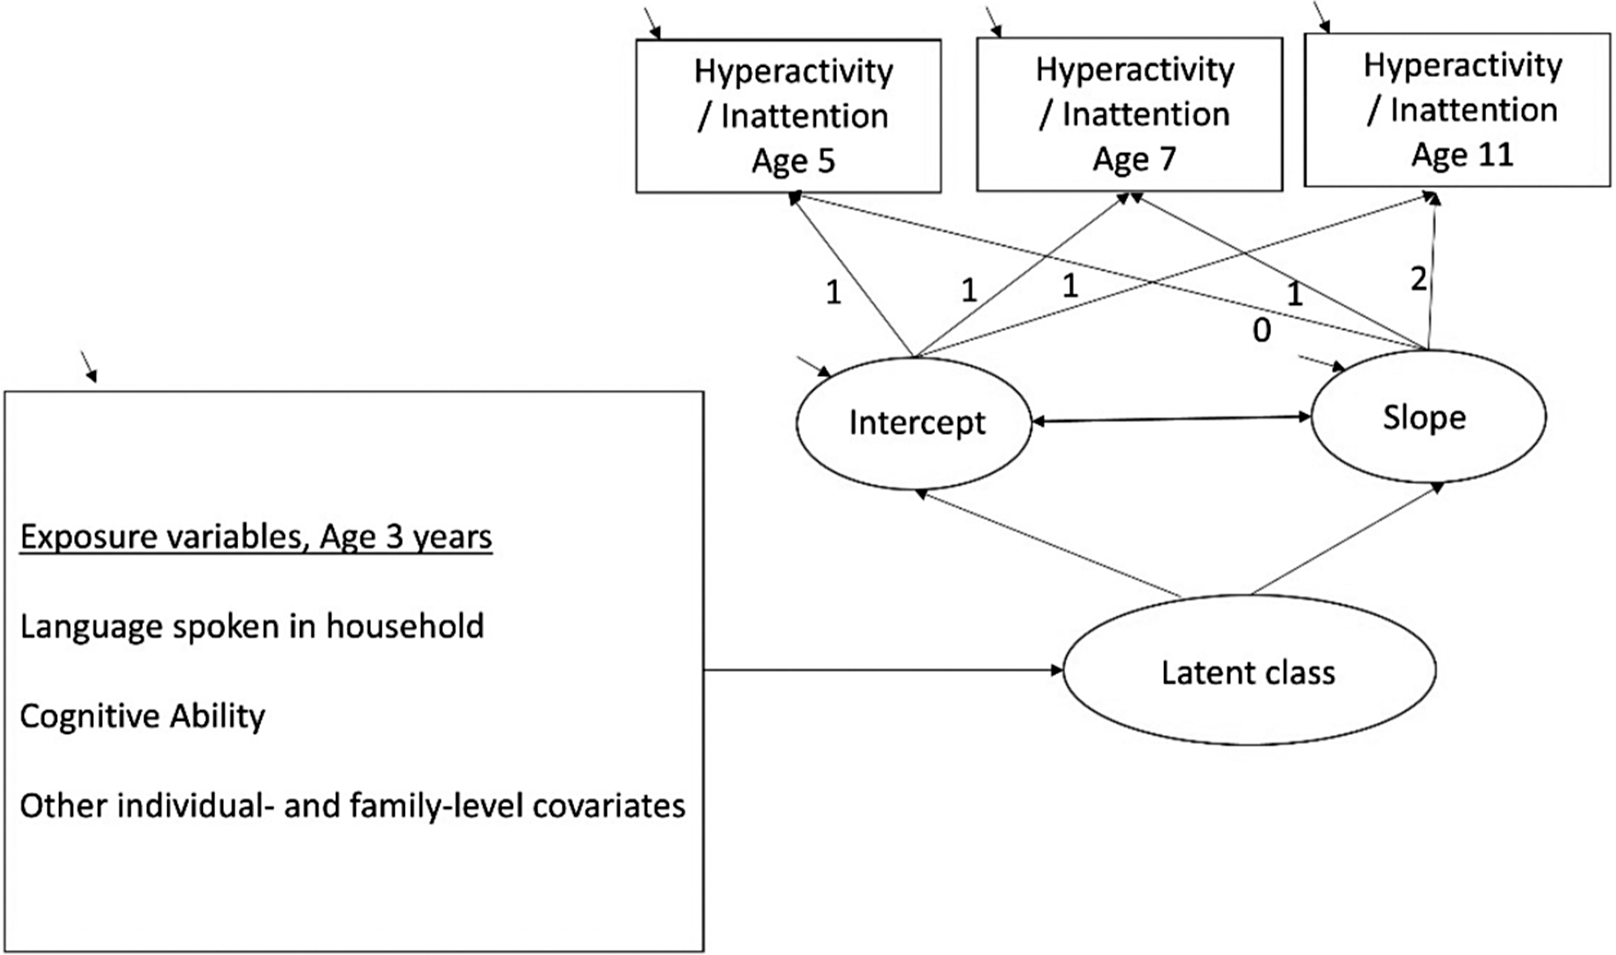
2.2.1. Summary of study variables (mapped to Figure 1)
The outcome was parent-reported hyperactivity/inattention symptoms (SDQ) measured at ages 5, 7 and 11 and modelled using growth mixture models. The primary exposure was early MLE at age 3 (any non-English language spoken at home vs English only). Cognitive ability at age 5 (BAS II Naming Vocabulary, Pattern Construction, Picture Similarities) was examined as an additional exposure block in adjusted models. The following covariates were included as early individual and family-level predictors: biological sex, maternal education, family structure, sibship size, and household income (above vs below 60% national median). Models A–C are defined in Section 2.3 and are illustrated in Figure 1.
Overview of the analytic approach. Hyperactivity/inattention symptoms (SDQ) measured at ages 5, 7 and 11 years were modelled using growth mixture modelling (GMM) to estimate distinct developmental trajectory classes. Class membership was then used as the outcome in a series of multinomial regressions (manual 3-step approach). Model A included MLE as a predictor of class membership. Model B additionally adjusted for cognitive ability at age 5 (BAS II Naming Vocabulary, Pattern Construction, Picture Similarities). Model C further adjusted for covariates, including biological sex, maternal education, family structure, sibship size, and household income.

Figure 1. Long description
A structural equation model diagram organized into three vertical levels and a left-hand predictor block.
At the top level, three rectangular boxes represent observed variables: Hyperactivity forward slash Inattention Age 5, Hyperactivity forward slash Inattention Age 7, and Hyperactivity forward slash Inattention Age 11.
In the middle level, two ovals represent latent growth factors: Intercept and Slope.
* The Intercept oval has three upward arrows pointing to each of the age-based boxes, each labeled with the number 1.
* The Slope oval has three upward arrows pointing to the age-based boxes. The arrow to Age 5 is labeled 0, the arrow to Age 7 is labeled 1, and the arrow to Age 11 is labeled 2.
* A double-headed horizontal arrow connects Intercept and Slope, indicating a correlation.
At the bottom level, an oval labeled Latent class receives downward-pointing arrows from both the Intercept and Slope ovals.
On the left side, a large rectangular box contains the heading Exposure variables, Age 3 years. Below the heading are three bulleted items: Language spoken in household, Cognitive Ability, and Other individual- and family-level covariates. A single horizontal arrow points from this box to the Latent class oval.
2.3. Statistical analysis
The analysis proceeded in three main stages. First, we examined the baseline characteristics of the analytic sample. Next, we sought to identify classes of children who followed similar developmental trajectories of hyperactivity between ages 5 and 11. For this purpose, we used growth mixture models (GMM), an extension of latent class analysis where the latent class indicators are the growth parameters, namely the intercept (scores at baseline) and the slope (rate of change) of a prospectively assessed outcome (in our case, hyperactivity/inattention symptoms measured at ages 5, 7 and 11 years). Hyperactivity/inattention scores were centred at age 5, and timepoints were specified based on the distance between assessments. Class assignment was based on posterior probabilities, with each participant classified into the class for which they had the highest posterior probability of belonging.
We estimated models with 1 to 6 classes and compared model fit using five goodness-of-fit indices: a) the Bayesian Information Criterion (BIC; lower values indicate better model fit); b) the Sample-Size Adjusted BIC (SSA-BIC; lower values indicate better model fit); c) the Akaike Information Criterion (AIC; lower values indicate better model fit); d) the entropy of each model (values ≥0.80 indicate little ambiguity in class allocation); and e) the Vuong-Lo–Mendell–Rubin (VLMR) likelihood ratio test, which compares the fit of two adjacent models with K and K-1 classes (p-values <0.05 indicate a significantly better fit of the model with K classes) (Jung & Wickrama, Reference Jung and Wickrama2008). To avoid model convergence to local maxima, we increased the number of starts (100 random sets of starting values and 20 optimisations in the final stage).
After identifying the best-fitting solution, we used the manual 3-step procedure to assess the predictive ability of the main exposure variables (MLE and cognitive outcomes) as well as covariates for class membership (Asparouhov & Muthén, Reference Asparouhov and Muthén2014; Wickrama et al., Reference Wickrama, Lee, O’Neal and Lorenz2016). This approach operates on the premise that, after identifying the best-fitting class solution, each cohort member is classified based on the latent class posterior distributions, creating a latent class indicator variable that accounts for misclassification error by fixing the class means using logit values from Step 1 (Step 2). In the final step (Step 3), we included each exposure variable successively to calculate crude regression estimates of the exposure variables and covariates for class membership in multinomial regressions. Figure 1 illustrates a simplified version of the final model we estimated.
We introduced predictors successively to test whether MLE is associated with class membership in an unadjusted model (Model A), after adjusting for cognitive ability at age 5 (Model B), and after additionally adjusting for socio-demographic and family covariates (Model C; biological sex, maternal education, family structure, sibship size, and household income). We also re-ran Model C, including multiplicative interaction terms between MLE and each cognitive ability score to test moderation. Due to the complexity of Step 3 models, Monte Carlo integration was employed to approximate integrals using random sampling methods.
All analyses were conducted using the maximum likelihood estimator with robust standard errors (MLR), which can handle skewed data distributions. To address missing data in the exposure and outcome variables, we applied Full Information Maximum Likelihood (FIML), which estimates parameters using all available information within the analytic model and is superior to other methods for handling missing data. We accounted for the MCS sampling design by controlling for the survey stratum, reflecting the cohort’s disproportionate stratified sampling. Attrition and differential non-response across sweeps were addressed using study-specific survey weights to improve representativeness of estimates. Analyses were performed using Stata SE 18.0 (StataCorp, 2023) and Mplus 7.4 (Muthén & Muthén, Reference Muthén and Muthén2015). The MCS data are available through the UK Data Service (UKDS; https://ukdataservice.ac.uk/), and the analysis code used in this study is available upon request from the corresponding author.
3. Results
Table 1 summarises the baseline descriptive statistics of the analytic sample. The analytic sample (N = 13,175; 50.1% female) comprised predominantly monolingual children (86.8%) from households above the 60% median-income threshold (68.1%). At age 3 years, the majority lived in nuclear families (81.2%), had at least one sibling (74.7%), while 18.5% of their mothers reported having a university degree or higher.
Descriptive statistics of the analytic sample (N = 13,175 members of the MCS; unweighted data) at cohort members’ age 3 years unless otherwise specified

Table 1. Long description
The table is divided into two main sections.
Section 1: Continuous variables.
- Hyperactivity/Inattention at Age 5: Mean 3.11, Standard deviation 2.25, 12.41 percent missing data.
- Hyperactivity/Inattention at Age 7: Mean 3.16, Standard deviation 2.38, 17.59 percent missing data.
- Hyperactivity/Inattention at Age 11: Mean 2.90, Standard deviation 2.29, 20.02 percent missing data.
- Cognitive ability at Age 5: T-score naming vocabulary (Mean 54.20, SD 11.49, 4.74 percent missing), T-score picture similarities (Mean 55.49, SD 10.63, 4.93 percent missing), and T-score pattern construction (Mean 50.38, SD 10.28, 4.94 percent missing).
Section 2: Categorical variables (N and percentage).
- Sex: Male (6,569, 49.86 percent), Female (6,606, 50.14 percent), 0 percent missing.
- Child’s ethnicity: White (11,025, 83.68 percent), Non-white (2,081, 15.80 percent), 0.52 percent missing.
- Poverty: Above 60 percent O E C D equivalised income (8,945, 68.09 percent), Below 60 percent O E C D equivalised income (4,192, 31.91 percent), 0.29 percent missing.
- Maternal qualification: Without university degree (10,268, 81.46 percent), University degree or higher (2,337, 18.54 percent), 4.33 percent missing.
- Family structure: Nuclear family (10,678, 81.20 percent), Non-nuclear family (2,472, 18.80 percent), 0.19 percent missing.
- Number of siblings: No siblings (3,324, 25.23 percent), One sibling (5,953, 45.18 percent), Two or more siblings (3,898, 29.59 percent), 0 percent missing.
- Language spoken in household: English only (11,436, 86.80 percent), English plus other languages (1,739, 13.20 percent), 0 percent missing.
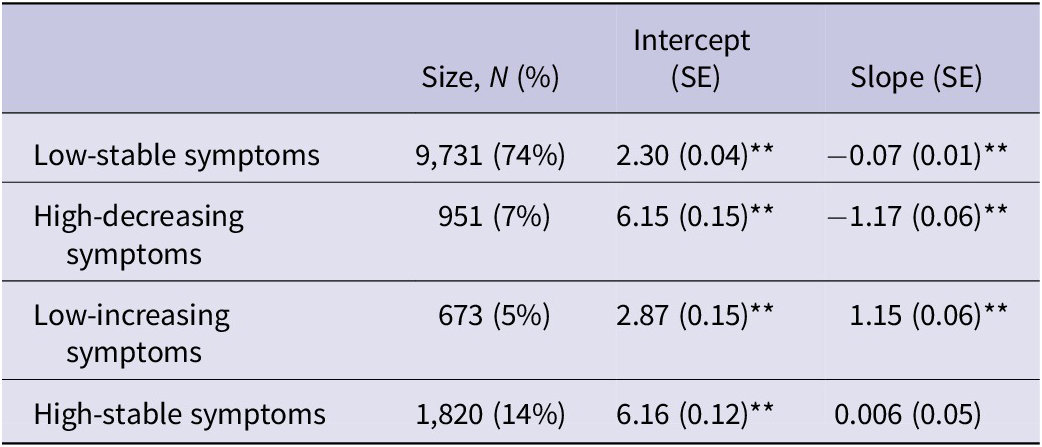
The results of the GMM identified the 4-class solution as being the best-fitting one to the data. While the AIC, BIC, and SSA-BIC values kept decreasing for higher-class solutions, the VLMR p-value suggested that extraction of more than four classes did not result in a significantly better fit. Hence, the four-class solution was selected for further interpretation and analysis. Entropy indicated moderate classification precision (0.68), suggesting some uncertainty in individual class assignment. Because class membership in mixture models is inherently probabilistic, downstream class-prediction results should be interpreted as associations with likely trajectory membership rather than deterministic group differences. To account for classification uncertainty when estimating associations with class membership, we used the manual three-step approach; however, some uncertainty remains and may attenuate observed associations. Table 2 summarises fit indices for competing growth mixture models and supports the selection of the four-class solution. Table 3 presents class sizes and the mean growth parameters (intercept and slope) that characterise symptom level at baseline and change over time for each class.
Fit indices of competing 1- to 6-class growth mixture models for hyperactivity/inattention symptom trajectories measured at ages 5, 7 and 11 years in 13,175 members of the MCS

Table 2. Long description
The table contains 12 rows of data across 6 model columns.
Fit Indices:
* B I C: Values decrease from 135967.32 (1 class) to 133553.58 (6 classes).
* A I C: Values decrease from 135907.21 (1 class) to 133381.40 (6 classes).
* S S A - B I C: Values decrease from 135941.79 (1 class) to 133480.49 (6 classes).
* Entropy: Ranges from 0.65 to 0.68 for models with 2 or more classes.
* V L M R p-value: Significant (less than .001 to .002) for 2, 3, and 4 classes, but non-significant for 5 classes (0.12) and 6 classes (0.34).
Class Sizes (n and percentage):
* 1 class: 13175 (100 percent).
* 2 classes: Class 1 (21 percent), Class 2 (79 percent).
* 3 classes: Class 1 (14 percent), Class 2 (10 percent), Class 3 (76 percent).
* 4 classes: Class 1 (14 percent), Class 2 (74 percent), Class 3 (5 percent), Class 4 (7 percent).
* 5 classes: Class 1 (62 percent), Class 2 (22 percent), Class 3 (5 percent), Class 4 (5 percent), Class 5 (6 percent).
* 6 classes: Class 1 (32 percent), Class 2 (42 percent), Class 3 (13 percent), Class 4 (5 percent), Class 5 (5 percent), Class 6 (3 percent).
Note: Shaded cells indicate selected model; AIC, Akaike Information criterion; BIC, Bayesian information criterion; SSA-BIC, Sample size adjusted BIC; VLMR p-value, Vuong-Lo–Mendell–Rubin Likelihood ratio test for K versus K-1 classes. Modal class counts are subject to rounding at tied posterior probabilities and may not sum exactly to N.
Class size and mean growth parameter (intercept and slope) estimates of linear hyperactivity/inattention symptom trajectories in the four classes extracted using growth mixture modelling in 13,175 participants of the MCS

Table 3. Long description
The table consists of four columns: Trajectory Class, Size N (percentage), Intercept (S E), and Slope (S E).
* Low-stable symptoms: 9,731 participants (74 percent). Intercept is 2.30 (0.04) with p less than .01. Slope is minus 0.07 (0.01) with p less than .01.
* High-decreasing symptoms: 951 participants (7 percent). Intercept is 6.15 (0.15) with p less than .01. Slope is minus 1.17 (0.06) with p less than .01.
* Low-increasing symptoms: 673 participants (5 percent). Intercept is 2.87 (0.15) with p less than .01. Slope is 1.15 (0.06) with p less than .01.
* High-stable symptoms: 1,820 participants (14 percent). Intercept is 6.16 (0.12) with p less than .01. Slope is 0.006 (0.05).
**p < .01.
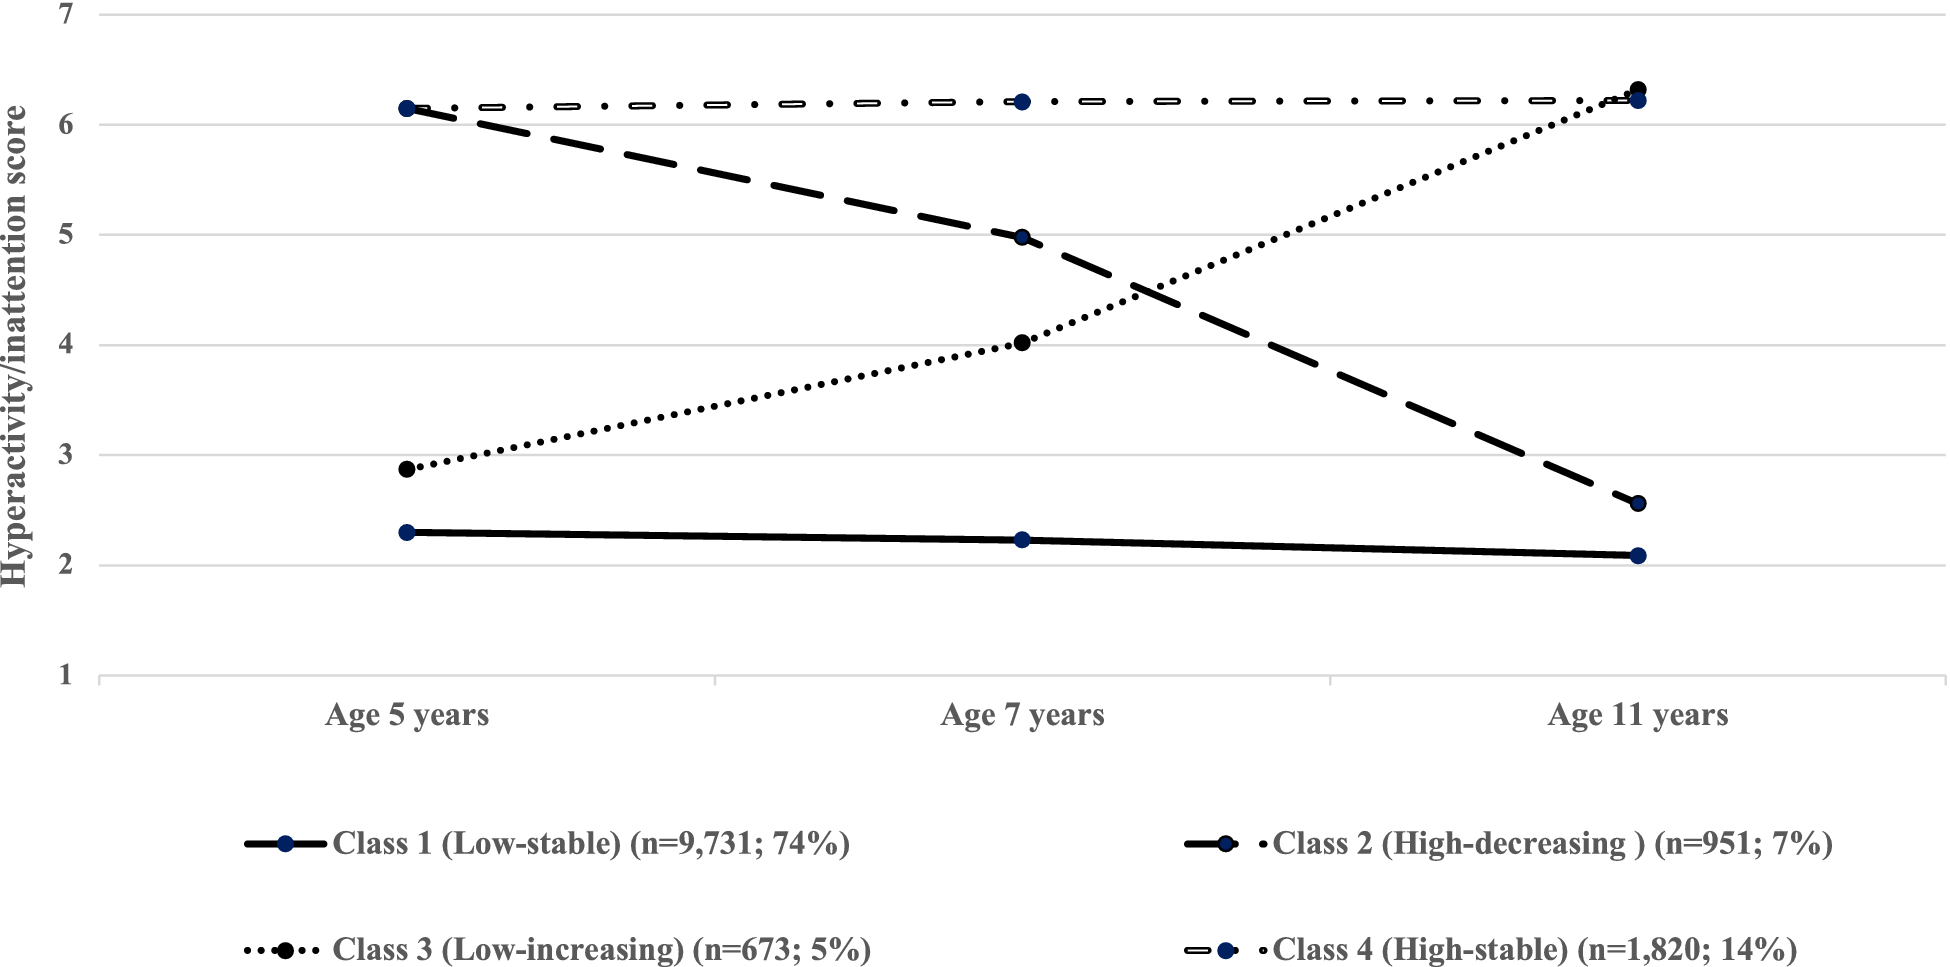
The first and largest class, comprising nearly three-quarters of the total sample (n = 9,731, 74%), was characterised by a low intercept (M = 2.30; SE = 0.04) and a marginally decreasing slope (M = −0.07, SE = 0.01), suggesting a low and relatively stable level of hyperactivity symptoms across the study period. Children with a higher probability of belonging in this class were thus labelled the low-stable symptoms group. The second class, labelled the high-decreasing symptoms group, comprised 7% (n = 951) of children in the analytic sample, who were characterised by a high average intercept value (M = 6.15, SE = 0.15), yet a strong negative slope (M = −1.17, SE = 0.06), suggesting a rapid reduction of hyperactivity symptoms by age 11 years. The third class (n = 673; 5%) included children characterised by relatively low average levels of hyperactivity at age 5 (M = 2.87, SE = 0.15) whose symptoms increased at a fast pace (M = 1.15, SE = 0.06) by late childhood. Children in this class were thus termed the low-increasing symptoms group. The fourth class (n = 1,820; 14%) comprised children with high levels of hyperactivity symptoms (M = 6.16, SE = 0.12), which remained stable throughout the study period as indicated by a non-significant slope value of their respective trajectory (M = 0.01, SE = 0.05). This class was referred to as the high-stable symptoms group. Figure 2 illustrates the four classes extracted by the GMM.
Hyperactivity/inattention trajectories in the four classes derived using growth mixture modelling for hyperactivity/inattention symptoms measured at ages 5, 7 and 11 years in 13,175 members of the MCS.

Figure 2. Long description
The Y-axis represents Hyperactivity/inattention score ranging from 1 to 7. The X-axis represents three time points: Age 5 years, Age 7 years, and Age 11 years. Four distinct trajectories are plotted:
* Class 1 (Low-stable, n = 9,731, 74%): Represented by a solid line with circular markers. It starts at a score of approximately 2.3 at age 5 and remains nearly flat, ending at 2.1 at age 11.
* Class 2 (High-decreasing, n = 951, 7%): Represented by a long-dashed line. It starts high at a score of 6.1 at age 5, drops to 5.0 at age 7, and continues a steep decline to 2.6 at age 11.
* Class 3 (Low-increasing, n = 673, 5%): Represented by a dotted line. It starts at a score of 2.9 at age 5, increases to 4.0 at age 7, and rises sharply to 6.3 at age 11.
* Class 4 (High-stable, n = 1,820, 14%): Represented by a dash-dot line. It starts at 6.1 at age 5 and remains stable at a high level, ending at 6.2 at age 11.
Next, we examined whether MLE was predictive of class membership before adjustment (Model A), after adjustment for cognitive ability (Model B), and after further adjustment for socio-demographic/family covariates (Model C). The results are summarised in Table 4. The multinomial regression estimates indicate that, in the unadjusted model (Model A), MLE was associated with lower odds of belonging to the low-increasing class relative to the high-decreasing class (b = −0.73, SE = 0.28). After adjustment for cognitive ability (Model B), MLE remained associated with lower odds of low-increasing class membership (b = −0.73, SE = 0.31), and an association with lower odds of high-stable class membership also emerged (b = −0.78, SE = 0.33). After full adjustment (Model C), MLE remained associated with lower odds of membership in both the low-increasing (b = −0.74, SE = 0.32) and the high-stable (b = −0.73, SE = 0.36) classes relative to the high-decreasing class, although the latter estimate was close to the conventional significance threshold (p = .04). MLE was not significantly associated with membership in the largest, low-stable class relative to the high-decreasing reference class in any model. Expressed as odds ratios, the fully adjusted estimates correspond to OR = 0.48, 95% CI [0.25, 0.89] for the low-increasing comparison and OR = 0.48, 95% CI [0.24,0.98] for the high-stable comparison, indicating lower odds of membership in each of these classes relative to the high-decreasing trajectory. It should be noted that these comparisons concern relatively small trajectory classes, whereas the largest class, comprising children with low-stable symptoms (74%), showed no association with MLE.
Multinomial regression results predicting trajectory class membership from early multiple language exposure (MLE), with high-decreasing symptoms as the reference class

Table 4. Long description
The table presents unstandardized log-odds coefficients with standard errors for three symptom trajectory classes relative to a high-decreasing reference class.
1. Low-stable symptoms:
- M L E: Model A -0.35 (0.21), Model B -0.05 (0.23), Model C -0.09 (0.25).
- Verbal ability: Model B 0.03 (0.01) p < .01, Model C 0.02 (0.01) p < .05.
- Visuospatial ability: Model B 0.02 (0.01) p < .05.
- Financial situation: Model C -0.49 (0.15) p < .01.
- Maternal education: Model C 0.75 (0.23) p < .01.
- Number of siblings: Model C 0.27 (0.09) p < .01.
2. Low-increasing symptoms:
- M L E: Model A -0.73 (0.28) p < .01, Model B -0.73 (0.31) p < .05, Model C -0.74 (0.32) p < .05.
- Visuospatial ability: Model B -0.03 (0.01) p < .05, Model C -0.03 (0.01) p < .01.
3. High-stable symptoms:
- M L E: Model B -0.78 (0.33) p < .05, Model C -0.73 (0.36) p < .05.
- Visuospatial ability: Model B -0.02 (0.01) p < .05.
- Sex (Female): Model C -0.64 (0.21) p < .01.
Model A includes M L E only. Model B adds cognitive ability. Model C adds individual and family covariates.
*p < .05; **p < .01.
Note: Values are unstandardised log-odds coefficients (b) with standard errors in parentheses. All comparisons are relative to the high-decreasing symptoms trajectory, which was specified as the reference category. Model A includes MLE as the only predictor of class membership; Model B additionally adjusts for cognitive ability at age 5; Model C further adjusts for individual- and family-level covariates.
As a final step, we tested whether any of the three cognitive abilities tested in the MCS at age 5 act as moderators for the relationship between MLE and class membership. We found no evidence of moderation, as none of the multiplicative interaction terms were statistically significant predictors of class membership in the adjusted models.
4. Discussion
In this study, we explored the longitudinal impact of early MLE on hyperactivity/inattention symptom trajectories from early childhood through pre-adolescence. Using data from the MCS, a representative UK cohort, we analysed symptom trajectories of 13,175 children through growth mixture modelling, identifying four distinct classes: low-stable, low-increasing, high-decreasing, and high-stable symptom groups.
Beyond overall symptom level and change, an important question is whether the hyperactivity/inattention symptoms related to ADHD may be expressed differently across languages and communicative contexts. This possibility is consistent with recent work showing that hyperactive/impulsive communicative behaviours commonly associated with ADHD, such as interrupting others, talking excessively, or difficulties with turn-taking, can be less pronounced when individuals speak a second or third language compared to their first, whereas attentional/pragmatic difficulties may be more evident when proficiency is lower (Köder et al., Reference Köder, Rummelhoff and Garraffa2024a, Reference Köder, Rummelhoff and Garraffa2024b). Although our outcomes derive from parent-rated SDQ hyperactivity/inattention rather than language-specific behavioural observation, these convergent findings highlight that multilingual experience may interact with when and how symptoms become visible in early life.
Our analysis indicated that early MLE at age 3 was associated with an increased likelihood of belonging to the high-decreasing compared to both the low-increasing and the high-stable symptom classes, suggesting that MLE is associated with trajectory membership characterised by symptom reduction over time. These associations persisted after adjusting for cognitive abilities and socio-demographic factors. Notably, the high-decreasing and high-stable classes share similarly elevated symptom levels at age 5 and differ primarily in their subsequent course; the finding that children with MLE were more likely to follow the remitting rather than the persistent trajectory is therefore consistent with an association between early language context and symptom change over time, rather than with initial symptom level. The comparison with the low-increasing class, whose members start with low symptoms that escalate, points in the same direction, although this contrast reflects differences in both initial level and course.
Although MLE may co-occur with everyday demands on attention and behavioural regulation, the present study cannot identify mechanisms. The broader literature on bilingualism and executive control is mixed and often context-dependent, and we did not test executive-function pathways (or self-regulation) as mediators of the association between MLE and symptom-trajectory membership. Accordingly, we interpret our findings as a population-level association that motivates future work using richer exposure measures and designs that can directly evaluate candidate pathways (e.g., executive control, language-context effects on symptom visibility, or reporting differences across settings). Importantly, our study does not test mechanistic pathways: MLE is measured as a coarse household indicator at age 3, and the outcome is parent-reported hyperactivity/inattention. Accordingly, the present findings should be interpreted as modest associations with trajectory membership rather than evidence for a causal or “protective” effect.
The results are also broadly consistent with evidence that socio-demographic and family factors such as socioeconomic disadvantage and family composition are associated with ADHD-like behaviours over development (Flouri et al., Reference Flouri, Papachristou, Midouhas, Joshi, Ploubidis and Lewis2018; Papachristou & Flouri, Reference Papachristou and Flouri2020). In our analyses, the association between MLE and trajectory membership persisted after adjustment for these measured background factors, suggesting that the observed pattern is not solely attributable to the covariates included in Model C, while remaining vulnerable to residual confounding.
These findings are consistent with the possibility that multilingualism contributes not only to linguistic development but also to broader neurocognitive benefits. However, mechanisms remain untested here. Given that ADHD symptoms often coincide with EF deficits, such as poor working memory and inhibition (Bialystok et al., Reference Bialystok, Craik, Grady, Chau, Ishii, Gunji and Pantev2005; Poarch & van Hell, Reference Poarch and van Hell2012), it is possible (but untested here) that aspects of self-regulation could contribute to these associations observed in children with early MLE, which may help explain the trajectory toward symptom improvement. It is worth noting, however, that the majority of multilingual participants in our study belonged to households below the 60% OECD equivalised income threshold, which may indicate a complex interaction between MLE, socioeconomic advantages, and ADHD-like symptom trajectories. Future studies should aim to disentangle these overlapping factors to better isolate the specific impact of multilingualism on EF and attentional control. Nonetheless, the finding that children with MLE were more likely to follow a decreasing, rather than an increasing or persistently elevated, symptom trajectory throughout childhood lends strength to the robustness of our findings, especially considering that children from more socioeconomically disadvantaged backgrounds are typically at greater risk for elevated hyperactivity/inattention symptom levels (Russell et al., Reference Russell, Ford, Williams and Russell2016).
Another important consideration is the absence of a moderating effect of cognitive ability on the relationship between MLE and symptom trajectories. This lack of moderation aligns with studies suggesting that while multilingual exposure may support EF development, it does not necessarily enhance domain-specific cognitive abilities like vocabulary or spatial problem-solving (Giovannoli et al., Reference Giovannoli, Martella, Federico, Pirchio and Casagrande2020). Thus, the association of MLE appears to be more pronounced in regulating behaviours rather than improving general cognitive ability, underscoring the specificity of MLE’s influence on attentional and behavioural control.
4.1. Limitations and future directions
While this study offers valuable insights, it is important to acknowledge several limitations. First, the reliance on parental reports for MLE and behavioural assessments introduces potential bias, as parental perceptions of language use and symptom severity may vary. In the MCS, MLE is indexed by a single binary parent report at age 3 (any non-English language spoken at home). This measure cannot differentiate between qualitatively different multilingual trajectories (e.g., simultaneous vs sequential exposure), nor does it quantify intensity, balance, stability, dominance, or children’s active use/proficiency. Consequently, the exposed group is heterogeneous, and the observed associations should be interpreted as broad, population-level correlations rather than evidence for specific mechanisms.
Second, class membership is probabilistic. The selected growth-mixture solution showed only moderate classification precision (see entropy in Table 2), and although we used a manual 3-step approach that incorporates classification uncertainty when estimating associations with class membership, some residual uncertainty remains and may attenuate associations. Third, observed effects are modest in magnitude and arise from an observational design; residual confounding (e.g., unmeasured familial, cultural, genetic, and contextual factors) and shared-method variance cannot be ruled out. Fourth, the association between MLE and high-stable class membership was not significant in the unadjusted model and emerged only after adjustment for cognitive ability, consistent with suppression by the correlation between MLE and the cognitive measures; however, if early cognitive scores partly reflect consequences of multilingual exposure rather than confounders, adjusted estimates should be interpreted with additional caution. Additionally, our study excluded children diagnosed with ADHD, ASD, or other neurodevelopmental conditions, which limits the generalisability of these findings to the broader population with ADHD-like behaviours. Because clinically diagnosed children are likely to show markedly different symptom distributions and developmental patterns, their inclusion would likely alter the latent class solution itself and address a conceptually distinct clinical–population research question.
Future work should test whether the observed associations depend on specific properties of multiple language experience that are not captured here, including the timing, intensity, balance, and stability of exposure, as well as children’s proficiency and active use over time. Studies would also benefit from combining longitudinal exposure measures with multi-informant outcomes (e.g., parent, teacher, and, where age-appropriate, self-report), and from examining symptom domains separately (inattention vs hyperactivity/impulsivity) and, where possible, context-specific manifestations (e.g., classroom behaviour vs conversational regulation). Finally, replication in clinically assessed samples and designs that can better address residual confounding (e.g., richer family/educational covariates, genetically informed or quasi-experimental approaches) will be important before drawing applied conclusions.
5. Conclusion
This study provides population-level longitudinal evidence that early household MLE was associated with hyperactivity/inattention symptom-trajectory membership from ages 5 to 11. Specifically, children with early MLE had lower odds of belonging to the low-increasing and high-stable symptom trajectories than to the high-decreasing symptom trajectory, after adjustment for the cognitive and socio-demographic/family factors included in the models. Given the observational design, the coarse parent-reported measure of early language exposure, and the reliance on parent-reported symptoms, these findings should be interpreted cautiously and do not establish causal mechanisms. Future research should use richer longitudinal measures of language experience and multi-informant assessments of hyperactivity/inattention symptoms to clarify the nature and robustness of this association.
Data availability statement
The data that support the findings of this study are available from the UK Data Service (Centre for Longitudinal Studies, 2019; https://ukdataservice.ac.uk/). The Millennium Cohort Study data are third-party data, openly available to registered users under the UK Data Service End User Licence; the authors accessed the data under this licence and hold no special access privileges that other researchers would not also be able to obtain. The analysis code supporting the findings of this study is available from the corresponding author upon reasonable request.
Competing interest
The authors declare none.
A. Appendix A. Item wording
A.1. Multiple language exposure (age 3)
Parents reported the languages spoken in the household using the following categories: “Yes – English only”; “Yes – mostly English, sometimes another language”; and “Yes – about half English and half another language.” For the purposes of the present analyses, this variable was recoded into a binary indicator of non-English language exposure. Households in which a language other than English was spoken either “sometimes” or “about half the time” were coded as 1 (non-English language exposure), whereas households reporting “English only” were coded as 0 (English only). Following Clayden et al. (Reference Clayden, Hope, Argyri, Goksan, Stefani, Wei and Liegeois2023), Welsh speakers were excluded from the analytic sample.
A.2. Hyperactivity/inattention (SDQ)
Parents rated the following items at ages 5, 7 and 11 on a 3-point scale (0 = Not true; 1 = Somewhat true; 2 = Certainly true): “Restless, overactive, cannot stay still for long”; “Constantly fidgeting or squirming”; “Easily distracted, concentration wanders”; “Thinks things out before acting” (reverse-scored); “Sees tasks through to the end, good attention span” (reverse-scored).




 Open access

