Tokyo Japanese is a pitch-accent language, in which a word is either accented on a particular syllable or unaccented. Pitch patterns may be lexically contrastive as in the following examples of the 1st-syllable accented, 2nd-syllable accented, and unaccented words: háchi “eight” – hachí “bowl” – hachi “bee.” Two major functions of the pitch accent are (a) a distinctive function, that is, signaling difference in lexical meaning, and (b) a culminative-delimitative function, that is, defining the phrase by signaling prominent units in a phrase (Beckman, Reference Beckman1986, pp. 11–44). It has been argued that in modern Tokyo Japanese the distinctive function of the accent is less important than the culminative-delimitative function (Beckman, Reference Beckman1986). The meaning of homophones may be distinguished easily in context. In addition, in many minimal pairs, one member is less frequent in speech than the other. For these reasons, along with the pedagogical traditions and time constraints in a second language classroom, learners of Japanese are almost never explicitly taught pitch patterns. As a result, even advanced learners of Japanese rarely acquire the pitch-accent contrasts (see Ayusawa, Reference Ayusawa2003, for the review of relevant studies).
Acquisition of pitch-accent contrasts, however, is important for second language learners of Japanese for several reasons. First, at the word level, approximately 13% of relatively short words (1-4-mora) are distinguished only by their accentual patterns, and all pattern types are equally distributed in high-familiarity words (Kitahara, Reference Kitahara2001). This suggests that the distinctive function of the pitch accent is not negligible. Second, research shows that native speakers of Tokyo Japanese do use pitch-accent information in spoken-word recognition (Cutler & Otake, Reference Cutler and Otake1999; Sekiguchi & Nakajima, Reference Sekiguchi and Nakajima1999). Third, at the phrase level, pitch patterns of words along with boundary and phrasal tones form larger prosodic units such as accentual phrases (Pierrehumbert & Beckman, Reference Pierrehumbert and Beckman1988; Venditti, Reference Venditti and Jun2005). If a learner of Japanese has not acquired lexical pitch patterns, then the prosody of larger units will also be distorted. Infelicitous word- or phrase-level prosody may be detrimental to speech intelligibility and processing (Ito & Speer, Reference Ito and Speer2008).
The goal of this study was to examine how adult nonnative listeners perceive Japanese pitch patterns when they are at the initial stage of learning, and whether they can improve in the perceptual identification of novel pitch patterns with training and feedback. The question of prosodic learning in speakers of a typologically different language is of linguistic and pedagogical interest, and this study was the first to examine it in a pitch-accent language using the high-variability training (HVT) paradigm.
ACQUISITION OF PITCH-ACCENT CONTRASTS BY ADULT LEARNERS
Japanese lexical pitch-accent contrasts and phrasal intonation are known to be challenging for learners of Japanese in both perception and production (Ayusawa, Reference Ayusawa2003). Specifically, American English learners tend to produce unaccented Japanese words as accented on the first syllable or on the penultimate syllable, which suggests a difficulty with the unaccented pitch pattern (Ueyama, Reference Ueyama2000). Perception errors reported in previous studies are quite different. Many of these studies used the Tokyo Japanese Accent Listening Test, in which listeners are asked to identify the accented mora in a word, if any (Arai, Reference Arai1997; Ayusawa, Reference Ayusawa2003; Hirata, Ayusawa, Nakagawa, & Odaka, Reference Hirata, Ayusawa, Nakagawa and Odaka1997; Nishinuma, Arai, & Ayusawa, Reference Nishinuma, Arai and Ayusawa1996). A common finding across these studies is that learners of Japanese identified the unaccented pattern with relatively higher accuracy than a variety of accented patterns, either in isolated or sentence-embedded words. It has been suggested that unaccented patterns are simpler, meaning that the presence of the accent is literally additional to the unaccented pattern, thus increasing the processing effort required by listeners (Nishinuma, Reference Nishinuma1997). This result, however, may also be explained by the nature of the task and by listener strategies. The chance of identifying the absence of the accent is 50% (accented and unaccented answer options), whereas the chance of identifying the location of the accent varies from 50% in three-syllable words (1st- or 2nd-syllable accented) to 20% in five-syllable words (1st-, 2nd-, 3rd-, 4th-, or 5th-syllable accented). Listeners may also choose not to mark the location of the accented mora if they are unsure. This last possibility alone would lead to the higher identification accuracy for the unaccented pitch pattern than for any of the accented patterns.
The Role of Similarity in Perceptual Learning
The notion of similarity is often invoked to explain why some nonnative sound categories are learned better than others. The theoretical assumption here is that listeners perceive nonnative sounds in relation to native sound categories (perceptual assimilation model: Best & Tyler, Reference Best, Tyler, Bohn and Munro2007; native language magnet model: Kuhl & Iverson, Reference Kuhl, Iverson and Strange1995). The degree of perceived similarity is used to predict the degree of perceptual assimilation, discrimination, and, ultimately, learning of nonnative sounds. The current theories of speech perception were originally developed for segments, but they have been applied to lexical tones as well (Francis, Ciocca, Ma, & Fenn, Reference Francis, Ciocca, Ma and Fenn2008; Hallé, Chang, & Best, Reference Hallé, Chang and Best2004; So & Best, Reference So and Best2010). The perceived similarity between native and nonnative prosodic categories has not been directly assessed in previous research, but it has been discussed on the basis of articulatory similarity, in terms of fundamental frequency (F0) contours. So and Best (Reference So and Best2010), for example, described selected Mandarin and Cantonese tones as similar to each other, and selected Mandarin tones and Japanese pitch patterns as similar with the exception of their temporal realization: one syllable in Mandarin versus at least two syllables in Japanese. In both examples, two languages with lexically contrastive F0 contours (i.e., the same distinctive function) are compared.
In contrast to the preceding examples, a similarity assessment between prosodic categories in two typologically different languages, such as Japanese and English, is complicated. Japanese lexical pitch patterns and English intonation patterns differ in the level at which F0 contours may be contrastive (word level in Japanese vs. phrase level in English) and in their function (signaling a difference in lexical meaning in Japanese, but not in English). Japanese lexical pitch patterns and English stress patterns, by contrast, may be viewed at the same word level but they differ in their acoustic-phonetic cues (Beckman, Reference Beckman1986). It has been suggested that English listeners may perceive lexical pitch patterns as (a) nonlinguistic melodic variations, (b) speech patterns evocative of native language patterns but uncategorizable, or (c) speech patterns evocative of native language patterns and categorizable (Hallé et al., 2004, pp. 416–418; So & Best, Reference So and Best2010, p. 289). In this study, the first possibility was ruled out for listeners because we explained to them that pitch patterns have a distinctive function in Japanese. The last possibility, of a perceptual assimilation between Japanese pitch patterns and English stress patterns, was considered, following previous work by Nishinuma that is discussed in the following text.
Nishinuma (Reference Nishinuma1997) used a comparison between Japanese pitch patterns and English stress patterns to explain the outcomes in his study. He suggested that the relatively high identification accuracy for Japanese 2nd-syllable accented words by English listeners was due to the similarity in the location of the F0 peak between these words and 2nd-syllable stressed words in English (e.g., tabémono “food” and appárently). The peak location criterion, however, fails to explain why the English listeners showed lower identification accuracy for the 1st- than the 2nd-syllable accented words in the same study (e.g., tabémono “food” and káre kara “from him”). The F0 peak location is similar in Japanese 1st-syllable accented words and English 1st-syllable stressed pattern (e.g., káre kara “from him” and cátegory). Thus, by Nishinuma’s logic, the patterns of the 1st-syllable accented words should be identified equally well, which was not the case. Note that F0 peak location is not the only element that makes F0 contours similar or dissimilar to one another. F0 contours of the Japanese lexical pitch patterns are described in detail in the following text.
Acoustic Cues to Japanese Lexical Pitch Patterns
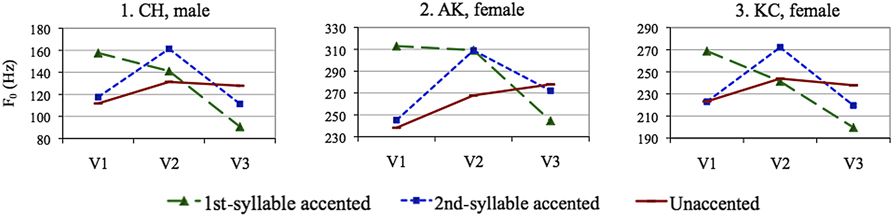
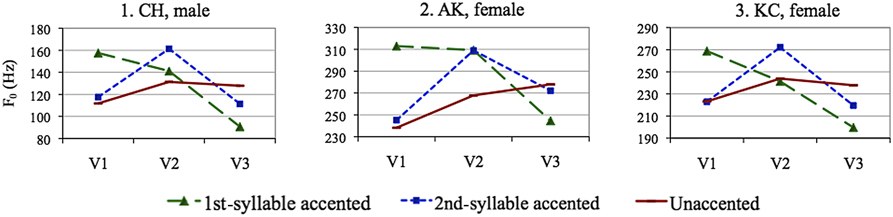
Pitch accent in Tokyo Japanese is a high-low accent, which is implemented as an F0 peak near the end of the accented mora followed by a steep F0 fall. This steep F0 fall is the fundamental acoustic correlate of the pitch accent in production and the primary acoustic cue to accent in perception (Pierrehumbert & Beckman, Reference Pierrehumbert and Beckman1988; Sugito, Reference Sugito1982a; Sugiyama, Reference Sugiyama2012; Venditti, Reference Venditti and Jun2005). In disyllabic words, the presence of the F0 fall differentiates between accented and unaccented words, and the location of the F0 peak differentiates between 1st- and 2nd-syllable accented words (Figure 1). In productions of some native speakers, the contrast between 2nd-syllable accented and unaccented words may be sometimes neutralized (Shport, Reference Shport, Gussenhoven, Chen and Dediu2014; Sugito, Reference Sugito1982b; Sugiyama, Reference Sugiyama2012; Vance, Reference Vance1995).
Averaged F0 contours of words produced by three native speakers of Tokyo Japanese (18 words × 3 pitch patterns × 3 repetitions). F0 was measured at the vowel midpoints in disyllabic words (V1, V2) and the following one-syllable particle or copula (V3).
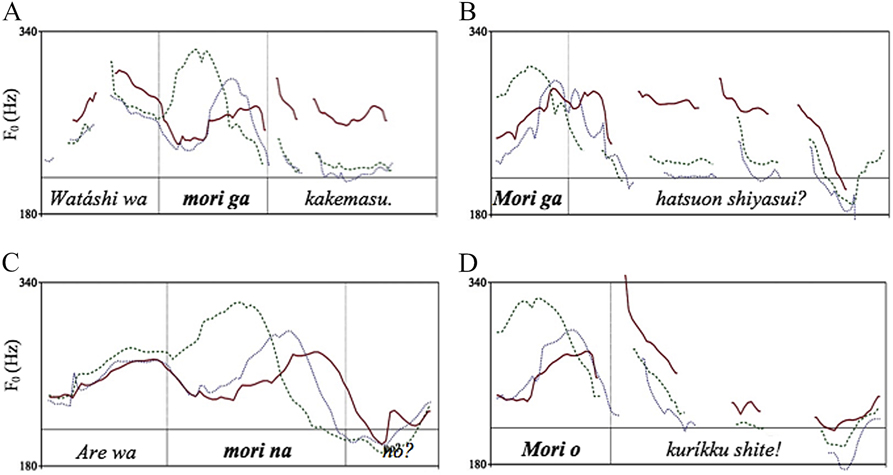
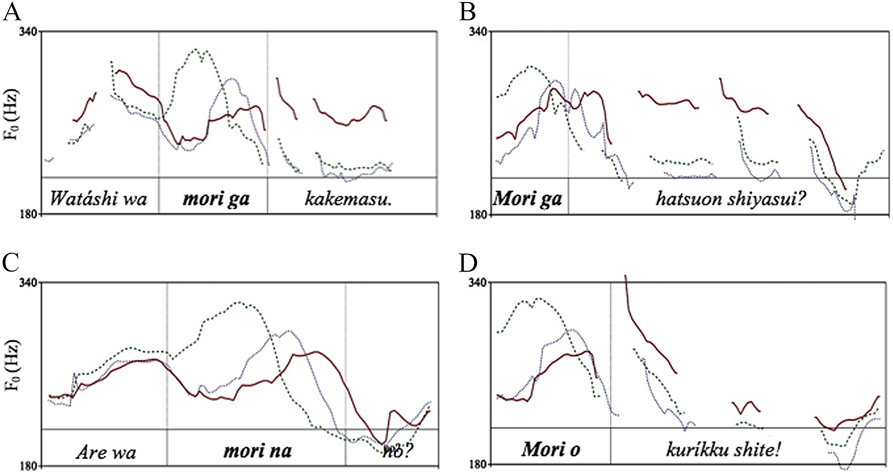
Pitch-accent contrast is also a building block of phrasal intonation in Tokyo Japanese. The presence and location of the accent changes the prosody of an accentual phrase, the smallest prosodic grouping defined by a phrasal high tone and a boundary low tone at the end of the phrase (Venditti, Reference Venditti and Jun2005, p. 180). Because lexical and phrasal prosody interact, cues to pitch-accent contrasts in multiword phrases may include more than just the location of an F0 peak and the presence of an F0 fall. They may also include F0 peak height, phrase-initial F0 rise to the peak, and the degree of F0 fall across the phrase. Specifically, the F0 peak has a larger value for the lexical high tone of the pitch accent than the phrasal high tone; accented phrases have a greater degree of the phrase-initial F0 rise than their unaccented counterparts; and the F0 fall is steeper in accented phrases than in unaccented phrases due to the lowering of all tonal targets following the lexical pitch accent in a phrase (Pierrehumbert & Beckman, Reference Pierrehumbert and Beckman1988; Sugito, Reference Sugito1982b; Sugiyama, Reference Sugiyama2012). Figure 2 illustrates these cues to the accentually contrastive mori words in four sentential contexts. The differences in the peak heights and the F0 rises to the peak are clearer in the contexts A, C, and D than in the context B. The difference in the degree of F0 fall after the mori words is clearer in the contexts A–B than in the contexts C–D. In sum, these additional cues to pitch-accent contrasts may be helpful to listeners of Japanese at least in some sentential contexts. In this study, accentually contrastive words were embedded in sentences in order to provide listeners with all possible cues to pitch-accent contrasts.
F0 contours of four sentences with the word mori produced by AK, a native speaker of Tokyo Japanese. Three contours in each panel represent the sentence with three pitch patterns of the word mori (1st-syllable accented: dashed green lines; 2nd-syllable accented: solid blue lines; unaccented: solid red lines). Vertical lines show the approximate boundaries of mori with the following particle or copula.
Native Language Bias in the Perception of F0 Fall
Lifelong native language experience alters perceptual attention to acoustic characteristics of other language sound patterns in adult listeners (Gandour & Harshman, Reference Gandour and Harshman1978; Kuhl & Iverson, Reference Kuhl, Iverson and Strange1995). Attentional bias (a learned way of speech processing) has been observed for both segmental and prosodic nonnative contrasts. As for word-level prosodic contrasts, experimental evidence shows that native listeners of tone languages attend more to the acoustic dimension of F0 change than nonnative tone listeners do (Francis et al., Reference Francis, Ciocca, Ma and Fenn2008; Gandour & Harshman, Reference Gandour and Harshman1978; Guion & Pederson, Reference Guion, Pederson, Bohn and Munro2007; Wayland & Guion, Reference Wayland and Guion2004). Judging dissimilarity in pairs of tones, native listeners of tone languages like Mandarin, Thai, Cantonese, and Taiwanese pay attention to both F0 peak height and characteristics of F0 change, whereas native listeners of nontone languages like English mostly rely on F0 height information. This finding holds true not only for the perception of lexical tones but also for the perception of lexical pitch-accent contrasts (Shport, Reference Shport2015). Native listeners of Tokyo Japanese use both of the F0 peak location and F0 fall cues to categorize pitch-accent patterns, whereas English listeners naïve to Japanese mostly rely on the former cue. This way of processing phonetic information may negatively affect the learning of lexical pitch patterns, especially the differentiation between unaccented and accented ones.
Although English listeners pay insufficient attention to the F0 fall cue in categorization of pitch patterns, they easily discriminate the patterns with and without the F0 fall (Hirano-Cook, Reference Hirano-Cook2011; Shport, Reference Shport2015). This suggests that English listeners learn to ignore the cues irrelevant to the lexical prosody of their native language. Without a doubt, they do encounter the F0 fall in successions of high and low tones in the intonation patterns of English. (The reader is referred to the inventory of pitch accents in Mainstream American English in Beckman, Hirschberg, & Shattuck-Hufnagel, Reference Beckman, Hirschberg, Shattuck-Hufnagel and Jun2005). However, for English listeners, the F0 fall is associated with pitch accents at postlexical level and prosodic groupings different from the Japanese accentual phrase. The question therefore arises as to whether English listeners can learn to recognize the F0 fall, specifically, its presence and location within a word, as contrastive at the lexical level in a foreign language such as Japanese.
Individual Differences in the Perception of Lexical Prosody
Large individual variability among listeners with similar native language and language learning experiences has been consistently reported in previous research (Chandrasekaran, Sampath, & Wong, Reference Chandrasekaran, Sampath and Wong2010; Goss, Reference Goss2015; Hirano-Cook, Reference Hirano-Cook2011; Iverson & Evans, Reference Iverson and Evans2009; Iverson, Hazan, & Bannister, Reference Iverson, Hazan and Bannister2005; Nishinuma et al., Reference Nishinuma, Arai and Ayusawa1996; Shport, Reference Shport, Gussenhoven, Chen and Dediu2014, Reference Shport2015; Wang, Spence, Jongman, & Sereno, Reference Wang, Spence, Jongman and Sereno1999). This suggests that the individual characteristics of learners due to nonlinguistic experiences and general cognitive abilities also affect perceptual learning. One relevant finding is that musicians are better at processing language-related pitch variations than nonmusicians (Cooper & Wang, Reference Cooper and Wang2012; Wong & Perrachione, Reference Wong and Perrachione2007). This may be explained by their sharpened sensitivity to pitch variation, which is developed during musical training and applied to pitch perception in a second language. Taking this into account, information about participants’ musical backgrounds was collected in the current study’s questionnaire. Information on other experiences that may contribute to learning pitch patterns, such as learning foreign languages, academic achievement as indicated by GPA, and interest in linguistics as indicated by participants’ choice of major, was also recorded. These individual variables were not manipulated in the experimental design, and their examination was exploratory.
TRAINING ON PITCH-ACCENT PATTERNS
As described previously, attention to the F0 fall is necessary for distinguishing Japanese pitch patterns. Previous research has shown that native language biases in tone perception by adult listeners can be overcome with exposure and training (Chandrasekaran et al., Reference Chandrasekaran, Sampath and Wong2010; Francis et al., Reference Francis, Ciocca, Ma and Fenn2008; Guion & Pederson, Reference Guion, Pederson, Bohn and Munro2007; Wang et al., Reference Wang, Spence, Jongman and Sereno1999; Wayland & Guion, Reference Wayland and Guion2004). The practical question is to what degree focused training facilitates this process. Many elements of the training design may be varied in hopes of a better outcome, including types of task, feedback, and training materials. Identification training with feedback improves the identification and discrimination accuracy of pitch patterns (Francis et al., Reference Francis, Ciocca, Ma and Fenn2008; Hirano-Cook, Reference Hirano-Cook2011; Wang et al., Reference Wang, Spence, Jongman and Sereno1999); a mere repetition of an identification test in longitudinal studies without feedback, however, does not necessarily yield an improvement (Arai, Reference Arai1997; Goss, Reference Goss2015; Hirata et al., Reference Hirata, Ayusawa, Nakagawa and Odaka1997). Stimulus words presented in a sentential context facilitate perception and learning as compared to stimuli presented in isolation, perhaps due to the availability of both word-level and phrase-level acoustic cues to the contrast (Hirata, Reference Hirata1999; Lee, Tao, & Bond, Reference Lee, Tao and Bond2009; Nishinuma et al., Reference Nishinuma, Arai and Ayusawa1996). Training on stimuli that include multiple words, phonetic contexts, and talkers has been effective for the learning of nonnative sounds (Lively, Logan, & Pisoni, Reference Lively, Logan and Pisoni1993). This HVT was used successfully for training English listeners in Japanese syllabic morae and pitch accent (Hirata, Reference Hirata1999), Cantonese tones (Francis et al., Reference Francis, Ciocca, Ma and Fenn2008), and Mandarin tones (Chandrasekaran et al., Reference Chandrasekaran, Sampath and Wong2010; Wang et al., Reference Wang, Spence, Jongman and Sereno1999).
The effectiveness of HVT for sound category learning is well established, although its superiority as compared to other training paradigms and its benefits for different types of learners have been questioned (Iverson & Evans, Reference Iverson and Evans2009; Iverson et al., Reference Iverson, Hazan and Bannister2005; Perrachione, Lee, Ha, & Wong, Reference Perrachione, Lee, Ha and Wong2011). In line with exemplar-based models of speech perception, it was originally assumed that acoustic-phonetic stimulus variability encourages learners to focus their attention on the most robust perceptual cues for identifying a foreign sound category across various phonetic environments and talkers (Lively et al., Reference Lively, Logan and Pisoni1993). Iverson and Evans argued, however, that HVT encourages listeners to apply their native-language categories more consistently to nonnative speech, rather than to reweight acoustic cues that are relevant to the identification of a nonnative sound (2009, p. 875). Perrachione et al. (Reference Perrachione, Lee, Ha and Wong2011) showed that HVT produces different levels of learning achievement in high-aptitude learners and low-aptitude learners, where aptitude is measured in a pitch-pattern perception test. Specifically, HVT may impair learners with weaker perceptual abilities relative to low-variability training, although learners still improve in their ability to generalize learning to novel stimuli. The authors suggested that the best training paradigm for a diverse group of learners is the HVT where stimuli are blocked by talker, “because perceptually strong learners benefit from globally high stimulus variability, while perceptually weak learners require low trial-by-trial variability” (2011, p. 469). This design is adopted in the current study’s training procedure.
The effect of perceptual training of American English learners on Japanese pitch patterns has been investigated by Hirata (Reference Hirata1999) and Hirano-Cook (Reference Hirano-Cook2011). Unlike typical HVT studies, both of these studies used complex training procedures focusing on a comparison of the improvement in perception and production abilities in intermediate-level learners of Japanese. Hirata trained learners in pitch patterns and rhythm, using immediate computer-mediated feedback. In the perception pre- and posttests, learners completed an identification task in which they matched the pitch and rhythmic pattern of a word with one of nine prosody graphs (i.e., visual representations of the nine possible patterns in the stimuli). In training, learners imitated words, until the F0 contours in their productions matched with those of provided models. After 10 training sessions, the learners’ performance in correctly identifying pitch patterns improved by 18%. Hirano-Cook used a variety of teaching strategies as well as a combination of production and perception tasks to train students on 20 four-syllable Japanese words with four accentual patterns. After six training sessions (three hours total), the learners’ performance in marking the location of pitch accent (i.e., the methodology similar to the Tokyo Japanese Accent Listening Test) improved on average by 18%, similarly to Hirata (Reference Hirata1999). This complex training did not provide highly variable input.
In pitch-pattern identification tasks, listeners may be asked to match the auditory stimuli to (a) the visual representations of pitch patterns, such as iconic arrows keys, schematic diagrams, and pitch tracks (Goss, Reference Goss2015; Hirata, Reference Hirata1999), (b) images of objects that those auditory stimuli represent (Hirano-Cook, Reference Hirano-Cook2011), or (c) the orthographical representations of words (Chandrasekaran et al., Reference Chandrasekaran, Sampath and Wong2010; Cooper & Wang, Reference Cooper and Wang2012; Francis et al., Reference Francis, Ciocca, Ma and Fenn2008; Hirano-Cook, Reference Hirano-Cook2011; Wong & Perrachione, Reference Wong and Perrachione2007). The choice of the response representation depends on listeners’ second language proficiency and the goal of the task. The orthographical representation is ruled out for naïve listeners who do not have vocabulary knowledge in the target language. Image representations are used in tasks focused on the lexical learning of target words. Graphic representations are used in tasks focused on pitch-pattern awareness. Importantly, pitch-pattern identification accuracy in the latter task type was found to significantly predict tone-word learning proficiency (Cooper & Wang, Reference Cooper and Wang2012; Goss, Reference Goss2015; Wong & Perrachione, Reference Wong and Perrachione2007). This means that when participants learn to map audio stimuli and visual representations of pitch patterns, they also learn to abstract and categorize those patterns as applicable to word learning. Wong and Perrachione pointed to this “phonetic–phonological–lexical continuity for speech learning, such that more basic auditory abilities (phoneme discrimination) mediate performance on higher level auditory tasks (word learning), consistent with bottom-up models of speech perception” (2007, p. 566). In this study, visual representations of pitch patterns were used in all tasks under the assumption of the aforementioned continuity.
THIS STUDY
Extending previous work on Japanese lexical prosody, this study used an experimental approach to investigate perceptual learning of pitch patterns in disyllabic words of Tokyo Japanese. English listeners naïve to lexically contrastive pitch patterns represented the initial stage of learning a pitch-accent language. They were trained to identify the 1st-syllable accented pattern (F0 fall after the first syllable), the 2nd-syllable accented pattern (F0 fall after the second syllable), or the unaccented pattern (no F0 fall). Target words, sentential contexts, and talkers were varied to provide listeners with multiple opportunities to notice the acoustic-phonetic realization of the three target pitch patterns. Listeners also received computer-mediated, trial-by-trial feedback on their responses during the training.
The effect of the training was evaluated by comparing the trainees’ performance in both pretest and posttest, and also by the trainees’ ability to generalize their knowledge to new words and new talkers (Lively et al., Reference Lively, Logan and Pisoni1993; Wang et al., Reference Wang, Spence, Jongman and Sereno1999). Two predictions on the overall effect of training were made:
-
1. The difference between pretest and posttest scores would be greater in participants who underwent training as compared to participants who did not, indicating a greater improvement with training than with mere exposure.
-
2. The difference between trainees and controls would also be observed in generalization tests where listeners apply their knowledge to new words and new talkers (gen-1 and gen-2 tests, hereinafter), indicating the generalization of training-induced learning.
The identification accuracy and the degree of perceptual learning were expected to vary among the 1st-syllable accented, 2nd-syllable accented, and unaccented pitch patterns (Ayusawa, Reference Ayusawa2003; Gandour & Harshman, Reference Gandour and Harshman1978; Nishinuma et al., Reference Nishinuma, Arai and Ayusawa1996). Specifically, we predicted that:
-
3. The unaccented and 2nd-syllable accented patterns would be confused frequently due to the similarity of their F0 contours.
-
4. The unaccented pattern would be the most difficult for naïve English listeners, perhaps, because (a) the accented patterns have potentially more salient cues than the unaccented pattern, such as higher F0 peaks, and (b) English listeners pay more attention to F0 height than to the direction of F0 change.
The identification accuracy of pitch patterns was also predicted to vary with the sentential context due to the interactions between word- and phrase-level cues to the pitch-accent contrasts:
-
5. Pitch patterns of words in the sentence-medial position would have the highest identification scores due to multiple acoustic cues available to the listener (F0 fall after the accented mora, F0 peak height, phrase-initial F0 rise, overall F0 fall in a sentence).
No specific predictions were tested with regard to the expected individual variation in perceptual learning. Individual variation was only explored using information on linguistic, musical, and academic background that was self-reported by participants in a questionnaire.
METHODS
Participants
Forty-nine native speakers of American English with no reported speech or hearing impairments participated in the study for course credit. They were randomly assigned to either a control or training group. The participants completed a questionnaire that included questions on demographics, academic achievement (GPA), foreign languages (languages learned, self-estimated proficiency, length and context of learning), and musical expertise (instrumental or vocal, self-estimated proficiency, length and context of practice). All participants had studied one or more foreign languages, in a classroom setting only, from age 12 or older. In order to control for previous experience with lexically contrastive pitch patterns, data from participants who had studied Japanese or another tone language were excluded. This left 19 people in the control group (10 females, 9 males) and 19 people in the training group (13 females, 6 males).
In addition, six female native speakers of Tokyo Japanese were recruited by word of mouth. At the time of the study, the Japanese participants were using English actively in a study-abroad setting. However, their mean length of residence in the United States did not exceed one year, and their age of arrival was no earlier than 19.
Stimuli
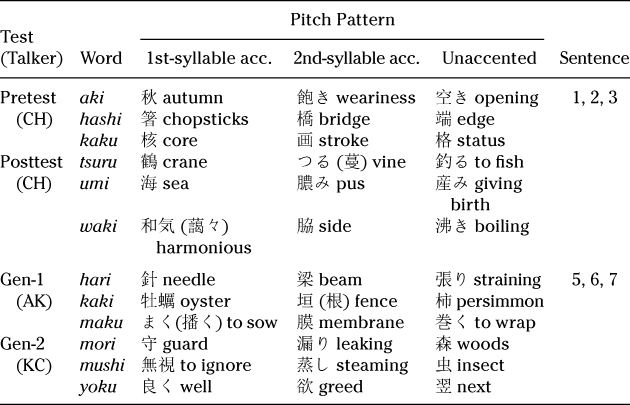
Table 1 shows the stimuli used in this study: seven Japanese sentences (e.g., “I can write __.”) containing 12 target words (e.g., hashi, tsuru, mori, yoku) each carrying each of the three pitch patterns (1st-syllable accented, 2nd-syllable accented, and unaccented). Three repetitions of all of the sentences with the target words were elicited as responses in short scripted dialogues produced by six native speakers of Tokyo Japanese (referred to as talkers, hereafter): three women (RS, AK, KC) and three men (CH, TM, TN). The recordings of RS, TM, TN and the recordings of sentence 4 were used for training only, as described in the following section. Recordings were made using a Marantz recorder and a Shure microphone in a sound-attenuated booth. RMS amplitude was later adjusted to be identical for all sound files.
Test stimuli: Target words produced in sentential contexts by different talkers

Notes. Gen-1 = test of generalization 1, gen-2 = test of generalization 2. The carrier sentences are listed as follows (sentence 4 was used in training only). Pitch accent is marked with acute accent.
1. __ ga kakemasu. “(I) can write __.”
2. Watáshi wa __ ga kakemasu. “I can write __.”
3. __ ga ne. “It’s __, you know.”
(4. __ ni chúuishite kudasai. “Please pay attention to __.”)
5. __ o kuríkku shite. “Click on ___.”
6. __ ga hatsuon shiyasui? “Is ___ easy to pronounce?”
7. Are wa __ na no? “Is that __?”
Pitch-accent patterns of the target words were confirmed with the NHK accent pronunciation dictionary (NHK, 1998). Three of the words had a double pronunciation norm: tsurú or tsúru “vine,” kakú or kaku “stroke,” and yóku or yoku “next.” For each of these words, the pattern that fit the stimuli design in Table 1 was recorded. In all sentential contexts, the target words were followed by function words that did not alter the pitch patterns (the case particles wa, ga, o, ni or present-tense copula na). An examination of the F0 contours in Praat (Boersma & Weenink, Reference Boersma and Weenink2010) confirmed that all talkers produced the three-way contrasts in each word triplet, though their phonetic realization varied slightly by talker. Figure 1 shows F0 contours of the words used in tests (talkers CH, AK, KC; contours are averaged across three productions). F0 contours of the words used in training were similar but they are not shown here for the sake of space.
The target words were played to the participants in their sentential contexts in order to facilitate perceptual learning by providing additional phrase-level acoustic cues to pitch-accent contrasts (Pierrehumbert & Beckman, Reference Pierrehumbert and Beckman1988; Sugito, Reference Sugito1982b; Vance, Reference Vance1995) and phonetic variability in the stimuli (Hirata, Reference Hirata1999; Lee et al., Reference Lee, Tao and Bond2009; Nishinuma et al., Reference Nishinuma, Arai and Ayusawa1996). The list of sentences in Table 1 shows that they varied in the position of the target word (sentence-initial in 1, 3–6 vs. sentence-medial in 2, 7); the accentual type of the following lexical word (accented in 4, 5 vs. unaccented in 1–2, 6); and the type of sentence-final boundary tones (low tones in sentences 1–2 and 4, high tones in questions 6–7, high insisting-rise tones in 3, 5). Figure 2 shows examples of F0 contours in four sentences produced by the female talker AK. Overall, the sentential F0 contours were similar among all talkers, although in unaccented phrases (e.g., mori ga kakemasu) the talkers had a slightly varying degree of decrease in F0 after the phrasal high tone.
The stimuli in Table 1 are divided into pre-/posttest and generalization tests. (Pre-/posttest stimuli were also used in training, with an addition of sentential context 4 and stimulus recordings by talkers RS, TM, and TN.) These are two different sets of stimuli because successful training would imply not only a higher accuracy at posttest as compared to pretest, but also generalization to new stimuli (Lively et al., Reference Lively, Logan and Pisoni1993; Wang et al., Reference Wang, Spence, Jongman and Sereno1999). The gen-1 test assessed trainees’ ability to generalize to new stimuli spoken by talker AK, who was familiar from training; gen-2 test assessed their ability to generalize to new stimuli spoken by talker KC, whose voice was completely unfamiliar to the participants. The structural novelty of the sentential contexts in gen tests as compared to pre-/posttest is that sentences 6–7 are questions, with question boundary tones unheard by listeners and thus potentially interacting with their perception of the pitch patterns of the target words. (A suggestion to use nonquestions for training and questions for generalization tests was made in Ayusawa, Reference Ayusawa2003.)
THREE-ALTERNATIVE FORCED-CHOICE IDENTIFICATION TASK
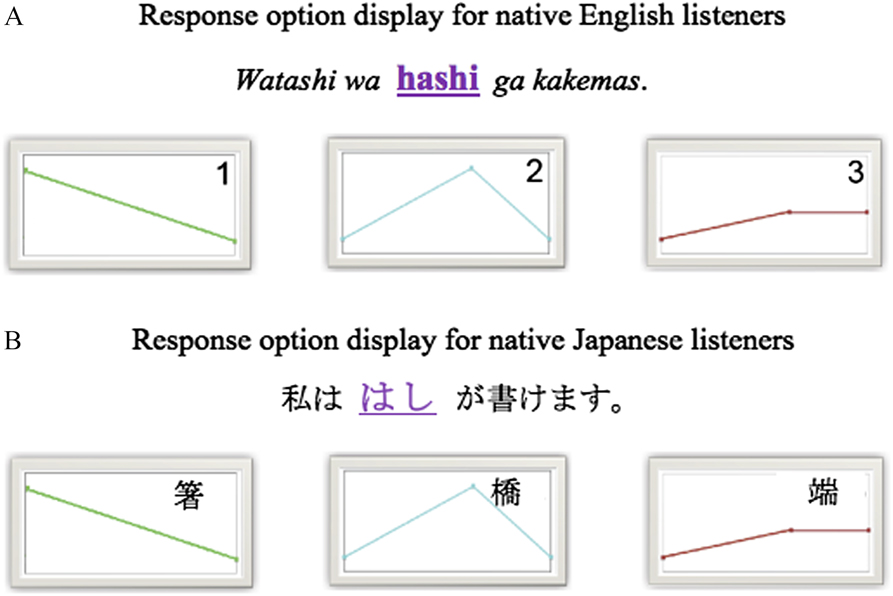
The task was conducted in a quiet room, one listener at a time. Participants were asked to match the pitch pattern of a target word heard through headphones with the graphic representation of the pattern displayed on the computer screen. In each trial, first, an underlined target word was displayed in isolation on the computer screen, in Romanized transcription for English listeners and in Japanese orthography for Japanese listeners. This was done to orient the listener’s attention toward the target word. The next (response) slide displayed the word in a carrier sentence along with three diagrams of possible pitch patterns for English listeners (Figure 3A). As discussed in the introduction, visual representations of pitch patterns were used in this nonlexical task under the assumption of a phonetic–phonological–lexical continuity (Cooper & Wang, Reference Cooper and Wang2012; Wong & Perrachione, Reference Wong and Perrachione2007). Also, it was the only way to represent pitch patterns to English listeners naïve to Japanese. The slide for Japanese listeners included orthographical representations of words because for this group pitch-pattern information is a part of a lexical word’s representation, and leaving out the lexical word could have been confusing (Figure 3B).
Presentation of response choices in the pitch-pattern identification task.

A recording of the sentence was played to the participants with a one-second delay after the response slide display, again, in order to give listeners time to orient their attention toward the target word (e.g., hashi) in the sentence (e.g., Watashi wa hashi ga kakemasu). English listeners were instructed to identify the pitch pattern of the target word and Japanese listeners were instructed to identify the word by clicking the mouse on one of the three diagrams presented on a computer screen. Response time was limited to four seconds; one second after they clicked, the next target word was displayed. Listeners were instructed to respond as quickly and as accurately as they could, and to make their best guess if they were unsure.
During the training, each trial started as described previously, but after a trainee’s response the feedback was displayed: Correct! The right answer was __ or Incorrect. The right answer was __. The feedback was displayed along with a diagram of the correct answer. After a one-second delay, listeners heard the audio file of the trial one more time.
EXPERIMENT STRUCTURE AND PROCEDURE
At the beginning of the experiment, the distinctive function of pitch patterns was explained to all participants because the English listeners were unfamiliar with Japanese, and the Japanese listeners did not necessarily have any metalinguistic awareness of pitch-accent contrasts. The listeners were told that, in tone languages like Japanese or Chinese, all words have specific pitch patterns that differentiate the meaning of words consisting, otherwise, of the same sounds, and that these patterns have to be learned. This was illustrated by audio-recordings of the word higashi and three visual representations of the pitch patterns in this word: hígashi “Mr. Higashi,” higáshi “dry Japanese sweets,” and higashi “East.” Listeners had a practice task with the word higashi at the beginning of each test or training session, the point of which was to remind them of the pitch patterns and the task, and to introduce the sentential contexts with translations to the English listeners who, otherwise, could have been overwhelmed during the task.
All English participants completed the pretest on one day and the posttest, gen-1, and gen-2 tests on another day. In each of these tests, the 162 trials were blocked by sentence (3 pitch patterns × 6 words × 3 sentences × 3 repetitions). Within each block, the stimulus presentation order was randomized. The order of the gen-1 and gen-2 tests was counterbalanced. The Japanese participants, by contrast, took the pretest, gen-1, and gen-2 in one day, all in counterbalanced order, so that each test was taken as the first one by two participants.
The training phase of the experiment took one hour over the course of three days. The training sessions were at least a day apart. The first and second sessions had 144 trials each (3 pitch patterns × 6 words × 2 sentences × 4 talkers), blocked by talker and sentence in order to facilitate perceptual learning in different learner types (Perrachione et al., Reference Perrachione, Lee, Ha and Wong2011). Within each block, the stimuli were randomized. The third session served as a review of all of the training materials, plus an additional sentential context 4 (3 pitch patterns × 6 words × 4 sentences). The trials were blocked by sentence, and randomly drawn from the pool of recordings by four talkers within each block. (Not all 288 recorded stimuli were played due to a limitation in overall participation time as determined by the subject recruitment procedure.) Whereas the training group underwent three training sessions between the pretest and posttest, the control group was engaged in another task with Japanese pitch patterns, so that overall exposure time to pitch patterns was the same for both groups.
RESULTS
The total number of trials attempted by the English listeners in all tests was 24,624 (3 pitch patterns × 6 words × 3 sentences × 3 repetitions × 4 tests × 2 groups × 19 listeners). Listeners’ responses were coded as correct or incorrect; 208 no-response trials were coded as missing. The percentage of correct responses per test, pitch pattern, and sentential context was calculated for each listener, and used for graphic displays of pattern identification accuracy (Figures 4–6). Data from the six native Japanese listeners (pretest, gen-1, and gen-2 tests) are presented in figures and tables for rough comparison only. These data were not used in the statistical analyses due to the small number of subjects in this group, and due to this study’s focus on perceptual learning in second language listeners.
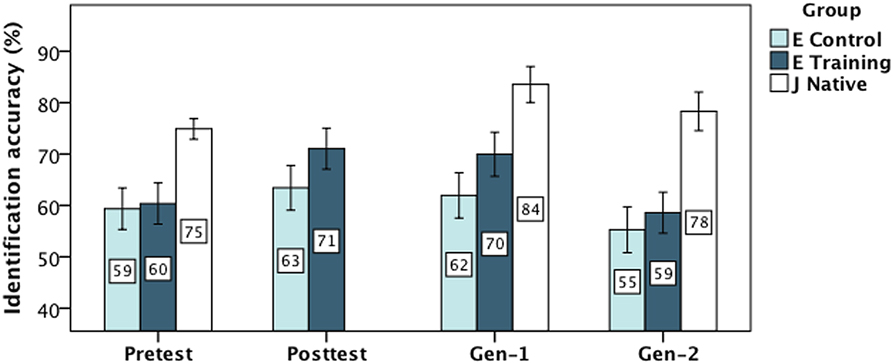
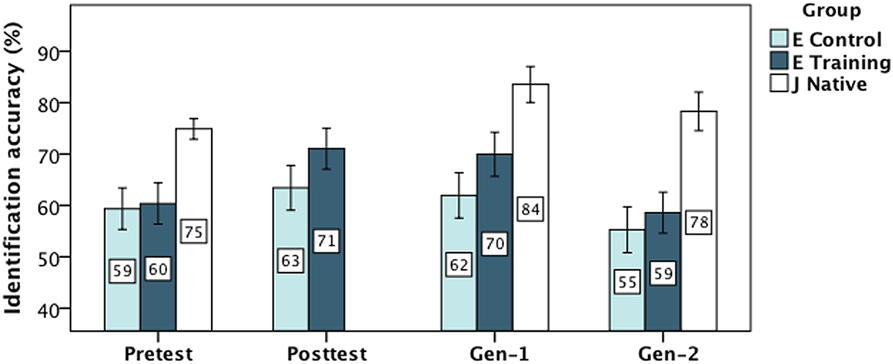
Identification accuracy by test. Error bars indicate ± 1 SE.
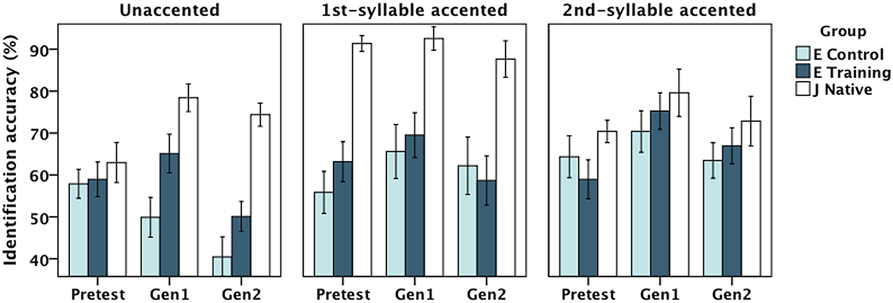
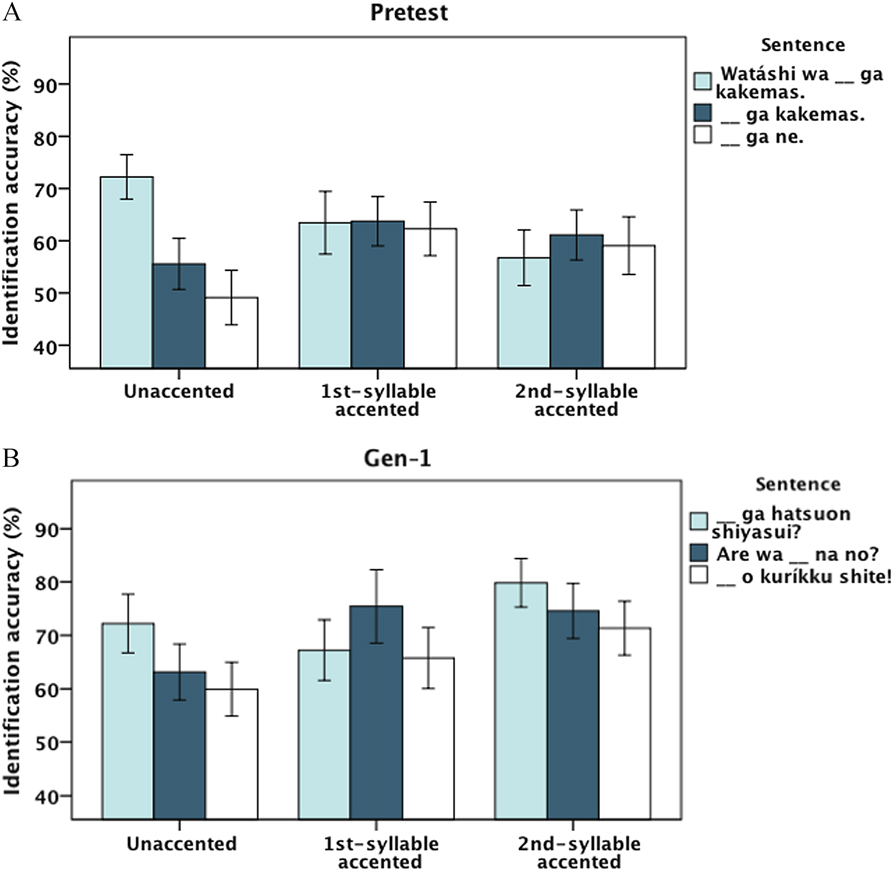
Identification accuracy by pattern. Error bars indicate ± 1 SE.

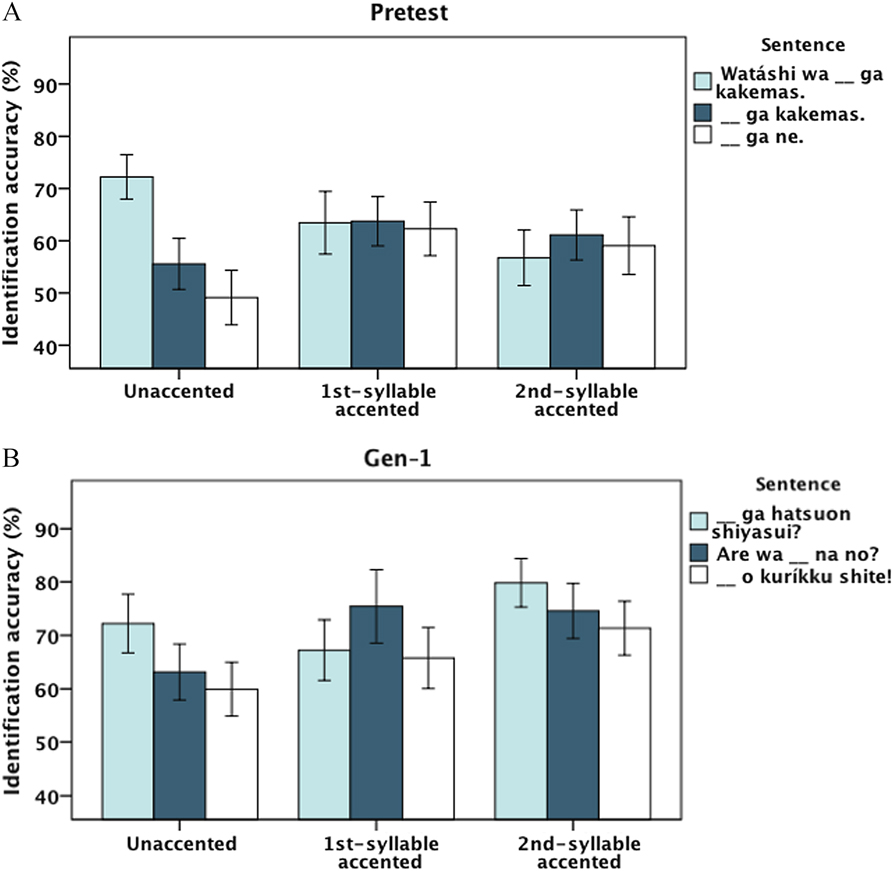
Trainees’ identification accuracy in three sentential contexts: A. pretest; B. Gen-1 test. Error bars indicate ± 1 SE.
The results are reported in the following text in four sections: the overall effect of training (hypotheses 1–2); the uneven learning of the three target pitch patterns (hypotheses 3–4); the role of sentential context in pattern identification (hypothesis 5); and individual differences in task performance.
Overall Improvement and Generalization
To investigate the effect of training on pattern identification accuracy, English listeners’ responses were submitted to mixed-effects logistic regression analysis with Group (2) and Test (4) as fixed factors, and Listener as a random factor. The analysis yielded a significant effect of Test [F(3, 24.62) = 72.38, p < .001], and the interaction between Test and Group [F(3, 24.62) = 9.70, p < .001]. The variance estimate for the effect of Listener was also significant [Wald Z = 4.18, p < .001]. The significant interaction was further examined in contrast analyses, with Bonferroni corrections for multiple comparisons. Specifically, we examined the effect of Group at pretest and the effect of Group on the paired score at pretest and the other tests (i.e., three possible contrasts for the interaction). The difference between controls and trainees was significant in posttest and gen-1 test, as compared to pretest (p < .001 for both comparisons). No significant group difference was observed either at pretest, or in gen-2 as compared to pretest.
These statistical analyses confirmed what is evident in Figure 4. Although the pretest scores were similar in the training and control groups, the improvement in accuracy from pretest to posttest was greater in trainees than in controls (11% vs. 4% gain, respectively). Thus, training generated greater improvement than mere exposure. The difference between pretest and gen-1 scores was also greater in trainees than in controls (10% vs. 3% gain, respectively). This indicates that learning was generalized to new words in new sentential contexts spoken by the familiar talker AK. However, there was no group difference in the gen-2 test: 1% accuracy loss in trainees and 4% accuracy loss in controls, as compared to the pretest. This indicates that learning did not generalize to new stimuli produced by an unfamiliar talker KC. This could be because (a) at this stage of learning, new voices are in general confusing for the listeners, or (b) circumstantially, KC produced the pitch patterns in a less perceptually contrastive way for native English listeners than AK did.
A visual comparison of panels B and C in Figure 1 seems to support the second explanation. Two noticeable differences between the talkers stand out. First, the location of the F0 peak is delayed until the second vowel in the 1st-syllable accented patterns produced by AK, but not by KC. Second, the unaccented pattern has a rising F0 contour for AK, but not for KC. This might make the unaccented pattern perceptually different from the two accented patterns in AK’s productions more than in KC’s productions. A post hoc regression analysis on gen-1 and gen-2 scores with Group (2), Test (2), and Pattern (3) as fixed factors, and Listener as a random factor yielded a significant interaction between Test and Pattern [F(2, 12.30) = 3.05, p = .047], whereas the main effect of Group and the interaction between all three factors were not significant. This can be seen in Figure 5: the difference in accuracy scores between the unaccented and 1st-syllable accented patterns tended to be larger in gen-2 than in gen-1 (15% vs. 10% difference); the difference between the unaccented and 2nd-syllable accented patterns was also larger in gen-2 than gen-1 (20% vs. 15%). This suggests that the identification accuracy of the unaccented pattern was higher for the voice of the gen-1 talker, AK, than for the voice of the gen-2 talker, KC.
Note that the differences in listeners’ responses to these two talkers cannot be attributed to overly exaggerated pitch-accent contrasts in AK versus KC for three reasons. First, the average F0 range in the lexical pitch patterns was 70–75 Hz for both talkers (AK: 238–313 Hz or 4.7 semitones; KC: 200–272 Hz or 5.3 semitones). Second, the F0 peak of the pitch accent in the 1st- and 2nd-syllable accented patterns was obviously higher than the phrasal peak of the unaccented pattern in both talkers’ productions. Third, a visual examination of the native listeners’ data in Figure 4 also shows lower scores in gen-2 than in gen-1. This evidence was taken to support the hypothesis that KC produced the contrastive patterns in a way that did not facilitate their identification by listeners.
IMPROVEMENT BY PITCH PATTERN
Given similar improvements from pretest to posttest and gen-1, only the analyses of pretest-gen-1 data and pretest-gen-2 data are reported here to show improvements in identification accuracy of each of the pitch patterns. In the presence of significant interactions between pattern and other factors, separate regression analyses were conducted for each pattern. In addition, confusability of the patterns was examined in an error analysis of listeners’ responses in pretest and gen-1 test.
The analysis of pretest and gen-1 accuracy scores with Group (2), Test (2), and Pattern (3) as fixed factors, and Subject as a random factor yielded a significant effect of Pattern, as well as Pattern interactions with all other factors [p < .001]. Pairwise comparisons showed that whereas no differences existed at pretest, the 2nd-syllable accented pattern was identified with a higher accuracy than the unaccented pattern at the gen-1 test: 73% vs. 58%, respectively (p = .001). Next, separate analyses were conducted for each of the patterns to examine the effect of training on identification accuracy scores. A regression for the unaccented pattern yielded a significant interaction between Test and Group only, [F(1, 4.10) = 22.86, p < .001]. A regression for the 1st-syllable accented pattern yielded a significant effect of Test only, [F(1, 4.10) = 35.36, p < .001]. A regression for the 2nd-syllable accented pattern yielded a significant effect of Test [F(1, 4.10) = 66.10, p < .001], and the interaction between Test and Group [F(1, 4.10) = 12.86, p < .001]. The variance estimate for the random effect of Listener was significant in all three analyses [p < .001]. Figure 5 illustrates these results: as compared to pretest, trainees improved in their identification of all three patterns; controls, however, improved in their identification of the 1st-syllable accented pattern only. This suggests that learning to differentiate the unaccented and 2nd-syllable accented patterns is induced by training, and not mere exposure to the pitch-accent contrast.
The analysis of pretest and gen-2 accuracy scores also yielded a significant effect of Pattern, as well as Pattern interactions with all other factors [p ≤ .007]. The regressions on identification accuracy scores for the unaccented and 2nd-syllable accented patterns yielded a significant effect of Test ([F(1, 4.10) = 75.89, p < .001] and [F(1, 4.10) = 6.03, p = .014], respectively), and interaction between Test and Group ([F(1, 4.10) = 8.23, p = .004] and [F(1, 4.10) = 9.55, p = .002], respectively). A regression for the 1st-syllable accented pattern yielded a significant interaction only, [F(1, 4.10) = 15.72, p < .001]. Figure 5 shows that, as compared to pretest, trainees’ accuracy in identification of the unaccented pattern in the gen-2 test decreased, but not as dramatically as controls’ accuracy. Controls significantly improved in their identification of the 1st-syllable accented pattern, but trainees did not. By contrast, trainees significantly improved in their identification of the 2nd-syllable accented pattern, but controls did not. This indicates that even in the arguably most difficult test of this study (new stimuli and new talker), trainees retained their lead, especially, for the unaccented pattern. The unequal identification accuracy across patterns in six Japanese listeners may be attributed to neutralization of the unaccented and 2nd-syllable accented contrast in some contexts (Shport, Reference Shport, Gussenhoven, Chen and Dediu2014; Sugito, Reference Sugito1982b; Sugiyama, Reference Sugiyama2012; Vance, Reference Vance1995).
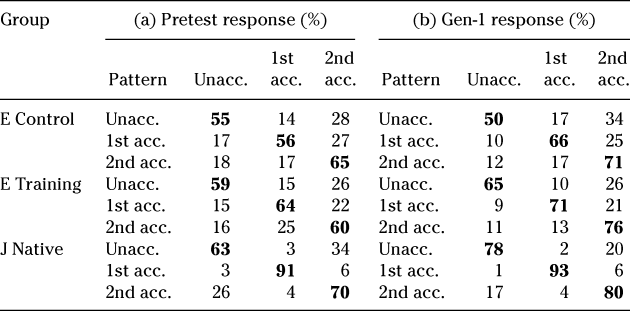
Next, the types of errors made by the listeners in pretest and gen-1 test were analyzed using confusion matrices. Table 2 shows that the English controls improved in their identification of the accented patterns, but not the unaccented one (55% at pretest and 50% at gen-1). The unaccented pattern was more frequently confused with the 2nd-syllable accented than with the 1st-syllable accented pattern. English trainees showed the same pattern of confusibility, although they improved in their identification of the unaccented pattern with training (59% at pretest and 65% at gen-1). These observations suggest the English listeners were not sensitive enough to the F0 fall that distinguishes the unaccented pattern from the accented ones (Shport, Reference Shport2015). Note that the native Japanese participants mainly confused the unaccented pattern and the 2nd-syllable accented pattern with each other, but not the 1st-syllable accented pattern. The mutual confusion of these two patterns by Japanese native listeners suggests that the source of confusion in this group was not restricted to the acoustic cue of the F0 fall. It may be related to the partial neutralization of the contrast between the two patterns. A conclusive interpretation, however, cannot be drawn from a small sample of six native Japanese participants in this study.
Confusion matrices of the pitch patterns at pretest and gen-1

Notes. E = English, J = Japanese, Unacc. = unaccented, 1st acc. = 1st-syllable accented, 2nd acc. = 2nd-syllable accented.
THE ROLE OF SENTENTIAL CONTEXT FOR PATTERN IDENTIFICATION
The role of context was examined for trainees only, at pretest and gen-1 test. Two separate regression analyses on trainee accuracy scores at pretest and gen-1 test were conducted with Sentence (3) and Pattern (3) as fixed factors, and Subject as a random factor. The analysis of the pretest scores yielded a significant effect of Sentence [F(2, 3.07) = 6.67, p = .001], the interaction between Pattern and Sentence [F(4, 3.07) = 8.56, p < .001], and the random effect of Listener [Wald Z = 2.83, p = .005]. Pairwise comparisons showed that the sentential context mattered only for the identification of the unaccented pattern [p < .001]. The top panel of Figure 6 illustrates that unaccented words were identified significantly better in the Watáshi wa ___ ga kakemasu context than in the other two sentences. This result may be attributed to additional acoustic cues that aid identification of the unaccented pattern in the sentence-medial position. These cues may include a relatively small F0 reset in the beginning of the second accentual phrase (___ ga kakemasu), when it starts from an unaccented word (compare the F0 maxima in the sentences in Figure 2).
A regression on gen-1 scores yielded a significant effect of Sentence [F(2, 3.07) = 8.64, p = .001], Pattern [F(2, 3.07) = 14.52, p = .001], the interaction between them [F(4, 3.07) = 4.04, p = .003], and the effect of Listener [Wald Z = 2.86, p = .004]. Pairwise comparisons showed that the __ ga hatsuon shiyasui? context facilitated the identification of both unaccented and 2nd-syllable accented patterns [p ≤ .006]. The bottom panel of Figure 6 illustrates this finding. Comparing the sentence effect at pretest and gen-1 test, it appears that the accuracy was comparable in interrogative contexts (__ ga hatsuon shiyasui?) and noninterrogative contexts (Watáshi wa ___ ga kakemasu). This suggests that learning was generalized to questions, where the presence of a different boundary tone could have been—but, significantly, was not—distracting for the listeners.
Taken together, the results suggest that the context, which follows an unaccented word, may influence the perception of the word’s pitch pattern. What may define the easiest contexts identified in the preceding text and illustrated in Figure 2A and 2B is that the target word is separated from the final boundary tone by a relatively large amount of unaccented segmental material, ga kakemasu and ga hatsuon shiyasui. Thus, the unaccented words are followed a F0 plateau that extends over several syllables up to the boundary tone, undisturbed by other pitch accents. Consequently, the difference between the F0 contours in unaccented and accented phrases may be easily detectable at both word and phrase levels. In contrast, this difference presents itself only at the word level in sentences such as Are wa _ na no? where only two syllables separate the target word from the phrase end (Figure 2C), or __ o kuríkku shite! where the target word is followed by the accented word kuríkku (Figure 2D). In sum, the unaccented word pattern seems to be easier to identify in relatively long unaccented accentual phrases than in short unaccented or accented phrases. The sentence-medial position of the word did not facilitate the identification of pitch patterns per se.
INDIVIDUAL DIFFERENCES
In all of the regression analyses reported in the preceding text, the random effect of listener was significant. These individual differences were explored further at the initial and final (for this study) stages of learning, as captured by (a) pretest scores and (b) the difference between gen-1 and pretest scores, which were indicative of improvement while controlling for initial-stage individual differences. First, the pretest scores were examined. Second, to examine whether individual experiences correlated with pattern identification accuracy, one-tailed Spearman rank-order correlation analyses were conducted for the pretest scores, the pretest-gen-1 score difference, and the following variables: GPA, number of languages learned, years of experience in second language learning and use, number of musical instruments played, and years of experience in instrument use.
The analysis of the pretest scores of all English participants showed that their distribution was bimodal. An approximate threshold of 60% correct responses divided the participants in low-scoring and high-scoring subgroups, with respective means of 45% (SD = 6.9) and 76% (SD = 8.0). In fact, the overall accuracy of some high-scoring English listeners even exceeded the accuracy of Japanese native listeners: compare the maximum pretest score of 90.1% in the control group, 89.5% in the training group, and 82.7% in the Japanese native group. This suggests that there were latent factors influencing individual test performance at the very onset of learning. (Note that these individual differences did not affect the interpretation of the overall improvement results because each of the control and training groups had 10 low-scoring participants and 9 high-scoring participants.)
The score range of all English listeners was 27% to 90% in pretest and 28% to 91% in gen-1 test. The pretest scores of controls and trainees significantly correlated with the number of years studying foreign languages [r = .38, p = .01]. The trainees’ score gains between the pretest and gen-1 correlated with the number of years playing musical instruments [r = .35, p = .02], and with the number of musical instruments played [r = .38, p = .01]. None of the correlations between the score gain and individual variables were significant for the control group. Taken together, these results suggest that once the initial exposure to the novel prosodic categories has occurred, music training may facilitate the learning of pitch-accent patterns, whereas general academic skills (as indexed by GPA) and language learning experience (as indexed by the number of languages learned and years of exposure) may not be relevant to the learning gain.
DISCUSSION
Prosodic Learning of Lexical Pitch Patterns on Average
The goal of this training experiment was to examine whether English listeners can learn to identify contrastive lexical pitch patterns in disyllabic Japanese words embedded in carrier sentences. The high variability in training materials originated from three different sources—target words, sentential contexts, and talkers; it was expected to facilitate learning (Chandrasekaran et al., Reference Chandrasekaran, Sampath and Wong2010; Francis et al., Reference Francis, Ciocca, Ma and Fenn2008; Lively et al., Reference Lively, Logan and Pisoni1993). In this study, the identification accuracy from pretest to posttest increased by 11% in the training group and by 4% in the control group, which was a significant between-group difference. Thus, our first prediction regarding the overall positive effect of HVT prosodic training was borne out. Similar improvement in trainees but not controls was observed in the gen-1 test, which contained new words and sentences produced by a talker familiar to the listeners from training. This change was indicative of generalized learning, and partially supported the second prediction. The magnitude of training-induced improvement, however, was slightly smaller in the current study than the 17% to 18% improvement in previous HVT studies (Francis et al., Reference Francis, Ciocca, Ma and Fenn2008; Hirata, Reference Hirata1999; Wang et al., Reference Wang, Spence, Jongman and Sereno1999). This was not surprising, considering the limited length of one-hour training in this study as compared to five hours in Hirata (Reference Hirata1999) and Wang et al. (Reference Wang, Spence, Jongman and Sereno1999), and 10 hours in Francis et al. (Reference Francis, Ciocca, Ma and Fenn2008).
The second prediction was supported only partially because learning did not generalize to new stimuli spoken by an unfamiliar talker (gen-2 test). Two interpretations of this result are possible. First, short training was not sufficient for generalization to new voices; or second, the new talker, KC, had a less perceptually contrastive pronunciation of the target prosodic contrast for the listeners. These interpretations are not mutually exclusive. The latter one was supported by (a) a post hoc analysis comparing the identification accuracy in the gen-1 test (speaker AK) and the gen-2 test (speaker KC) and (b) the identification accuracy data of native Japanese participants. Variation among native Japanese talkers in conveying the lexical pitch-accent contrast has been reported before in the literature (Beckman, Reference Beckman1986; Cutler & Otake, Reference Cutler and Otake1999; Hirano-Cook, Reference Hirano-Cook2011; Shport, Reference Shport, Gussenhoven, Chen and Dediu2014; Vance, Reference Vance1995). For instance, Cutler and Otake observed that one talker in their experiment produced lexical pitch contrast in a less differentiated way than the other two talkers, which corresponded to a lower identification accuracy of test words by native Japanese listeners (1999, p. 1881). Shport (Reference Shport, Gussenhoven, Chen and Dediu2014) described that some native speakers of Tokyo Japanese produce unaccented words with the pitch accent on the word-final syllable, whereas other speakers have a reverse tendency. This variation cannot be explained by contextual effects or by speakers’ exposure to dialects other than Tokyo Japanese. All of the participants in Shport’s study were raised and lived in prefectures where the Tokyo-type Japanese was dominant, and other dialects with different accentual systems were not spoken in their families.
Unequal Learning of New Lexical Pitch Patterns
Three target categories in this study were the 1st-syllable accented pattern (F0 fall after F0 peak in or right after the first syllable), the 2nd-syllable accented pattern (F0 fall after F0 peak in or right after the second syllable), and the unaccented pattern (no F0 fall). Not all of these patterns, however, were perceived and learned equally well. The notion of similarity between native and nonnative prosodic categories may be invoked for explanations of why perceptual asymmetries in lexical tones exist in nonnative tone listeners (Hallé et al., 2004; So & Best, Reference So and Best2010). It is, however, undetermined which English prosodic categories the Japanese lexical pitch patterns may assimilate to—intonation patterns, stress patterns, or both. If we assume perceptual assimilation between lexical pitch and stress patterns (Hirano-Cook, Reference Hirano-Cook2011; Nishinuma, Reference Nishinuma1997), then the 1st-syllable accented and 2nd-syllable accented Japanese patterns would be expected to map on the 1st-syllable and 2nd-syllable stressed English patterns, and as such would be easily distinguishable from one another. The unaccented pattern, however, would be the most dissimilar from English stress patterns (as it has a slightly rising or plateau F0 contour), and it would have been easy to learn if not for the similarity of the F0 contours in the unaccented and 2nd-syllable accented patterns of Tokyo Japanese (Best & Tyler, Reference Best, Tyler, Bohn and Munro2007).
The results of this study showed that the 1st- and the 2nd-syllable accented patterns were identified better than the unaccented pattern by native English listeners. However, they were still frequently confused with each other (13% of confusion errors or more). This suggests that, even if these Japanese pitch patterns are assimilated to English stress patterns, their high-accuracy discrimination is not guaranteed. Consistent with predictions 3–4 in this study, the unaccented pattern was most confusable with the 2nd-syllable accented pattern and the most difficult for English listeners to learn. Using the Perceptual Assimilation Model, one may argue that the poor discrimination of Japanese unaccented and 2nd-syllable accented patterns may be explained by their Category Goodness assimilation to the closest English pattern, that is, the 2nd-syllable stressed (Best & Tyler, Reference Best, Tyler, Bohn and Munro2007, p. 23). Perhaps the 2nd-syllable accented pattern was perceived as a better exemplar, and the unaccented pattern was perceived as a poor exemplar of this English category. The confusability of the unaccented and the 2nd-syllable accented patterns did not rule out, however, its confusability with the 1st-syllable accented pattern (10% of confusion errors or more). This latter finding suggests, then, that the unaccented pattern also assimilates to the 1st-syllable stressed English pattern as a poor exemplar of this English category. In other words, one nonnative sound (the unaccented pitch pattern) may be a poor exemplar of two native categories (English stress patterns), with assimilation preference for one native category over the other.
The pattern confusion described may have resulted from insufficient attention of English listeners to the F0 fall, the main acoustic cue differentiating the unaccented and accented patterns (Shport, Reference Shport2015). English listeners may be challenged to apply the F0 fall cue for categorization of lexical pitch patterns because of cross-linguistic mismatches in the function of F0 fall in Tokyo Japanese and English. This interpretation is in line with previous findings for tone languages (Francis et al., Reference Francis, Ciocca, Ma and Fenn2008; Gandour & Harshman, Reference Gandour and Harshman1978; Guion & Pederson, Reference Guion, Pederson, Bohn and Munro2007; Wayland & Guion, Reference Wayland and Guion2004). This relative inattentiveness to the F0 fall at the lexical level may be a native language bias acquired through years of native language use.
An alternative explanation of the unaccented pattern difficulty and confusability would presume an intrinsic difference in representations of falling and rising (or level) tones. It appears that both native and nonnative listeners of tone languages identify falling F0 contours better than rising (or high plateau) contours, which may be interpreted as a general response bias. For instance, in Mandarin, the falling tone 4 has been reported to have the highest accuracy in perception, whereas the rising tone 2 has been reported to have the lowest accuracy in both native and nonnative listeners (Lee et al., Reference Lee, Tao and Bond2009; Wang et al., Reference Wang, Spence, Jongman and Sereno1999). In the current study, both of the accented Japanese patterns with the F0 fall had a higher identification accuracy than the unaccented pattern without the F0 fall in English listener responses. Masaki, Takasawa, and Arai (Reference Masaki, Takasawa and Arai2001) also found that native Japanese listeners were more sensitive to falling than rising synthesized F0 contours. This conclusion was drawn from categorical perception of falling F0 movement, which was consistently perceived as the accented pattern, versus noncategorical perception of rising F0 movement, which was accompanied by inconsistent listener responses. Further studies are needed to examine whether rising and falling F0 contours have different auditory representations, which may introduce a universal response bias in perception of pitch patterns.
It is interesting to note that in this study the unaccented pattern was neither the most difficult nor the easiest for English listeners at the very first exposure, that is, at pretest. With more exposure in the control group, the unaccented pattern was identified with the lowest accuracy as compared to the other two patterns. With training and feedback, accuracy in the identification of this pattern improved while still lagging behind the other two patterns. Identification of the unaccented pattern was also the most affected by the sentential context in which it occurred. Thus, conforming to the fourth prediction, the unaccented pattern is arguably the most difficult for English listeners, at least, at the initial stage of learning. This conclusion is consistent with the results in Hirano-Cook (Reference Hirano-Cook2011) who found that neither her trainees nor controls improved in the recognition of the pitch-accent absence in unaccented words.
Individual Differences among Adult Learners
Because the averaged group performance is the most common way to summarize the identification accuracy data, individual differences among participants are often overlooked. Persistently, however, large individual variability in nonnative listeners with similar language background has been observed in speech perception and training studies: for example, the 30% to 83% range for English vowel identification in native Spanish listeners (Iverson & Evans, Reference Iverson and Evans2009); the 42% to 89% range for Mandarin tone identification in native English listeners (Wang et al., Reference Wang, Spence, Jongman and Sereno1999); the 27% to 90% range at pretest for Japanese pitch-pattern identification in native English listeners (this study). The range data is not available in Nishinuma et al. (Reference Nishinuma, Arai and Ayusawa1996) and Hirano-Cook (Reference Hirano-Cook2011), but they had to divide their 2nd- and 3rd-year English-speaking learners of Japanese in subgroups due to individual variability in the task of identifying Japanese pitch-accent location. An approximate threshhold of 60% correct responses that Hirano-Cook (Reference Hirano-Cook2011) used for her low-scoring and high-scoring groups is strikingly similar to the one used in the current study.
Individual differences among the English listeners emerged from the very onset of this study, when some of them were able to achieve identification accuracy comparable with native Japanese listeners. This excellent performance could not be explained by the history of learning Japanese or other tone language. Perhaps the high-scoring listeners had relatively high auditory sensitivity to F0 variations and were able to consistently apply some of their native language criteria to categorization of nonnative patterns. Supporting evidence for this conjecture comes from the previous finding that higher-scoring learners attend more to pitch direction in Mandarin tones than lower-scoring learners (Chandrasekaran et al., Reference Chandrasekaran, Sampath and Wong2010). Goss (Reference Goss2015) showed that acoustic sensitivity measures, such as the ability to discriminate pure tones, predict the improvement in categorization of pitch patterns in beginning English-speaking learners of Japanese. Interestingly, Goss found the same predictive relationship for native Japanese speakers, which suggests that auditory sensitivity to F0 variations matters even after years of experience with lexical pitch patterns. This is consistent with the finding of large variability in both English listeners naïve to Japanese and native Japanese listeners in this study.
The fact that native Japanese listeners did not score at ceiling in this study may be surprising; however, similar results have been reported before: 85% accuracy, on average, in the Tokyo Japanese Accent Listening Test (Ayusawa, Reference Ayusawa1999); 61% accuracy in a 4AFC task of pitch-pattern categorization (Goss, Reference Goss2015). These outcomes are not unique to Japanese: Khouw and Ciocca (Reference Khouw and Ciocca2007), for example, found that native Cantonese listeners had 58% to 70% perception accuracy in identification of level tones, and 75% to 84% accuracy in identification of contour tones. Goss (Reference Goss2015) suggested that relatively low identification accuracy in nonlexical tasks with visual presentation of pitch patterns may be a by-product of the task format rather than a reflection on reduced perceptual ability. Namely, lexical pitch patterns may be an inalienable part of word knowledge for native listeners, making the abstraction of pitch patterns and assigning visual labels to them difficult. The question of how individual attentional biases interact with the native language attentional bias and the auditory sensitivity bias requires further research.
The examination of individual differences was exploratory in this study. One interesting observation was that traditionally examined subject variables, such as previous experience with music and musical instruments, may not correlate with preexisting differences in pitch pattern perception in adult listeners, as reflected in their pretest scores. However, these variables may come to play during the training process, as was indicated by significant correlations between the music experience and the learning gain.
Implications for Second Language Learning of Japanese Pitch Patterns
The first and most encouraging finding in this study is that English learners can improve in their perception of the Japanese pitch-accent contrasts even after an hour of training. Learning of pitch patterns is asymmetric in that some patterns are learned better than the others. The unaccented pattern seems to be particularly challenging. English listeners may or may not learn to perceive the unaccented pattern with great accuracy; however, this pattern is the most difficult to identify for native Japanese listeners as well. Therefore, it is unreasonable to expect perfect accuracy in multiple-choice tasks such as identification of the lexical pitch patterns.
The finding that the unaccented pattern was the most poorly identified does not mean that the difference between the accented and unaccented patterns cannot be perceived by beginning learners of Japanese (Shport, Reference Shport2015). They may be able to better attend to the distinction in productions of certain speakers and in certain contexts. Input quality matters for learning of new prosodic categories, with some native speakers being more effective models than others (compare AK and KC in this study). Sentential context matters too in that the unaccented pattern may be identified best when it is followed by other unaccented words resulting in an F0 plateau contour (e.g., Watáshi wa __ ga kakemasu or __ ga hatsuon shiyasui). The context preceding the target pitch pattern does not seem to affect listeners’ perceptual judgments (Kitahara, Reference Kitahara2001, for Japanese), or at best, its effect is considerably weaker than that of the following context (Francis, Ciocca, Wong, Leung, & Chu, Reference Francis, Ciocca, Wong, Leung and Chu2006, for Cantonese). Thus, the fifth hypothesis in this study, namely, that pitch patterns of words in the sentence-medial position would have the highest identification scores, was not supported, but a positive effect of a different context type was found for the unaccented pitch pattern. This role of input quality for learning goes along with the facilitative effect of the perceptual fading technique in training where at the beginning listeners interact with stimuli exaggerated along relevant for categorization acoustic-phonetic dimensions that are gradually reduced over training (e.g., Iverson et al., Reference Iverson, Hazan and Bannister2005). In general, providing input where the target pitch patterns are maximally contrastive in terms of their acoustic manifestation may be beneficial at the beginning stages of learning.
Lastly, teachers of Japanese as a foreign language need to provide explicit instructions about the pitch-accent contrasts, because mere exposure to pitch patterns is not likely to lead to learning of the contrast (Arai, Reference Arai1997; Ayusawa, Reference Ayusawa2003; Goss, Reference Goss2015; Hirata et al., Reference Hirata, Ayusawa, Nakagawa and Odaka1997). The acquisition of lexical prosody may enable second language learners to distinguish between (or at least to be aware of) homophones such as hana “nose” and haná “flower,” which constitute about 13% of short words in the Japanese lexicon (Kitahara, Reference Kitahara2001). It may also help learners to better recognize prosodic groupings in the language such as accentual phrases, and thus result in a more effective speech parsing.