

I
In the last few years there has been an explosion in the number of papers that aim to explain what determines country risk. Using the difference between the yield of a sovereign's bonds and the risk-free rate (usually defined as the yield of British bonds), these papers have tried to elucidate what macroeconomic or political variables explain more of the variation in country risk or ‘risk premium’ across countries. In this article, we contribute to the discussion exploring the following question: do endowments matter to determine the cost of capital for a country or state? We study the determinants of the risk premium of the bonds issued by Brazilian states between 1891 and 1930, a period of extreme decentralisation of fiscal revenues and expenditures in Brazil. We find that risk premia are highly correlated with state public revenue per capita. Because these revenues came, to a large extent, from the taxes states levied on commodity exports, we argue that endowments mattered to determine the cost of capital for states. We define endowments as the set of natural resources (such as soil types), climatic conditions, and geographic variables (e.g. altitude) that constrain the kind of crops a farmer within a given state can produce. In fact, the relationship between state public revenue per capita and risk premia is also strong when we instrument for state public revenue per capita using a series of price indices of commodity exports by state.
In the literature of sovereign risk there is no consensus as to what matters to determine the cost of capital for governments. For instance, according to North and Weingast, constitutional changes that limit the power of the ruler (e.g. by establishing clear checks and balances) should induce bondholders to reduce their perception of sovereign risk given that with more veto players, there is less probability of default or expropriation of debtholders.Footnote 2 Bordo and Rockoff show that adherence to the gold standard worked as a ‘good housekeeping seal of approval’, reducing the cost of capital for sovereigns because it induced governments to follow prudent fiscal and monetary policy.Footnote 3 Ferguson and Shularick find that beyond fiscal variables what mattered to reduce yields was whether the borrowing country was part of the British Empire.Footnote 4 Sussman and Yafeh and Mauro, Sussman and Yafeh find that the perception of country risk of foreign investors in the emerging markets of the late nineteenth century changed significantly mostly when countries adopted the gold standard or when they were victorious in a major war.Footnote 5 Also, Landon-Lane and Oosterlinck find that investors of Russian bonds adjusted their perception of risk significantly when news about World War I changed their expectations of repayment.Footnote 6
Flandreau and Zumer give more importance to fiscal factors than to political institutions or the adoption of the gold standard. For them, the main factor determining the cost of capital for sovereigns between 1880 and 1913 was their fiscal capacity to pay (e.g. interest or debt service over government revenues).Footnote 7
For the case of Brazil, Abreu and Summerhill have paid close attention to the issue of capacity to pay and the spread of Brazilian sovereign bonds relative to UK bonds. Summerhill examines the capacity to pay of the central government between 1822 and 1889. He argues that during this period the central government of Brazil was able to generate a credible commitment to repay its debts because the political system (a constitutional monarchy) had many veto players preventing any attempt at default.Footnote 8 Abreu suggests that the central government of Brazil was not that great a debtor after 1898 and estimates the actual rates of return for holders of Brazilian debt in foreign currency. He suggests that, in fact, some states had lower spreads (lower default risk) than the central government because they exported precious commodities like coffee. Moreover, he highlights the fact that rubber-exporting states like Pará defaulted in the 1920s after the price of rubber plummeted.Footnote 9
We extend those studies by looking at the debt that Brazilian states issued in international markets in more detail. We use fiscal capacity to pay as the main explanatory variable of the default risk or the risk premium of the bonds issued by states (we define fiscal capacity to pay as state revenue per capita). We show that thanks to the constitution of 1891 states were able to tax the export of commodities and increased their ability to service their debts. Since some states had commodities that had higher prices than others, we explain the variation in the cost of capital, among other things, using the variation in the individual states' capacity to collect export tax revenues. We do not assign too much weight to the states' willingness to pay because domestic elites did not have to face the burden of heavy tax collection. In general, most states obtained the majority of their funding from export taxes and the incidence of those taxes fell on consumers (e.g. taxes on coffee and rubber exports).
Our explanation of how endowments matter is pretty straightforward. Given our definition of endowments as the conditions that determine what kind of commodities can be produced and exported in a determined geographical region, we divide our argument into two parts. The first part is about how endowments constrained and partly determined the kind of commodities Brazilian states produced and the amounts of those commodities states exported. The second part of the argument is about how the differences in commodity exports at the state level generated marked differences in the cost of capital for state governments.
First, farmers in Brazilian states tried to maximise their income through a mix of crops according to two constraints: the prices of commodities in international markets and the limitations to choose their ‘portfolio’ of commodities according to the natural endowments of the state. That is, even if coffee was the most valuable commodity a Brazilian farmer could produce and export, only farmers in high hills with temperate weather and specific soil types could actually produce coffee. Thus, rather than taking endowments as given and as having effects only after the interaction with colonial institutions, as has been the case in the literature on endowments and institutions (e.g. as in Engerman and Sokoloff; Bruhn and Gallego; Naritomi, Soares and Assunção),Footnote 10 we view the importance of endowments as changing over time according to the demand for international commodities (mostly determined in international markets). For instance, Brazilian states with the capacity to produce sugar may have had valuable endowments in the seventeenth and eighteenth centuries, but by the nineteenth century new sugar producers abroad drove the price down and created a long decline in the economic supremacy of sugar states in Brazil. In the second half of the nineteenth century commodities such as coffee, rubber, mate and cotton had unexpected booms that provided advantages for rapid growth to some states over others.
The second part of our argument is that states did not take advantage of the boom in commodity exports until after the constitution of 1891 gave states the autonomy to pursue their own policies and tax their own exports. In fact, this constitution established a federalist system with extreme fiscal decentralisation.Footnote 11 Between 1891 and 1930, states were in charge of collecting most taxes, including taxes on exports, while the federal government taxed imports and paid for national public goods like defence. Since there was very limited redistribution among states or from the central government to other states, the capacity of states to issue debt and to pay for it depended heavily on the export taxes each state collected.
Therefore, our objective is to show that revenues per capita determined to a large extent the perceptions that investors had of the default risk implicit in the bonds that states sold in international markets and that these revenues were determined by the kind of commodity states could export. We construct a panel of state-level data with annual observations of commodity exports, population, debt per capita and fiscal revenues per capita, as well as estimates of the risk premium (difference in the yield of each state's bonds relative to the yield of British consols). We estimate the determinants of risk premium (a proxy for ‘country risk’) using different panel estimation approaches, including a set of instrumental variables estimates.
Finally, our article contributes to the literature in another way. We think there could be both serial correlation and a potential endogeneity problem in our ordinary least squares (OLS) estimates. The potential endogeneity problem could arise because before 1930, and in particular before 1914, the capacity to collect revenues depended to a large extent on the capacity that countries had to export; and that capacity was, in turn, dependent on the infrastructure of each nation. Since most of the infrastructure was financed through debt issues, we think the cost of capital in a way determined the level of revenues per capita. This problem is obviously hard to solve, but by considering the fact that fiscal capacity was to a large extent determined by the kind of commodities states could export, we devise an instrumental variables approach that treats the export mix of states as exogenous and uses the changes in prices as a way to explain fiscal revenues per capita at the state level. The instrumental variables approach reinforces our findings that commodity exports determined capacity to pay and investors' perceptions of country risk, and supports our general conclusion that endowments mattered to determine the risk premium of the states' debt before 1930. Furthermore, the regressions with instrumental variables help us control for possible serial correlation.
The article is divided into four additional sections. Section II provides a brief explanation of the constitution of 1891 and the configuration of the fiscal system in Brazil. Section III presents the methodology. Section IV presents the findings and Section V concludes.
II
In this section we explain why we look at the period 1891–1930 and explain why the yields of Brazilian state bonds during this period can be treated as independent observations. We highlight two major factors. First, that Brazil did not have a decentralised fiscal system until after 1889, and more formally after the constitution of 1891. Second, we show that between 1891 and 1930 there were marked differences in the level of revenues per capita, debt per capita and the cost of capital among Brazilian states. In the next section we explain how we will exploit those differences to run our estimates of the determinants of the cost of capital for states in Brazil.
The fiscal system of Brazil before 1889 was very centralised and depended heavily on trade taxes. After independence in 1821 Brazil had a constitutional monarchy, with a two-tiered parliament, and a council of ministers running the central government. The constitution of 1824 gave the central government the right to tax imports and exports. As a consequence, the imperial government collected around 80–85 per cent of the total public revenue in Brazil, with 50 per cent of the total revenue coming from tariffs on imports.Footnote 12 For instance, the Ministry of Agriculture and Public Works (in charge of around one quarter of the federal budget in 1888), responsible for ‘improvements’ such as railways, ports, colonisation, and so forth,Footnote 13 in 1888 spent 66 per cent of its total budget in the Rio de Janeiro area and only 3.14 per cent in the state of São Paulo.Footnote 14 The northeast and northern regions also contributed more than they received. The south was a net beneficiary, receiving large amounts of money to finance military bases on the borders with Argentina and Uruguay.
The power of provincial governments was weak until 1889 as these governments had little control over fiscal revenues. The provinces were not allowed to collect import taxes or inter-provincial trade taxes, but implicitly they had the right to collect export taxes and, in practice, they also collected interstate taxes.
In 1889, a republican movement overthrew the emperor in a somewhat peaceful revolution and established a provisional government in charge of drafting a new constitution. The provisional government created a commission of legal specialists to write the first draft of a new constitution. This first draft was then sent to the Constitutional Congress for a final revision and approval.Footnote 15 One of the most important issues discussed at all levels was the distribution of tax revenues among the federation and the states. The debate did not revolve around the issue of whether Brazil should be a federalist republic, but how decentralised the federalist system was going to be.
After intense negotiations the Constitutional Assembly passed a new constitution on 24 February 1891, which gave states the right to tax exports, to have their own armed forces and to organise gubernatorial elections.Footnote 16 By not including any limitations to the amount of debt states could issue, the constitution implicitly gave states the right to issue debt domestically and abroad.Footnote 17 Below we explain the implications that these legal changes had for the capacity that different states had to collect taxes and issue debt.
After the 1891 constitution, states relied on export taxes as an important source of revenue. State public revenues from export taxes represented on average around 60 per cent of total revenue between 1914 and 1916. States such as Espírito Santo and Rio Grande do Norte collected more than 85 per cent of their revenues from export taxes. São Paulo increased its collection capacity per capita three times after 1891, collecting almost 40 per cent of what all the states collected, with only half of the total exports and less than one-fifth of the population. In contrast, Goiás and Rio Grande do Sul collected only 24 and 29 per cent of their revenues from export taxes.
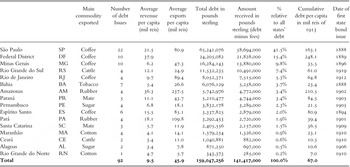
The decentralisation of trade taxes generated a marked inequality in the capacity that states had to collect taxes. In Table 1 we can see the significant variation in state revenue per capita among the different Brazilian states. The average revenue per capita was 9.5 mil reis (about $3 dollars), but some states collected over 20 mil reis per capita and a large number of states collected less than 4.5 mil reis per capita. We can also see that the states that benefited the most from decentralisation were those states with the largest exports per capita. These are states such as São Paulo, Rio de Janeiro state, Paraná, Espírito Santo, which exported coffee, and Amazonas and Pará, which exported rubber.Footnote 18
State distribution of bonds issued in Brazil, 1889–1930

Source: Own elaboration with information from M. Abreu, ‘A divida publica externa do Brasil', Department of Economics of the Pontíficia Universidade Católica (PUC), Rio de Janeiro, Working paper no. 83 (1985); Brazil/Ministerio da Agricultura, Industria e Commercio, Anuario estatístico do Brasil I (Rio de Janeiro, 1917); and V. Bouças, Finanças do Brasil: historia da divida externa estadual e municipal, vol. X (Rio de Janeiro, 1942).
Amounts received per capita represent the ratio of the total amount actually received to state population in 1931.
Once the state governments got the right to tax exports they did not raise the level of export duties, but left them unchanged; instead they focused on reshuffling the revenue-sharing schemes they had with the central government. For instance, in São Paulo and Minas Gerais the state governments charged a tax rate for coffee exports of 11 per cent. Before the constitution of 1891 the central government collected 7 out of the 11 per cent and left 4 per cent for state governments. After the constitution the entire 11 per cent was kept at the state level.Footnote 19
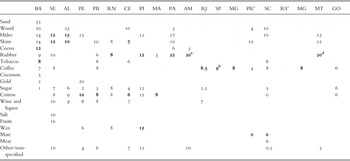
Most of the export taxes were ad valorem (see Table 2). Therefore, what really mattered for the capacity of state governments to pay was that the total value of exports would go up. Table 2 shows the significant variation in tax rates for commodity exports (by type of commodity), which most likely reflects the differences in the elasticity of demand for each of the commodities. Rubber, with a highly inelastic demand, had the highest export tax level. Fernandes estimates, in a static exercise, that rubber states charged taxes that were below the optimal to maximise welfare at the state level (assuming rubber-exporting states could have behaved like a monopoly).Footnote 20,Footnote 21 Yet the variation in tax rates for the same commodity among different states is not that large and mostly seems to compensate for the differences in the cost of transportation. In states in which it was more expensive to export rubber, because of transportation costs or relative scarcity of rubber trees, taxes were relatively lower than in the states with abundant resources and closer to the ocean. Amazonas (AM) or Pará (PA), where the tax rates on rubber exports were 20 and 22 per cent,Footnote 22 there was a slight difference in taxes to compensate for distance to the ocean.
Ad valorem tax rates on commodity exports by state (percentage points), circa 1912

Note: This table shows only ad valorem taxes and not lump sum taxes that were charged on some products. The main commodities exported by each state appear in bold.
aRubber from the remote Javary River basin paid only 10%.
bJ. L. Love, São Paulo in the Brazilian Federation, 1889–1937 (Stanford, 1980).
cThere is also an additional tax of 10% on all products except mate.
dRubber from Mato Grosso (MT) exported through Pará and Amazonas paid only 12%.
eTax rates not reported.
Source: Lyra, Economia e finanças dos estados do Brasil, 1913.
There is also some evidence of variation in tax rates over time. For instance, some states moved tax rates in a countercyclical way. The governments of Minas Gerais and São Paulo lowered the tax rates on coffee exports from 11 to 9 per cent to increase the volume of sales when international coffee prices declined.
In sum, the fiscal system of Brazil was decentralised after the constitution of 1891 provided states with the capacity to tax exports, and we will show that those differences in tax revenues were translated in differences in the cost of capital for state governments.
Yet, the state's capacity to pay was to a large extent determined by the state's commodity exports. In turn, the capacity to export specific commodities was constrained by the natural resources of each of the states. We argue that planters, farmers and cattle ranchers in each state could choose what to produce and export, but were constrained by the natural endowments of the places where they produced commodities. For instance, coffee could only be produced in places with high altitude, temperate weather and with specific types of red soil. Therefore, natural endowments determined what could be produced and economic agents maximised their income according to their limitations of land, weather and altitude.
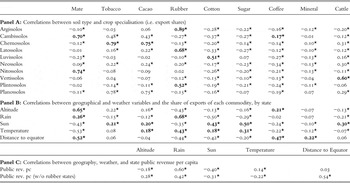
In Table 3 we show that crop specialisation (using the share of each commodity to total exports) was highly correlated with soil types and geographic and climatic variables (panel A). For instance, states that had rubber as a large share of their exports also had high rainfall, high temperatures, low altitude, and were close to the equator. In fact, natural rubber could not be grown in plantations, so the constraints were even stricter, i.e. rubber exporters could tap rubber only in the places where it grew naturally. For coffee the most important factor was high altitude, low sunlight and lower temperatures (see panel B of Table 3). That is, there were many of these geographic, exogenous variables determining how much a state could export and, in fact, the geographic variables are significantly correlated with public revenue per capita at the state level (see panel C of Table 3).
Correlation between crop specialisation, geography, weather, soil types, and revenues in Brazilian states (averages 1890–1930)

Note: Soil type represents the percentage of the state area that corresponds to each type of soil. Sun is the days of sunlight in a year. Rain is the average precipitation in a year and temperature is the average temperature in the state. All of these variables come from measures made from 1950 to 2000. * indicates significant at 1%. Figures in bold represent some of the most distinctive geographical conditions associated with each commodity.
Source: Most variables kindly shared by Rodrigo Soares and Leonardo Monastério. See J. Naritomi, R. R. Soares and J. J. Assunção, ‘Rent seeking and the unveiling of “de facto” institutions: development and colonial heritage within Brazil', NBER Working paper no. 13545 (2007).
The variation across states in terms of the cost of capital and the amounts of debt issued followed a clear pattern: states with larger exports per capita were able to sell more debt in international markets and paid lower interest rates for those loans. Table 1 shows data on the distribution of debt (or bond issues) by state. The table depicts clearly the concentration of debt issues in four states: São Paulo, Minas Gerais, the Federal District (in Rio de Janeiro) and Bahia. All of these states, except Bahia, had coffee as their largest export. In fact, these were the states with the largest populations in the Brazilian federation, so we would expect them to have a higher demand for external financing to pay for infrastructure and other improvements. In fact, in our multivariate analysis we control for population and also scale state revenues by population. The second feature to note in Table 1 is that the column with dates of the first year of bond issues per state shows that most debt issues happened between 1909 and 1917, perhaps because this was the peak period for international capital flows to Latin America.Footnote 23
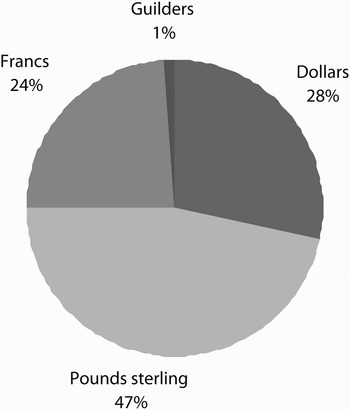
Figure 2 shows that Brazilian states managed to place bonds in at least four of the largest financial markets of the time. Almost half of the bond issues were denominated in pounds sterling and traded in the London stock exchange. States issued another 24 per cent of the total debt in French francs and traded the bonds in Paris and Brussels. Finally, in the 1920s, many of the new state bond issues were denominated in US dollars and were traded in the New York stock exchange.
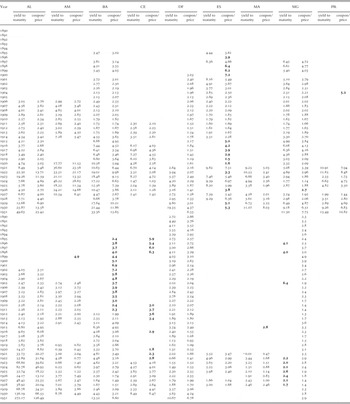
As a product of the international supply of funds and the conditions that allowed Brazilian states to borrow we find significant variation in the cost of capital for states. Table 4 shows the variation in the cost of capital for states between 1890 and 1931 (the cost of capital is estimated as the bond's coupon rate over the average price of the bond minus the yield of British bonds). It is important to note that there is significant variation over time and across states. Much of the variation in the cost of capital across states, we argue, can be captured by the variation in crop specialisation (see panel C of Table 3). The variation over time, which is high, is a product of the variation in the price of the main commodities exported by each of the states. Thus, the logic is that in states specialised in certain commodities, the prices of those commodities fluctuated over time and the combination of both determined the capacity of the states to pay. The willingness of states to pay, that is the ad valorem tax levels, increased when prices were higher (in commodities like rubber or coffee that had relatively inelastic demands) and decreased during bad times. For other commodities we do not have much evidence of change over time.
Spreads of state bonds over UK consols yield, 1890–1931 (percentages)

Note: The figures represent the implicit risk premium of the average yield for bonds of each state relative to the UK consols. Figures in bold are spread of state bonds quoted in the Rio de Janeiro stock exchange relative to the UK consols.
Coupon spread for Goiás in 1917 is 3.4 and for Sergipe 3.7 in 1918 for bonds (apolices) quoted in Rio de Janeiro are not reported in the table.
Source: See Appendix B for an explanation of how we calculate the yields. Sovereign risk from Global Financial Data (using the 4.5 gold bonds from 1889 to 1914, the 5s bonds of 1912 for 1915, and the 5s funded debt of 1914 for the rest of the period). All yields in this table are calculated by subtracting the yield of the bond from the yield of British consols. British yields from NBER Macrohistory database (available at www.nber.org).
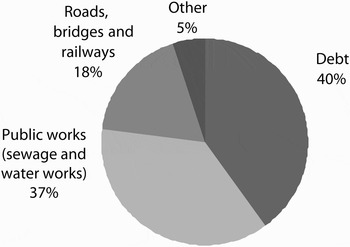
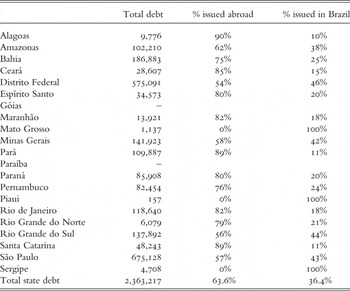
We study the cost of capital for state debt issued abroad for two reasons. First investor perceptions of capacity to pay were based on their informed estimates of the fiscal capacity of states, the information they had about states' exports, and, indirectly, on the kinds of natural endowments the states had. The prospectuses of state bonds contained information on what the funds were going to be used for and explained what sources of revenues backed each of the issues. Second, states issued the bulk of their debt abroad, about 66 per cent of their total debt (see Table 5). Third, the cost of capital (the spread over the risk-free rate, i.e. the UK consols rate) abroad reflected the cost of capital that state governments in Brazil faced to pay for large public infrastructure projects. This is because the largest share of the capital obtained through foreign bond issues was used to pay for infrastructure (18 per cent) and other urban improvements, such as waterworks, sewage, and other projects (39 per cent). Also, a large part of all bond issues abroad were used to roll over past debts (39 per cent) (see Figure 1).
Uses of foreign debt by Brazilian states (1889–1931)

Currency in which state bonds were denominated (1889–1931)

Foreign and domestic state debt by Brazilian states in 1922 (mil reis)

Source: Diretoria Geral de Estatística/Ministerio da Agricultura, Industria e Commercio, Estatistica das finanças do Brasil (Rio de Janeiro, 1926).
Now, one may think that because we are excluding domestic bond issues we are not taking into account the bond issues of all the states or we are biasing our estimates to look only at the bonds issues by states that had significant exports of commodities. Table 5 shows that the domestic bond market was also dominated by the same states that issued most of the bonds in international markets. Therefore, the data for domestic issues and our database of foreign bond issues have similar biases. Moreover, we collected all of the state bond quotations available in the Rio de Janeiro stock exchange and tried adding them to the database. The problem is that most of the data of bond quotations that was regular was for bonds that were also traded abroad, so adding the quotations from the domestic stock market to our database yields a net addition of only 20 observations. This is because there are states like Sergipe and Goiás that issued bonds that were only traded for one year. In the same way, Paraíba, Rio Grande do Norte and Santa Catarina had regular trading of their bonds, for only 10 years, in the 1920s, when there was more volatility in the market.
We also have data for municipal bonds traded in Rio de Janeiro and London. Yet we believe this should not be included in the present analysis because investors estimated the price of these bonds in a completely different way. The main sources of revenue for municipalities were taxes on property or property transfers and a variety of stamp taxes. Moreover, it is not clear what relationship we should expect to find between state and municipal bonds. That is, they may not be comparable at all. In fact, in some cases municipal bond prices were more volatile than the state bond prices (e.g. in Belém vs Pará and Manaus vs Amazonas), but in others municipal bonds were more stable and apparently perceived as less risky than their state counterparts (e.g. Porto Alegre vs Rio Grande do Sul).
We believe that the investors who were trading Brazilian state bonds separated the risk implicit in each state from the risk implicit in the debt of other states, much as they separated the yields of different countries. We have found that in specialised publications, such as L'Économiste européen, there were sections detailing the state of public finances and the level of exports by state in Brazil, even disaggregated by product. In fact, yields for different states are relatively independent from one another (see Table 4). There does not seem to be any contagion effect after one of the state defaults. For instance, Espírito Santo (ES) defaulted in 1900 and in that same year (and the following) the yield of bonds issued by the Federal District and São Paulo actually went down. In the 1920s many states in the north of Brazil defaulted on their debts and the yields implicit in their bonds skyrocketed without generating any negative effects on the yields of bonds of other states in the south of Brazil. The yields of states like Rio de Janeiro (RJ), São Paulo (SP), the Federal District (DF) or Minas Gerais (MG) did not seem to react to those events.
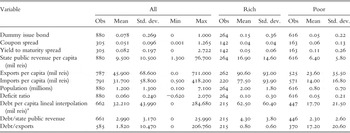
In our view, investors were willing to lend at a lower cost when states had higher tax revenues per capita because they had a lower probability of default. Higher tax revenues per capita were usually a consequence of higher exports per capita at the state level. Table 6 shows that states that had higher revenue per capita also had lower spreads. This table shows the summary statistics of our complete dataset, separating the data into two categories, rich states (with revenues per capita above the median) and poor states (those below the median). According to the last columns, there are significant differences in cost of capital and state revenues per capita among rich and poor states, especially in the size of the variation around the mean of the former. Richer states had a very tight distribution of spreads (cost of capital), with a mean of 0.04 (400 basis points) and a standard deviation of 0.04 (also 400 basis points), while poor states had a mean of 0.06 (600 basis points) and a standard deviation of 0.13 (1300 basis points). In order to test if the relationship between revenues and cost of capital holds, in the next section we explain the methodology we use to conduct multivariate analysis using panel data.
Summary statistics

Note: Rich states are those with revenue per capita above the median for almost all years. Among the rich states are Rio de Janeiro, São Paulo, Minas Gerais, Espírito Santo, Rio Grande do Sul and Amazonas. Poor states are Alagoas, Bahia, Ceará, Goiás, Maranhão, Mato Grosso, Pará, Paraíba, Paraná, Pernambuco, Piauí, Rio Grande do Norte, Santa Catarina and Sergipe.
aWe estimate these figures by simple linear interpolation between the data points available.
III
Our objective is to study the determinants of the cost of capital of Brazilian states between 1891 and 1930. In particular, we are interested in looking at the effects of state public revenues per capita on the cost of capital both over time and at the cross-section level. Thus we use panel data techniques controlling for a series of state characteristics, fixed effects and time dummies.
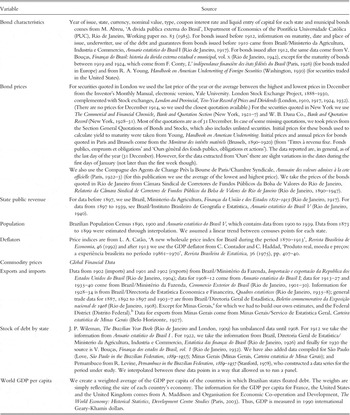
Compiling fiscal and debt data for the different states of the Brazilian federation between 1890 and 1930 required us to get statistics from a variety of archival sources and published materials. Appendix B describes in detail the sources used to estimate the key variables for the present analysis. Below is an explanation of how we constructed our main dependent variables and how we designed the empirical approach we use to examine the determinants of cost of capital for Brazilian states.
Since the yield of the bonds issued by Brazilian states is our main dependent variable it is worth explaining clearly how we estimate it. So far, we have constructed two measures for yields, one is the coupon yield, or the yield implicit in bond quotations according to the coupon payments of that bond. That is, the yield is just the coupon payment of a bond over the average price of that bond in a given year. For example, a 4 per cent bond with face value of £100 quoted at £80 would have a yield of 5 per cent (because 4/80 = 0.05). Since part of the return is to compensate for the opportunity cost of investors if they had invested in a risk-free asset, the yields we report subtract the average annual yield for UK consols. In that way the yields we study reflect the risk premium investors demanded to buy debt issued by Brazilian states.
This method of estimating the yields or spreads, however, assumes that bonds are perpetuities. According to Mauro, Sussman and Yafeh, ‘this approximation was reasonable, given that the bonds were usually of very long maturity [in our state bonds sample the average maturity is 33 years], and probably seemed natural to the large proportion of investors who were rentiers living off the fixed income provided by the bonds’.Footnote 24 Moreover, these authors point out that the most sophisticated methods for calculating exact yield were not developed until the second half of the twentieth century and that investors usually estimated their yields using prices and coupon rates. In fact, for Brazilian bonds it is hard to think that investors cared about yield to maturity since the federal government postponed repayments in 1898 and 1914.Footnote 25 That is, we believe investors had a short investment horizon.
Our second measure of yield is an approximation of the yield to maturity of the debt issued by Brazilian states. Yield to maturity is a rate which reflects the flow of all the revenue (the gains – or losses – from bond appreciation – or depreciation – plus interests) derived from a given bond, relative to the price that investors pay for the bond today. To estimate it we first subtract the current bond value (i.e. its current price) from its par value in order to obtain the discount that investors get when they buy the bond. Then, we assume that the profit (loss) from purchasing a bond today is only realised at maturity, when the bond is redeemed. We also assume that the profit (loss) of purchasing a bond today and having it redeemed at face value tomorrow is realised evenly over time. So if an investor buys a $100 bond at $80 today and the bond matures in 20 years, we assume the investor makes $20 profit over 20 years, and for simplicity we just assume the return from capital gains is $1 per year. We then add to this gain the profit an investor would make from the actual annual coupon payment of the bond, which is simply the coupon rate multiplied by the par value of the bond. This gives us the annual return for the investor, which we then divide by the current bond price to obtain the yield to maturity.
Given that we need the maturity to be able to estimate yield to maturity and we do not have this information for all the bonds, our sample of yields of state bonds using this approach is smaller than that for the yield calculated by using coupon rates only. Moreover, using the sample of bond yields estimated using yield to maturity introduces another bias. Since many of the poorest states in Brazil could not issue bonds with long maturities (or at least we do not observe those), we end up estimating really high yield to maturity rates for those states when they were sold at a discount from par value. Therefore, our estimates with yield to maturity are biased in favour of our hypothesis that richer states faced lower cost of capital. Since the first set of estimates using coupon yields do not bias the data in favour of our hypothesis, we make most of our inferences using those estimates and present some estimates using yield to maturity as a robustness check.
The first step in our empirical approach is to address one of the biases in our data. In Table 1 we show that only 15 out of 20 Brazilian states issued foreign debt. More importantly, around half of the bonds issued in foreign markets, representing more than 70 per cent of the capital raised by states, were issued by four states. Thus, one may argue that there is a bias in the data because a few states issued most of the debt and some states did not even issue foreign debt. In Appendix A (Tables A1 and A2) we address this bias by running simple specifications of Cox Hazard or Probit models, for which we create a dummy variable that is equal to one on the year when a state government issued a bond in international markets. That is, any state-year observation will take the value of 1 if the state issued a new foreign bond on that year, and zero for all the other years. We find that, both in the Cox Hazard (Table A1) and the Probit (Table A2) estimates, having higher tax revenue per capita made states more likely to issue more debt in any given year. That is, the bias in our data goes in the same direction as our hypothesis. The states that did not issue bonds had low revenues per capita.
Now, our main objective is to estimate the determinants of the spread or cost of capital for Brazilian states. Our hypothesis is that richer states were able to issue debt at a lower cost and in larger amounts in international capital markets. We measure the states' capacity to pay using state public revenue per capita. This is a good indicator of the economic characteristics of each state since it is correlated with total exports per capita by state and with a variety of geographical and geological variables at the state level. Moreover, most of the bonds issued during the period had diverse sources of state public revenue as guarantee, such as service fees (lighting, sewage, water, etc.) and taxes (export taxes, professional, industry, etc.). Therefore, state revenues per capita are a good measure of state capacity to pay international debts.
Our basic specification to examine the determinants of the cost of capital by state is of the following form:

where r it is the logarithm of the risk premium of state i at time t, measured as the difference between the state's bond yield and the yield of British consols. s it-1 is the logarithm of state public revenue for each state i lagged one period. X is a vector of control variables that includes the logarithms of imports per capita, population, and debt per state. We also use fixed effects for states (ζi) to control for state unobservable characteristics and time dummy variables (φt), accounting for time varying trends common for all states. When a state had more than one bond being traded in the secondary market we use the average yield of all the state bonds. We repeat this exercise with our estimates of yield to maturity as well.
We are confident that we can treat states as independent observations for this analysis for two reasons. First, state bonds had no explicit or implicit bailout clauses. For instance, a few Brazilian states suspended payments (defaulted) on their debt over the period we study and those defaults were not followed by a bailout from other states or from the federal government. This was the case of Espírito Santo in 1900, Alagoas in 1921, Pará in 1922, Bahia in 1923 and Amazonas in 1924. In Table 4 we can see the spread of those bonds (over the UK bonds) going up when the state governments default. Yet default in one state did not have negative effects on the spreads of other bonds, i.e. there was no contagion unless the default was the consequence of a trade shock that affected many states, as was the case with the low price of rubber in the early 1920s (affecting Pará and Amazonas). More importantly, there is no sovereign ceiling effect. Some of the states' bonds were sometimes perceived as less risky than those of the federal government and in some years, such as 1914, the sovereign risk goes up faster than the risk for other bonds. Take, for instance, the risk premium of the debt of São Paulo, which remains under the sovereign risk for a few years after every sovereign gets restructuring (e.g. 1898 and 1914). In fact, between 1918 and 1927 a large number of state bonds in Table 4 had risk premia lower than sovereign risk.
Second, the redistribution of resources among states or by the central government was minimal. For example, in 1914 the central government divided total expenditures among its seven ministries as follows: Justice (7%), Foreign Relations (1%), Navy (8%), War (11%), the Treasury (38%), Transportation and Public Works (32%) and Agriculture, Industry and Commerce (3%).Footnote 26 We can infer that most of the ministries, except the latter two, spent most of their funds in Rio de Janeiro or in providing national public goods that benefited all the states (e.g. security). If we assume that all the budget of the last two ministries went to the states, then about 65 per cent of the central government's budget was spent mostly in Rio de Janeiro. Now, a significant amount of the budget of these two last ministries (that supposedly provide improvements for the beneficiary states) was also spent in the city of Rio de Janeiro.Footnote 27 Moreover, there were no rules to distribute fiscal resources to the states, no programmes to redistribute from one state to another, and no fiscal transfers to the states from the centre. What states collected, they kept for their own expenditures. In the same way, the constitution of 1891 gave states the mandate to spend on education, public health and other public goods that in many countries are the responsibility of the central government.
The capital of Brazil, the Distrito Federal (DF), was located in what is now the city of Rio de Janeiro during the period we study. For the purposes of this article we excluded the DF from our estimates because it is not properly a state like the rest of our units of analysis. It should be treated like a municipality, a rich municipality with significant federal expenditure devoted to improving its infrastructure. The DF also differs from the rest of the states in that its local production of commodities was minimal, its export tax revenue was only 1.8 per cent of the total revenues, and its main source of revenue was property taxes (Brazil, 1926).Footnote 28
We also excluded from all of our regressions the data for Goiás and Acre. We excluded Goiás because it was a landlocked state and there was no data on exports. This is because all of the exports from Goiás had to go through other states and were not reported separately as was the case for Minas Gerais, another landlocked state (see Appendix B). Acre was part of Bolivia until the end of the nineteenth century and was officially declared part of Brazil in 1903. As a territory it did not have as much autonomy as the states of the Brazilian federation, and the statistics for Acre are not comparable in quality and detail to those we have for Brazilian states. Thus, we could not include Acre in our estimates.
IV
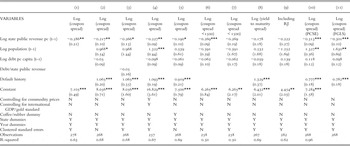
The results of our OLS estimates confirm our hypotheses and are presented in Table 7. States with higher state public revenues per capita tended to have lower cost of capital (i.e. the coefficient is negative). The interpretation of the coefficients is as follows. In specifications 2 to 7, in which the elasticity of state public revenues per capita to the cost of capital is between -0.19 and -0.27, we would say that if, for instance, a state went from being in the group of poor states, with an average state public revenue per capita of 6.4 mil reis, to having the average state public revenues per capita of 9.5 mil reis (see the descriptive statistics in Table 6), we would observe a sizable decrease in the cost of capital. According to the coefficient of specification 4, this jump would be associated with moving from having a state government issuing debt that pays 624 bps over the risk-free rate to debt that pays only 555 bps. Yet going from being a relatively poor state to being one of the richest is associated with a reduction in the cost of capital from 624 bps to around 391 bps. In order to understand the intuition behind this last counterfactual one has to think that if a state like Pernambuco, a predominantly sugar exporter, could suddenly grow coffee and be as rich as the state of Rio de Janeiro, a coffee-exporting state, it would get higher revenues per capita and could issue debt almost 0.6 per cent (60 bps) lower for its debt issues. These results hold even after controlling for whether the state has defaulted in the past, for the level of imports per capita, debt per capita and population in the state. Most of the regressions, from specifications from 1 to 9, control for year and state dummies and have clustered robust standard errors to account for heteroskedasticity and serial correlation. In specifications 2, 5 and 6 we do not have clustered standard errors, but we still get coefficients with similar significance.
Log spreads (Brazil states 1891–1928). Dependent variable is the logarithm of the spread of states' yield over the yield of of UK consols in basis points. The first nine specifications are OLS panel data. Specification 10 is a linear regression with panel-corrected standard errors and 11 is feasible generalised least squares in order to model the autocorrelation of errors within panels. All the regressions are the spreads of state bonds in foreign markets but 8, which include quotations from the Rio de Janeiro stock exchange (this increases the number of states by including Paraíba, Sergipe and Goiás). The hypothesis tested is that those states with higher capacity to collect revenue are perceived by international markets as safer and thus have lower spreads or lower default risk. A negative sign in lag state public revenue per capita would confirm our hypothesis. Clustered robust standard errors unless otherwise indicated.

*** indicates significant at 1%, ** at 5%, and * at 10%.
One may say that Brazil had market power in coffee and, perhaps, in rubber (even if it was not able to exercise it). That is why in specification 5 of Table 7 we included dummies for coffee- and rubber-exporting states. We can see that only the dummy for rubber is significant and implies that having rubber as one of the most important commodities reduced the risk implicit in the bonds by 0.67 per cent.
In Table 7 we also perform other robustness checks. First, in specifications 6 and 7 we run the regressions without outliers, i.e. states that had spreads over 1500 bps. These were usually states that defaulted on their debts. Interestingly, we still get similar magnitudes in the coefficients and negative signs (as expected). In specification 8 we run the same regression using yield to maturity as dependent variable. The coefficient is larger and the yields or spreads seem to be more sensitive to whether a state government defaults on its debt payments. In specification 9 we run the same regression, but including all the state bonds traded in the Rio de Janeiro stock exchange as well as those bonds traded in foreign stock markets. The coefficient is not significant in this case, but the magnitude seems to be within the range of our previous estimates. We believe that some of the domestic bond issues may be less sensitive to revenues per capita at the state level because of the lower liquidity in the Rio de Janeiro stock market or due to the fact that state governments could push some of the local debt to domestic elites in exchange for political favours. In those cases the indicators of capacity to pay may be less relevant to determine the yield. What is more interesting is why some states were able to issue bonds abroad and others did not even pass the minimum threshold to do so. Finally, in specifications 10 and 11 we run similar specifications but using panel-corrected standard errors (PCSE) and feasible generalised least squares (FGLS). Both methods help us to account for heteroskedasticity, while PCSE also corrects for contemporaneous correlation (e.g. contagion among states). In both cases we find a coefficient close to 0.3 that is fairly close to our regular OLS coefficient (0.21–0.26).
Since using OLS may have potential endogeneity problems and serial correlation, in this section we also run an instrumental variable (IV) estimation using the variation in international commodity prices as the main source of exogenous variation. We believe that there is potential endogeneity in the OLS estimates because the yield that investors assigned to each bond issue was based on the expectations they had about that country's capacity to either export or to obtain revenues in gold or silver (when silver was valuable). The problem is that the capacity that countries had to export and/or collect revenue depended to a large extent on the infrastructure that was put in place to integrate markets or facilitate trade. Thus, a lower cost of capital could lead to a larger debt burden to finance infrastructure. More infrastructure expenditures could lead to higher revenues as economic activity increases. Higher revenues or exports would make investors more confident of the repayment prospects of the debt, which in turn would lower yields (the cost of capital) even further. It is for this reason that we believe perhaps an instrumental variable approach is in order to reduce the potential endogeneity problem, not to mention the problems we may have with serial correlation.
In order to address this potential endogeneity problem in the case of Brazil we would want to find a variable that affected the cost of capital, but through revenues per capita alone. Since a lot of the revenue came from the taxes on commodity exports, we would want to find an exogenous factor that determined the export capacity of every state (without affecting bond yields directly). Ideally we would want to explain the variation in state revenues per capita across states by using factors that exogenously determine the states capacity to export commodities, such as geographical or climate-related variables, as well as some variables that could account for the variation over time in the demand for state commodities. This is quite a daunting task since taking fixed factors that explain what commodities were produced (e.g. soil types or altitudes) is not going to help us explain the variation over time. Moreover, since exports followed cycles determined either by international demand or by internal changes in weather conditions, we need to find a variable that summarises both the conditions that determined the crop or commodity mix by state and the variation in the volume and mix over time. Therefore, we look for an alternative way to create an instrument.
Panel A of Table 3 shows the correlations between our geographical and climatic variables with the export share of each commodity (to total exports). We can see that there are some high correlations between some of these geographical (exogenous) variables and the kind of commodities states specialised in. We then assume that the export shares or commodity mix reflect this heterogeneity across states.
In order to capture the variation over time in the volume of exports and possible variations in the commodity mix we use the export shares by states at the beginning of our period as weights for a series of simulated export price indices by state. We want to take the commodity mix by state at the beginning of our period because it could be indirectly driven by the cost of capital (e.g. through the infrastructure investments that states with low cost of capital made). We are confident that the shares of exports that we use as the initial point are exogenous to the cost of capital faced by states in international markets after 1901. This is because the first year with available data for commodity exports at state level is 1901. Most of the state foreign bonds were issued after 1901. Moreover, there is no evidence of compositional changes in the state exports during the 1890s, so 1901 should be representative of the state of commodity exports in 1890.
Once we have the commodity mix, we use the growth in international commodity prices to simulate the price received by the exporters at state level. We use the international price for the main commodities produced by Brazilian states as reported in Global Financial Data. We lose accuracy by taking generic or average prices for some commodities that had different varieties. Yet the prices of, for instance, the different varieties of coffee and rubber move in tandem. That is why we feel our simulated price indices reflect variation over time in export prices for Brazil accurately.
The strategy to simulate a price index of commodity exports for each state is as follows. Brazil has I commodities, i = 1,…,8, there are J states, j = 1,…., 18, and we have T periods t = 0,…., T; where t = 0 represents 1901. SH ij0 is the export share of commodity i at the beginning of the period (t = 0) for state j. We have the international prices for each commodity pit at dollars. We transform it, using the exchange rate mil reis/dollar, into mil reis.Footnote 29 Then we calculate the growth rate (g) of international prices for each commodity, which is defined as g it= [(p it − p it−1)/(p it−1) − 1], where i and t are defined as usual. Then we use g it to predict prices at state level using SH ij0 as weights for a weighted price index per state, following this formula:
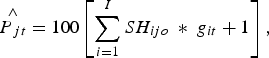
where  is the index price for state j at period t. For each of the indices, 1901 is the base year (1901 = 100). Once we have a price index
 for each state, we use it as a simulated instrument for state public revenue per capita in the first stage. The idea is that our price indices per state will reflect how much states can extract in ad valorem taxes on exports. In the second stage, we use our estimated state public revenues per capita as independent variable to estimate the cost of capital or spread of the states that traded bonds in international markets.
Our simulated export price indices assume that states did not influence the growth rate of prices in international markets. This was not necessarily the case since São Paulo, Minas Gerais and Rio de Janeiro were price setters in the international coffee market for a few years (especially 1906 to 1914 and the late 1920s). The same may be argued for Amazonas and Pará which enjoyed a monopoly position in the international rubber market until the surge of competition from Asian countries before World War I. In order to deal with this potential endogeneity in prices, we construct alternative price indexes ignoring the price fluctuations for coffee and rubber. Alternatively, in some specifications we added a dummy to control for rubber and coffee states (in separate specifications). This is to control for the fact that Brazil had market power in these two commodities, even if its coffee producers were the only ones to exercise it actively.
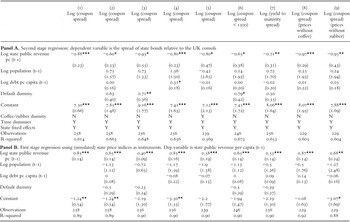
The results of the simulated instruments estimation are presented in Table 8. While panel A of this table shows the second stage of the regression, panel B shows the first stage. The results confirm our hypotheses because state public revenue responds consistently to changes in the international prices. The intuition of panel B, the first stage, is that higher prices in the commodities exported by state implied higher total exports and higher state revenues.Footnote 30 Because the estimations take the logarithm of the variables, the coefficients should be interpreted as elasticities. For instance, specification 2 shows that a 100 per cent increase in the state price index would imply that states would get 65 per cent more in public revenues (per capita). This is not a farfetched counterfactual since, on average, commodity prices increased almost 130 per cent from 1890 to 1899 and about 43 per cent from 1890 to 1909 (in mil reis). The sign and significance of the coefficients in Panel B is consistent with our specification (positive and significant) and fluctuate between 0.40 and 0.85.
Log coupon spreads (Brazil states 1891–1928): two-stage least squares estimates. Panel A shows the first stage where the dependent variable is the logarithm of the lag (t-1) of state public revenue per capita, using the logarithm of the our simulated commodity price index as instrument (lagged one year). The dependent variable in the second stage is the logarithm of the yield of state debt bonds relative to the UK consol yield in basis points. The hypothesis tested is that those states with higher revenue collection have lower cost of capital. A negative sign in the logarithm of the lagged state public revenue per capita confirms our hypothesis and it is interpreted as an elasticity. Clustered robust standard errors are reported in parenthesis.

*** indicates significant at 1%, ** at 5% and * at 10%.
Panel A of Table 8 shows the effects of the instrumented state public revenue per capita on the cost of capital that Brazilian states faced between 1900 and 1928 in the second stage regression. The results confirm our OLS estimations as the coefficient for state public revenue per capita is significant and negative in all the specifications. Specifications 1 to 5 show the results for the whole sample with different controls. The elasticity varies from -0.60 and -0.95, indicating that a 10 per cent change in state public revenue per capita could reduce the cost of capital by between 25 and 50 basis points, on average (i.e. because of the multiplication of the coefficients 0.5 and 0.95 times 10, times the average cost of capital which is 510 bps). Our results, however, have one important difference from the OLS estimates. We find larger coefficients in the IV regression than in the OLS estimate. This could be confusing if we think that the bias we are trying to correct for is endogeneity (i.e. endogeneity in the OLS estimates would imply a bias upwards for our coefficient of interest). In that case we would expect to find lower coefficients in the IV regression than in the OLS estimates. Therefore, we think our IV regressions uncover an important finding. More than looking at revenues per se, it seems as if investors cared more about how movements in commodity prices would affect capacity to pay and, thus, calculated their default risk of state bonds (the yield minus the yield of British consols) accordingly.
Moreover, investors seem to have been more worried about commodity prices in states other than coffee and rubber states. Specifications 8 and 9 of panel A (Table 8) show how we get larger elasticities when we run the same regressions excluding the fluctuations in the price of coffee and rubber, products in which São Paulo, Amazonas and Pará arguably had significant market power. That is, we assume that rubber and coffee were not exported at all and we reweight the price indices using the other commodities states exported (for lack of data the state of Minas Gerais gets dropped from that specification). We find coefficients of -0.97 when we exclude coffee and -0.95 when we exclude rubber. This implies that investors cared more about commodity price fluctuations for states that were less developed and less diversified than São Paulo and Amazonas. The former was the most diversified and industrialised state in Brazil, thus it makes sense to think that investors cared less about coffee prices when they made their estimates of the yields. In the case of Amazonas the logic is harder to explain, but it probably has to do with the fact that Amazonas was the state that spent more on public goods per capita, e.g. education, during the period we study. That is, it was probably perceived as too rich to be affected by year-on-year price fluctuations. Even if this last explanation is not the right one, the econometric results show that investors were less influenced by price movements when valuing the bonds of those states.
In specifications 6 through 7 of the same table we run further robustness checks. First we use yield to maturity as the dependent variable and the coefficient is -0.71, very close to our estimates with the coupon yields. We also include the sample of yields that are lower than 1500 bps, to eliminate states that defaulted, we get similar results (the coefficient is -0.65, but only significant at 10 per cent). This last result may be explained because we have weeded out the variation that comes from a bad reputation as a debtor, since in most specifications we control for whether the state has defaulted in the past.
V
The results of our study show that the cost of capital for Brazilian states and the probability of issuing state debt in international capital markets were highly correlated with state revenues per capita. Our argument is that revenues per capita are highly correlated with exports per capita by state and that the level of exports per capita actually depended on the kind of commodities each state was able to export between 1890 and 1930. We argue that the relationship among endowments and the cost of capital for states or the capacity to issue debt may have led to marked differences in access to capital and in the capacity that states had to spend on public goods. Since differences in expenditures on public goods can lead to market differences in economic development among states, we believe that the setup of the 1891 constitution promoted some of the regional inequality that we still observe today in Brazil. That is, the commodity lottery mattered in Brazil because the trade boom allowed state governments to increase current expenditures in large projects by issuing debt.
In our view, then, this article shows that endowments matter beyond just colonial institutions, because trade shocks that took place centuries later facilitated the job of state governments to spend on public goods. Most of the debt was actually used to pay for infrastructure projects, so we believe the trade shock had a positive long-lasting effect on productivity for the Brazilian states that reaped the benefits of the commodity boom. Yet, more research is needed to prove the actual effects of the trade shock over productivity and income per capita in the long run.
The episode we studied matters for Brazilian history because after 1930 the government of Getulio Vargas changed the federalist pact, and named some of his allies as supervisors of the actions of state governments. Moreover, after 1928 Brazilian states defaulted en masse and the federal government had to assume all state debts. That was the end of state debt issues in international markets. By 1934 a new constitution was drafted and in 1937 Vargas himself rewrote the constitution to give the central government more powers, including a new fiscal setup that destroyed the federalist pact of 1891–1930.
Finally, if we extrapolate some of the implications of our findings to the literature that studies the cost of capital for countries, our article suggests that we should look at why some countries had more capacity to pay than others and that, at least for the nineteenth century, the answer may lie in the capacity that some countries had to export commodities that were in high demand and that had significant price increases during the commodity boom of the late nineteenth century.
Appendix A. Cox hazard and probit estimates to deal with biases in our data
In this appendix we present two approaches to examine the propensity or probability of Brazilian states to issue bonds in any given year between 1890 and 1930. Since the sample used for the article contains only the states that actually issued bonds abroad, we want to check if the bias in the sample selection poses problems for the relationship we are trying to draw between state revenue per capita and the cost of capital. Below we develop two estimates to examine the relationship between capacity to pay, using state revenue per capita, and the probability of issuing debt in foreign markets, including data for all of the states in the Brazilian federation.
Methodology
Our first approach to study how much state public revenue per capita affects the probability of issuing debt is very simple. We run a probit estimate to examine whether richer states had higher probability to be actively engaged in the international bond market. The basic specification for this estimation is:

where Y it−1 is a dummy variable that takes the value of one if the state i issues a bond in period t, and zero otherwise. The independent variable is the logarithm of state public revenue per capita (s it−1) lagged one period. We use the one period lag of the state public revenue because the expectations of the value of the bond and its yield are formed with the information available at the time of buying the debt instrument in the secondary market. The vector of control variables X includes imports (also lagged one period), population and debt burden. In some specifications we control for the years in which Brazil was on the gold standard. Imports and population are used to control as a proxy for the demand for public goods, which is supposed to be the final use of the capital derived from the bond issues. On the other hand, the state budget deficit is measured as the percentage of the difference between the state public expenditure and state public revenue divided by the state public revenue. This ratio could be interpreted as a proxy of risk as it may be interpreted as a measure of how responsible each state is in the administration of its finances, but at the same time it could just reflect the fact that some states were able to sustain deficits precisely because they issued debt. Thus we do not make too much out of the interpretation of this coefficient. Finally we add time dummy variables (φt) to control for time fixed effects common for all the states.
Now, since the states that issued debt may be biasing the results of the Probit (given how skewed the data is, with some states issuing debt many times and some issuing nothing), we also run a Cox proportional hazard model to look at whether the relationship between state revenue per capita and the probability of issuing debt is still intact once the sample is less biased in favour of debt-issuing states. The Cox hazard model has the advantage of only taking into account the effect of issuing states up until the point where they issue debt for the first time, leaving them out of the estimation afterwards. We define the dependent variable as the time in years until the state issues a bond in international markets and examine the change in relative risk of issuing the first bond by state i, in any given year t, if the state had an additional unit of state public revenue per capita. The estimated model is as follows:

where h o(t) is the baseline hazard function, which is common for all states, it has no particular specification, and provides the shape of the hazard function. h i(t) is the hazard function specific to the state i. We are interested in the relative risk of state i issuing a foreign bond in any year relative to the baseline risk (common to all the states) of issuing a bond in foreign markets in any given year. Since the Cox model is exponential, we take the log of all of our variables to avoid negative probabilities. In our case, we are interested in the value and sign of the parameter β1, which indicates the effect of an additional unit of state public revenue, lagged one period, on the relative risk of issuing for first time a bond relative to the baseline risk of any state issuing foreign bonds in any given year.
In sum, the reason why we run these two estimations, one with a Cox hazard model and another one with a probit, is that they allow us to include all the states of Brazil in the sample (those which issued debt and those that did not). Also, because of the way we design the Cox hazard model test, we give more weight to the states that never issued debt, thus giving us a less biased view of the importance of state revenues per capita on the capacity to issue bonds in foreign markets.
Findings
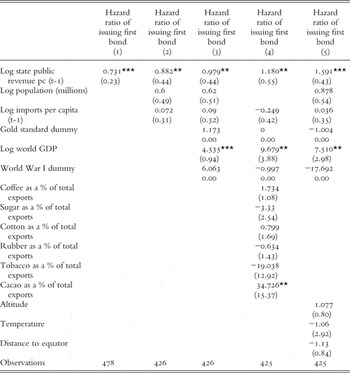
Table A1 shows the result for the Cox hazard model estimations. We can see that state public revenue per capita has a consistent, positive and significant effect over the hazard rate of issuing a new bond. In the last regression we control for the size of the debt burden using the debt/exports ratio, which reduced considerably our sample, and the coefficient still has the expected sign and it is significant at 10 per cent. The coefficient in the lag of the state public revenue indicates that those states collecting an additional unit of revenue increase their relative risk of issuing their first international bond in any year by a range between 0.036 and 0.089 (3 and 8 per cent respectively).
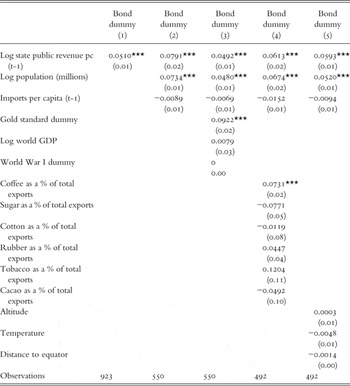
We find similar conclusions in the probit estimations (Table A2). The marginal effect of increasing the public revenue per capita infinitesimally increased the probability of issuing an international bond by a range between 0.049 and 0.079 per cent. The significance of this coefficient is consistent at 5 per cent significant level and the size does not change after we include a variety of controls. Unlike the Cox estimations, we find that the size of the population also increased the probability of issuing a bond. It also seems that having a high cost of capital in the past or a history of default was taken into account by investors and made it more difficult for defaulting states to issue new bonds. In sum, our findings show that effectively those states with higher capacity to collect tax revenue increased considerably the likelihood of issuing bonds in international markets.
Cox hazard model estimates. Dependent variable is the relative hazard ratio of issuing a state bond for the first time in the international capital markets between 1890 and 1931. The hypothesis is that high capacity to collect revenue increases the likelihood that a state will issue its first bond earlier. A positive sign in the coefficient for the logarithm of lag state public revenue per capita would confirm our hypothesis. Clustered robust standard errors in parentheses.

*** indicates significant at 1%, ** at 5% and * at 10%.
Probit estimates of the probability of issuing a bond in a given year for any given state. Dependent variable is a dummy indicating 1 if a state issues a bond in year t, or zero otherwise. The hypothesis is that states with high capacity to collect revenue have higher probability of issuing a bond at any point in time. A positive sign in the coefficient for the lag of state public revenue per capita would confirm our hypothesis.Regressions 2 to 5 include year dummies. Robust standard errors clustered at state level appear in parentheses. This table reports marginal effects only. For a definition of the controls see Appendix B.

*** indicates significant at 1%, ** at 5%, and * at 10%.
Sources and methodology to construct the dataset

aWe have information only for states that had customs offices and a port (or a navigable river that connected it to the ocean). For this reason, we originally had no data for Goiás (GO) and Minas Gerais (MG). Yet for Minas Gerais we have some reports of total exports, but not from which port they were shipped. We now know that most of the exports were shipped from Rio de Janeiro (RJ), Santos (in São Paulo, SP) and, in the 1920s, through Espírito Santo (ES). For simplicity we assume that the exports of MG were exported through RJ and SP in equal proportions. Thus we subtract the exports from MG from those two other states. For the MG export data for 1927–31, we assume that the MG average export share between 1923 and 1927 will prevail for the rest of the studied period and we proceed with the same methodology as explained above. In order to show that results of the estimations do not change, we also use the exports as reported by the federal publications (excluding MG). Unfortunately, data for imports for MG are not available. Therefore, all the estimations that include imports as a control exclude the observations from MG.
bThe city of Rio de Janeiro was the capital of Brazil, known as Federal District (Distrito Federal or DF). Rio de Janeiro city is in the middle of what was Rio de Janeiro state, now Guanabara. Both the city and the state collected their own tax revenue, yet export taxes collected in the port of Rio de Janeiro accrued mostly to the state of Rio, while import taxes accrued to the Federal Government, as in other parts of the country. Moreover, the port of Rio de Janeiro, in the Federal District, served the states of Rio de Janeiro and Minas Gerais. Rio de Janeiro state had no other port until the 1920s (i.e. Angra dos Reis). Therefore, we cannot distinguish the exports made from the capital itself and Rio de Janeiro state (or Minas Gerais, see note above). We are confident, however, that most of the exports shipped from the Rio de Janeiro port were commodities produced in the state of Rio de Janeiro and not in the federal district. Furthermore, we consider that the state of Rio de Janeiro benefited from the exports and economic activity of the port of the city of Rio de Janeiro and vice versa, and for this reason we use the same level of international trade activity for both state and city.