I. INTRODUCTION
Compared with other fuel cell types, solid-oxide fuel cells (SOFCs) have high-power efficiency and excellent long-term performance stability and are an environmentally friendly alternative to conventional energy-conversion devices.Reference Steel1 Currently, the high internal resistance (IR) loss of electrolyte requires high operating temperature in SOFCs. To tackle this problem, there are several main approaches, including an increase in the ionic conductivity of the electrolyte by searching for new electrolyte materials such as gadolinia-doped ceria (GDC) and La1−xSrxGa1−yMgyO3−δ (LSGM),Reference Suzuki, Kosacki and Anderson2–Reference Ishihara, Shibayama, Honda, Nishiguchi and Takita7 reducing the thickness of electrolyte,Reference Kim, Virkar, Fung, Mehta and Singhal8–Reference Maric, Ohara, Fukui, Yoshida, Nishimura, Inagaki and Miura10 and decreasing electrode polarization resistance.Reference Xia and Liu11, Reference Ishihara, Sato and Takita12 Some of the most successful approaches to reduce the operating temperature are to grow thinner electrolyte using thin-film fabrication technique and to select new electrolyte materials with higher ion conductivity.Reference Kilner13
From the materials selection viewpoint, yttria-stabilized zirconia (YSZ) is one of the well-known electrolytes for SOFC applications. To achieve sufficiently high ion conductivity, a high operating temperature, typically around 1000 °C, is required, which severely limits the material selections on other components and decrease the long-term stability of SOFCs.Reference de Souza, Visco and de Jonghe14 Recently, GDC is studied as a promising candidate for electrolyte. It has higher ionic conductivity than that of YSZ in the intermediate/low-temperature range of 400 to 700 °C and a thermal expansion coefficient that closely matches with many metallic materials as well. This allows more flexibility in the materials selection of electrodes and interconnects, thermal stress reduction in active ceramic structures as well as a longer lifetime of the cells. Considerable effort has been made on the demonstration of low-temperature SOFCs based on thin-film electrolyte of doped ceria (CeO2).Reference Xia, Chen and Liu15, Reference Jiang, Leng, Chan and Khor16 The microstructure of the GDC thin electrolyte layer can be well controlled by varying the deposition parameters in thin-film deposition technique. Therefore, a systematic study to correlate microstructure (e.g., grain-boundary structure) and the ionic conductivity is in great need for implementing GDC thin-film electrolytes in SOFCs.
Several studies have been previously conducted on the electrical and microstructural properties of GDC electrolytes processed by various thin-film deposition techniques such as spray pyrolysis,Reference Rupp and Gauckler17 RF reactive magnetron sputtering,Reference Chiodelli, Malavasi, Massarotti, Mustarelli and Quartarone6, Reference Kuo, Lee, Chen and Liang18 pulsed laser deposition (PLD),Reference Chen, Chen, Chen, Donner, Liu, Lin, Huang and Jacobson19–Reference Infortuna, Harvey and Gauckler21 etc. Chen et al. demonstrated the Ce0.80Gd0.20O2−δ (GDC20) thin films with cube-on-cube epitaxy on MgO (001) substrates by PLD. It was reported that the electrical conductivity of Ce0.80Gd0.20O2−δ (GDC20) film is predominately ionic conductor under  in the range from 10−19atm to 1 atm.Reference Chen, Chen, Chen, Donner, Liu, Lin, Huang and Jacobson19 Joo and Choi investigated the nanocrystalline GDC20 thin films with (111), (200), and (111) orientations on Pt (111) and sapphire (0001) substrates under a low oxygen partial pressure (~50 mTorr) at 500 and 700 °C by PLD and performed the electrical conductivity measurements on GDC20 thin film in plane and across plane.Reference Joo and Choi20 Infortuna et al. examined the microstructure evolution of GDC and YSZ thin films by PLD as functions of deposition temperature (room temperature (RT) ~900 °C) and oxygen partial pressure (20–300 mTorr).Reference Infortuna, Harvey and Gauckler21 However, a systematic study on correlating the electrical properties of the GDC films with their grain sizes and grain morphologies was lacking.
In this paper, we present the deposition of GDC thin films with different grain sizes using a PLD method commonly used to deposit complex ceramic materials with the same or similar stoichiometry as the target material.Reference Rodrigo, Knudsen, Pryds, Schou and Linderoth22 Specifically, we explored the grain size of the GDC films from nanocrystalline to epitaxial thin films by controlling the growth temperature. A detailed microstructural characterization was conducted and correlated with the electrochemical properties of the films as functions of grain size and grain morphologies.
II. EXPERIMENTAL
The depositions of the GDC electrolyte layers were conducted under oxygen partial pressure in the PLD chamber with a KrF excimer laser (Lambda Physik 210, California, USA, λ = 248 nm, 5 Hz, O2 pressure of 200 mTorr). The laser beam was focused to obtain an energy density of approximately 5 J/cm2 at 45° angle of incidence. For preparing the pressed target of Ce0.9Gd0.1O1.95, the commercial GDC powder (500 nm, Praxair Inc., NY) was pressed into disk under uniaxial pressure using a 31 mm die set. The disk was then sintered at 1200 °C for 10 h with flowing oxygen. Various substrates including YSZ (001) and MgO (001) were selected for this work. The substrate temperature was varied from RT to 700 °C to control the grain size of the film.Reference Wang, Sharma and Kvit23 The thin-film growth rate of the GDC was 6.8, 3.6, 2.8, and 2.1 Ǻ/s under an oxygen partial pressure of about 200 mTorr at the deposition temperature of RT, 300, 500, and 700 °C, respectively. Microstructural characterizations were performed by X-ray diffraction (XRD, Bruker, WI) and cross-sectional TEM using a JEOL2010 analytical electron microscope and a JEOL-3000F analytical electron microscope (Tokyo, Japan) with a point-to-point resolution of 0.18 nm. Surface morphology study for the thin films was conducted by atomic force microscope (AFM, Digital Instruments Nanoscope, CA) and scanning electron microscope (SEM, JEOL JSM-6400, Tokyo, Japan). For the electrochemical cells, two rectangular platinum strips (Heraeus CL11-5100, Pt ink, Hanau, Germany) on the GDC thin film were prepared by screen printing method and then the sample was baked on a hot plate at 100 °C for 10 min. Platinum grids as current collectors were attached onto the top of platinum electrodes on the GDC thin film. The conductivity measurements of films were examined using DC four-probe method and impedance analyzer (Gamry Instrument, PA), Solartron potentiostat (Hampshire, United Kingdom) in the frequency range of 10−1 to 30 MHz under pure oxygen from 400 to 800 °C. More details on the measurements can be found elsewhere.Reference Yoon, Araujo, Grunbaum, Baque, Serquis, Caneiro, Zhang and Wang24, Reference Yoon, Cho, Kim, Lee, Bi, Serquis, Zhang, Manthiram and Wang25
III. RESULTS AND DISCUSSION
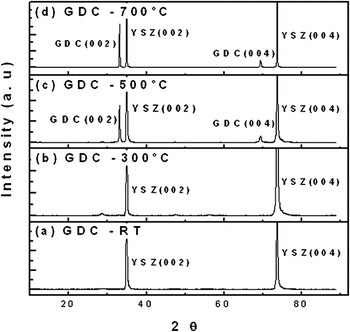
Figure 1 shows the XRD patterns of the GDC thin film samples containing 10 mol% of gadolinia deposited at RT, 300, 500, and 700 °C on YSZ (001) single-crystal substrates. The XRD pattern revealed that textured growth starts at 500 °C, and strong (00l) GDC peaks (both (002) and (004) peaks) can be observed at 700 °C. No secondary or impurity phases were detected in the films. It suggests that at the given doping concentration of gadolinia, the deposition temperature of 500 °C is adequate to ensure the formation of highly textured GDC thin films along (00l) orientation. The crystallinity of the films increases with increasing substrate temperature as evidenced by the increasing peak intensity of (002) and (004) GDC peaks. It is interesting to note that GDC on YSZ still maintains a cube-on-cube matching relation, even though YSZ (a = 5.147 nm) has a large lattice mismatch with GDC (a = 5.418 nm). The lattice mismatch is about 5%. Based on the GDC (002) and (004) peak positions, the calculated lattice parameter of the GDC thin films is 5.412 nm. The large lattice mismatch could be accommodated by domain matching epitaxy where 20 lattices of (004)YSZ match with 19 lattices of (004)GDC. The residual lattice mismatch is 0.05%, and the misfit dislocation spacing is ~5 nm. The XRD results of GDC films on MgO substrates (not shown here) are very similar to that of GDC films on YSZ with highly textured GDC thin films along (00l) orientation for the samples deposited higher than 500 °C.
XRD patterns of GDC thin films deposited on YSZ substrates at various temperatures.

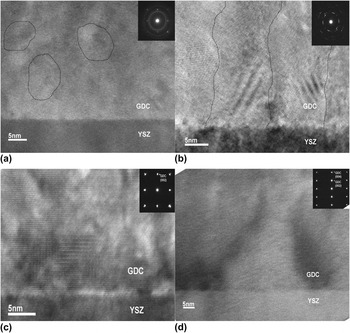
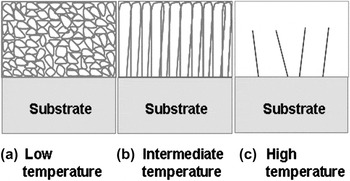
To observe the microstructure evolution across the film thickness, we conducted a detailed cross-sectional TEM study for all of the GDC films on single-crystal YSZ substrates, as shown in Fig. 2. The microstructure features observed in the films are summarized in the schematic overview in Fig. 3. At room temperature [Fig. 2(a)], the grain size is in the range of 5–10 nm due to the limited adatom surface mobility at low temperatures. The grains are randomly oriented as evidenced by the nanosized grains in the TEM image and the ring pattern in the corresponding selected area diffraction pattern [SAD, inset in Fig. 2(a)]. By increasing deposition temperature, the grain size increases obviously and the grains show more columnar structure. As the deposition temperature increases to 500 and 700 °C, highly epitaxial film starts to form as shown in Figs. 2(c) and 2(d). The obvious matching relation was found in the inserted SAD patterns in Figs. 2(c) and 2(d), which is a clear cube-on-cube matching relation without any rotation in axis. It is noted that the films are very dense and free from cracks and pores from the cross-sectional images. Overall the microstructural features identified in TEM are consistent with the XRD results.
High-resolution cross-section TEM images of GDC thin films deposited at (a) RT, (b) 300 °C, (c) 500 °C, and (d) 700 °C.

Diagram of the thin-film growth as a function of deposition temperature (a) nanocrystalline structure, (b) columnar structure, and (c) epitaxial structure.

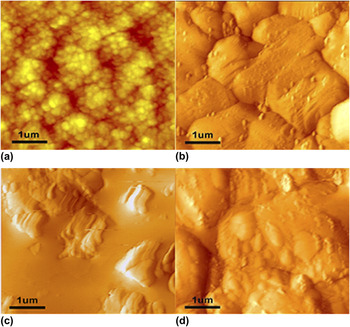
The surface morphology of the GDC thin films was observed by AFM. Figures 4(a)–4(d) show the AFM images of the GDC thin films deposited on YSZ substrates at RT, 300, 500, and 700 °C, respectively. An apparent difference between the RT sample and all the others (300–700 °C) is that the RT sample shows much smaller grains and the grains are more isolated, which leads to a relatively porous surface structure. The average grain size of the RT sample is about 90 nm or smaller based on the surface morphology. However, the samples deposited at high temperatures show much larger grains that are well connected into large domain structures. The average domain size for the samples varied from 1 μm (300 °C) to 3 μm (700 °C). The increased grain/domain size occurs because of the increased adatom surface mobility at higher substrate temperatures.
AFM images (5 × 5 μm in scan size) of microstructural GDC thin films deposited at (a) RT, (b) 300 °C, (c) 500 °C, and (d) 700 °C on YSZ substrates.

A schematic of grain morphology of the GDC thin films as a function of substrate temperature is given in Fig. 3 based on the TEM and AFM observations. At low temperature (a), nanocrystalline films with some porosity can be formed because of the limited surface mobility of the adatoms. As the deposition temperature increases, a columnar grain structure forms because the mobility of adatoms at intermediate temperature (b) is still quite limited. As the deposition temperature increases to even higher (c), epitaxial films form. The thickness of the GDC films on the YSZ substrates varied in the range between 500 and 700 nm at different growth temperatures. Thin-film growth depends on multiple parameters such as target-to-substrate distance, substrate temperature, laser ablation energy, and background oxygen pressure. Among those deposition parameters, substrate temperature is found to be one of the most critical factors in determining the film morphology and microstructure.
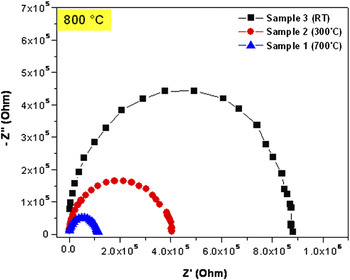
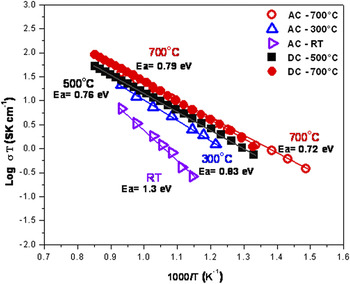
To explore the effect of the grain size and grain boundary on the electrical properties of the GDC thin film as a function of deposition temperature, the films were deposited on MgO (001) single-crystal substrates. Because of its high electrical resistivity, MgO has been widely used as the substrate for electrochemical analysis of thin film samples. Both alternating-current (AC) and direct-current (DC) measurements of the GDC thin films on MgO substrates were performed using the in-plane geometry under air in the temperature range of 400 to 800 °C. Figure 5 plots the AC impedance spectra of samples deposited at RT, 300, and 700 °C. The measurement temperature was 800 °C. The general trend is that the total resistance of the GDC thin film decreases significantly as the deposition temperature increases. Our previous study showed that the high-frequency arc is attributed to the grain-boundary resistance of a bulk GDC cell (Pt/GDC/Pt) at low temperature.Reference Yoon, Araujo, Grunbaum, Baque, Serquis, Caneiro, Zhang and Wang24, Reference Yoon, Cho, Kim, Lee, Bi, Serquis, Zhang, Manthiram and Wang25 However, the intragrain and grain-boundary resistances of GDC thin-film electrolyte are difficult to separate from their AC impedance spectra because of the short time constant and cell geometry. The appearance of one single arc in Nyquist plot is for the thin-film electrolyte or nanoscaled electrolyte material according to literatures.Reference Kuo, Lee, Chen and Liang18, Reference Joo and Choi20, Reference Zhou, Huebner, Kosacki and Anderson26 Arrhenius plots of total conductivity versus reciprocal temperature for all of the GDC thin film samples are plotted in Fig. 6. The solid symbols are for DC electrical measurements and the open symbols are for AC impedance measurements. First, it is interesting to note that the total conductivity results of AC and DC measurements are in good agreement with the sample deposited at 700 °C. One of the main reasons both AC and DC measurements were used for this study is that the GDC samples deposited at RT and 300 °C show very high resistivity during DC conductivity measurement and the measurements could not be completed. A complementary study combining both AC and DC measurements allows a thorough comparison between all samples. Second, it shows that the sample deposited at 700 °C has higher conductivity (7.3 × 10⁻³ S/cm at 600 °C) with lower activation energy (>0.72 eV) than the ones deposited at RT (3.6 × 10⁻⁴ S/cm at 600 °C, <1.3 eV). In other words, the total conductivity of the films deposited at high temperature (700 °C) is about 20 times higher than the ones deposited at RT at the measurement temperature of 600 °C. It has been reported the grain-boundary conductivity has higher activation energy (>1 eV) compared with that obtained from intragrain conductivity (~0.64 eV) because of defect and impurity segregation in the vicinity of grain boundaries,Reference Steel1, Reference Hui, Roller, Zhang, Petit, Xie, Maric and Ghosh27, Reference Barsoukov and Macdonald28 which results in a higher conductivity for the GDC films deposited at high temperatures with less grain boundaries. The GDC thin film deposited at 700 °C (grain size: ~3 μm) shows an activation energy of 0.72 eV indicating that the overall conductivity is mainly contributed by the intragrain conductivity. Compared with previous reports on GDC films prepared by similar processing methods,Reference Chiodelli, Malavasi, Massarotti, Mustarelli and Quartarone6, Reference Kuo, Lee, Chen and Liang18–Reference Joo and Choi20, Reference Zhou, Huebner, Kosacki and Anderson26 the GDC films in this study show a relatively higher value of the overall conductivity with a lower activation energy. As the substrate temperature decreases of the GDC thin film, the total conductivity decreases and the activation energy increases because of the poor grain connectivity and the increasing contribution of grain-boundary resistivity. For example, the sample deposited at RT has the smallest grain size with poor grain connectivity that limits the transport of ions through the grain boundaries [Figs. 2(a) and 4(a)]. This results in the low conductivity in nanocrystalline grains deposited at RT.
AC impedance spectra of Nyquist plots of GDC thin films.

Arrhenius plots of total conductivities of GDC thin films as a function of deposition temperature.

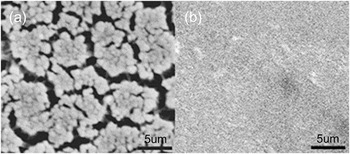
Another observation is the different surface morphologies for the samples deposited at different temperatures after the electrical measurement. As shown in Fig. 7(a), the plan-view SEM image of the film deposited at RT shows obvious microcrack formation after the measurement possibly due to the densification of the grains and grain boundaries during high-temperature measurement. The surface remains smooth and crack-free for the samples deposited at higher temperatures [Fig. 7(b)]. This again proves that the low conductivity in the RT sample is due to the poor grain connectivity and the large amount of grain boundaries.
Plan-view SEM images of GDC thin films deposited at (a) RT, and (b) 500 °C after electrical measurement from 400 to 800 °C.

IV. CONCLUSIONS
We have successfully processed GDC thin-film electrolyte with different grain sizes at various deposition temperatures. The crystallinity of the films has been found to increase with increasing substrate temperature. The GDC thin film deposited above 500 °C starts to show epitaxial growth on YSZ substrates. The series of electrical property measurements such as AC and DC measurements as functions of temperature and grain size show that the films with large grains (deposited at higher temperatures) have higher conductivity and lower activation energy than the films with small grains and poor grain connectivity (deposited at lower temperatures). For example, the overall conductivity of the GDC films deposited at 700 °C is about 20 times of that in the RT sample. The present study suggests that substrate temperature significantly influences the microstructure of the GDC films (i.e., grain size and grain morphologies) and its overall electrical properties including ionic conductivity.
ACKNOWLEDGMENTS
Part of the work was funded by National Science Foundation (NSF 0709831 and NSF 1007969), United States Air Force Office of Scientific Research (Contract Nos.: FA9550-07-1-0108 and FA9550-09-1-0114), and DOE Center for Integrated Nanotechnologies (CINT). The work at the University of Texas at Austin was funded by Welch Foundation (Grant No.: F-1254).