I. INTRODUCTION
Electropulsing treatment (EPT), as a new developing process, has been found to greatly change the recrystallization behaviors of various alloys. Reference Baranov, Gromov, Tang, Gromov and Tang.1,Reference Gromov, Gromov and Tang.2 Conrad et al. Reference Conrad, Karam and Mannan3,Reference Conrad, Sprecher, Cao, Lu, Merchant, Crane and Chia4 found that electropulsing could enhance the nucleation rate of recrystallization and refine the grain size of copper. Xu et al. Reference Xu, Tang, Ding, Tian and Tian5,Reference Zhou, Xiao and Guo6 obtained ultra-fine recrystallization grains in the cold-rolled AZ31 and brass strip by EPT. Hu et al. Reference Hu, Tang, Zhu and Shek7 found that the Goss texture is favorable to form under an adequate electropulsing in the cold-rolled Fe–3Si alloy strip. In addition, some mechanisms were proposed to explain the effects of EPT on recrystallization. Sprecher et al. Reference Sprecher, Mannan and Conrad8 proposed that an electron wind force induced by electropulsing can assist the mobility of dislocation. Du et al. Reference Du, Yin, Liu, Wang and Guo9 pointed out that the transient thermal compressive stress caused by EPT can enhance the nucleation rate. Guan et al. Reference Guan, Tang, Jiang and Chu10 proposed that an extra driving force caused by electropulsing can increase the velocity of the moving boundary. However, the understanding of the mechanism pertaining to the effects of electropulsing on recrystallization, especially the relationship between deformation microstructure and recrystallization texture, is still rudimentary.
Ni-W alloys are usually considered as the most promising substrates for the production of high temperature superconducting tapes due to their good formability and thermal stability. Reference Eickemeyer, Selbmann, Optiz, Maher and Prusseit11 At present, Ni5W alloy represents the favorite substrate material. However, the Ni5W substrate leads to alternating current losses in the application, since it is ferromagnetic at 77 K. Reference Claassen and Thieme12 As the content of W element increases, the Curie temperature decreases. When the content of W reaches ∼9%, the alloy is nonmagnetic at 77 K. Thus, Ni9W is one of the most promising materials to replace the Ni5W alloy. Reference Eickemeyer, Hühne, Güth, Rodig, Gaitzsch, Freudenberger, Schultz and Holzapfel13,Reference Yu and Liu14 The recrystallization microstructure and texture, which greatly affect the final superconductivity, are significantly affected by the annealing conditions. Reference Subramanya Sarma, Eickemeyer, Schultz and Holzapfel15 Thus, a study on the recrystallization behavior of Ni9W under EPT has great technological importance. Moreover, as a typical low stack fault energy (SFE) alloy, Ni9W has an inhomogeneous deformation structure, including twinning, shear band, etc. It is thus an ideal model material to study the recrystallization behaviors of different deformed regions under EPT.
In the present work, the effects of EPT on recrystallization and texture of cold-rolled Ni9W alloy were investigated. Moreover, the related mechanism is discussed.
II. EXPERIMENTAL
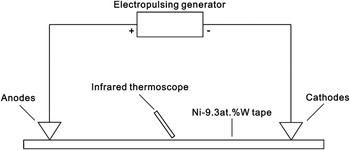
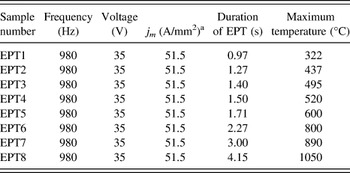
The samples were prepared from elements with 99.96% purity in an induction furnace and then casted (in argon atmosphere) in a cylindrical mold of 30 mm diameter. Then the ingots were forged at 1200 °C to obtain a rectangle-shaped rod of 20 × 40 mm. After cold rolling of a 99% reduction at room temperature, a Ni9W alloy strip of 0.2 mm in thickness was obtained. Electropulses supplied by a custom-made electropulsing generator were applied to the strip. The EPT process is schematically shown in Fig. 1. The distance between the two electrodes was 100 mm and an infrared thermoscope was used to monitor the surface temperature of the alloy strip. The electropulsing parameters such as frequency and voltage are shown in Table I. For comparison, conventional annealing (CA) was carried out at various temperatures for 2 h.
Schematic view of the EPT process.

Operation parameters of the electropulsing on the Ni9W strip.

a j m is the amplitude of current density of electropulsing.
Micro-hardness was measured by using loads of 500 g (partially recrystallized samples) or 300 g (fully recrystallized samples). At least five measurements were taken for each sample from different areas. The microstructure and texture were examined using a Tescan Mira3 field emission scanning electron microscope equipped with electron backscattering diffraction system (EBSD, Oxford Instruments, Oxford, England). For EBSD examination, the sample was first ground and then electropolished in a 1:3:4 HClO4/C2H5COOH/C2H5OH solution at 20 °C and 12 V for 30 s.
III. RESULTS
A. Recrystallization temperature
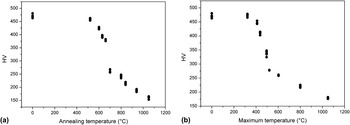
Figure 2 shows the micro-hardness of EPT and CA samples annealed at different temperatures. It can be seen that for CA process [Fig. 2(a)], the hardness begins to drop drastically at 630 °C, which indicates the beginning of recrystallization. After 700 °C, the decrease of hardness slows down. It indicates that the recrystallization is completed when the temperature increases to 700 °C. For the EPT process, a similar change of hardness was obtained, but the recrystallization starts to occur at 440 °C and finishes at 520 °C. Compared with that of CA, the full recrystallization temperature of EPT is decreased by ∼180 °C.
The hardness data for (a) CA and (b) EPT.

B. Recrystallization microstructure and texture
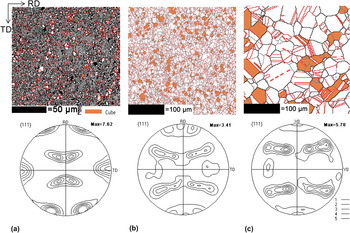
Figure 3 shows the microstructure maps and pole figures of CA samples annealed at various temperatures. In these EBSD orientation maps, orange indicates orientation spreads for the ideal cube orientations of 15°. Grain boundaries of >2° and >15° are represented by gray and black lines, respectively; while twin boundary is shown in red. Figure 3(a) shows the typical partial recrystallization microstructure of CA samples. Both recrystallized grains and deformed structures can be observed in the map. The recrystallized grains are seen with both cube and noncube orientation. Because of the low recrystallization fraction, the pole figure shows a typical deformation texture (mainly Brass orientation). After annealing at 840 °C for 2 h, the recrystallization is completed. The pole figure shows a typical recrystallization texture. Cube orientation becomes the main texture component, accompanying with some rolling direction (RD) rotated cube components (20° about RD axis). When the annealing temperature rises to 1050 °C, the recrystallization grains grow sufficiently, and the recrystallization texture is also well developed. The pole figure shows that the intensity of recrystallization texture increases, and the cube orientation dominates the recrystallization texture.
The microstructure maps and pole figures of CA samples annealed at various temperatures: (a) 660 °C, (b) 840 °C, (c) 1050 °C.

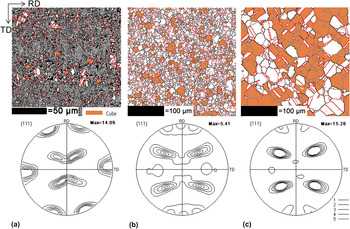
Figure 4 shows the microstructure maps and pole figures of EPT samples annealed at different temperatures. It can be seen that under EPT at 495 °C, the partial recrystallization microstructure is obtained, and a few recrystallization grains appear with both cube and noncube orientation. The pole figure shows a typical deformation texture. When the maximal temperature of EPT increases to 800 °C, complete recrystallization microstructure is observed. Compared with that of CA, the RD cube component does not change a lot, but the cube component is strongly reduced. When the EPT temperature rises to 1050 °C, the grains grow up. The pole figure shows that the intensity of recrystallization texture increases, and the main texture component is the RD cube orientation.
The microstructure maps and pole figures of EPT samples annealed at various temperatures: (a) 495 °C, (b) 800 °C, (c) 1050 °C.

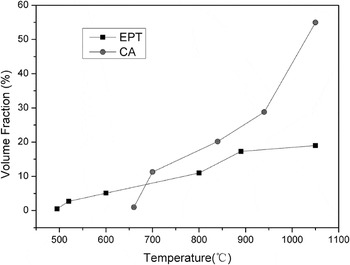
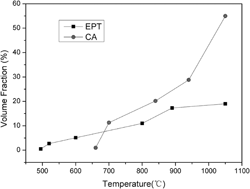
Figure 5 shows the volume fraction of cube texture (within 15°) of the EPT and CA samples annealed at various temperatures. The cube textures of both EPT and CA samples increase with the increasing annealing temperature. However, the increase of CA is faster than that of EPT. When the annealing temperature increases to 1050 °C, the volume fraction of cube texture in CA sample arrives to 55.1%. For the EPT sample annealed at the same temperature, the volume fraction of cube texture is only 19%.
The volume fraction of cube texture with different annealing temperatures.

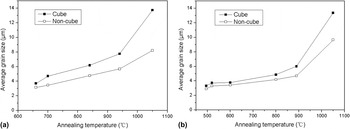
Figure 6 shows the variation of grain size with annealing temperature. Because the cube texture is greatly changed by EPT, the data are separated into two categories: cube orientation and noncube orientation grains. It can be found that the size of both cube and noncube grain increases with increasing annealing temperature in either CA samples or EPT samples. For the CA samples annealed at all the temperatures, the average size of cube orientation grains is slightly larger than that of noncube orientations grains. For the EPT samples, the size advantage of cube is also found, and it does not show obvious difference from that of CA.
Variation of average grain size as a function of annealing temperature. The data are separated into cube orientation and noncube orientation grains. (a) CA samples, (b) EPT samples.

C. Nucleation of recrystallization
The partial recrystallization EBSD maps of CA [Fig. 3(a)] and EPT [Fig. 4(a)] with the same recrystallization fraction were used to calculate the nucleation rate. For the purposes of quantitative characterization, the recrystallization nucleus is defined as a region that (i) has an area larger than 4 μm2, (ii) contains a small number of internal misorientations (<1.5°), and (iii) has a high-angle boundary continuously along at least one-third of its perimeter. Reference Li, Liu, Godfrey, Juul Jensen and Liu16 The nucleation rate of each orientation is calculated by Eq. (1):
 $${I_{(i)}} = C{I_{A(i)}}/{d_{(i)}}\quad ,$$
where I (i) is the nuclei number per unit volume of i orientation, C is geometry constant, I A(i) is the nuclei number per area of i orientation, and d (i) is the average size of grains with i orientation.
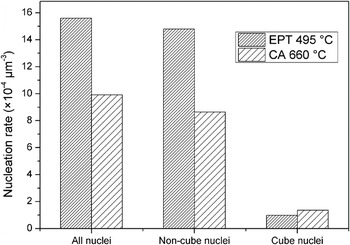
The nucleation rate for all nuclei, cube orientation, and noncube orientation nuclei is calculated, respectively, as shown in Fig. 7. It can be seen that the nucleation rate of EPT is signally higher than that of CA. Furthermore, the nucleation rate of noncube orientation is greatly improved by EPT, while the cube orientation nucleation does not change a lot. It indicates that EPT has different effects on the nucleation of different orientations.
The nucleation rate of partial recrystallization samples with the same recrystallization fraction.

IV. DISCUSSION
A. Electropulsing kinetics
The hardness data show that the recrystallization is just completed under CA at 700 °C for 2 h. However, for EPT, the recrystallization is completed within few seconds at 520 °C. This implies that EPT effectively accelerates the recrystallization process.
As is well known, the nucleation of recrystallization is related to the dislocation movement during the formation and growth of subgrains. Previous research Reference Liu, Deng and Weng17 shows that the dislocation climbing into the subgrain boundaries has close relationship with the total flux of diffusing atoms. The average atomic flux under EPT can be described by Eq. (2): Reference Jiang, Tang, Shek and Liu18
 $${J^r} = J_{\rm{t}}^r + J_{\rm{a}}^r = \;{{{\rm{\pi }}G \cdot b \cdot {D_{\rm{l}}}} \over {(1 - {\rm{\nu }}) \cdot k \cdot T}} + {{2N \cdot {D_{\rm{l}}} \cdot {Z^*} \cdot e \cdot {\rm{\rho }} \cdot f \cdot {j_m} \cdot {{\rm{\tau }}_p}} \over {{\rm{\pi }}k \cdot T}}\quad ,$$
where J
r
is the total flux of atom under electropulsing,
 $J_{\rm{t}}^r$
the flux of atom resulting from the thermal effect,
 $J_{\rm{a}}^r$
the flux of atom caused by the athermal effect, G the shear modulus, b the Burgers vector, D
l the lattice diffusion coefficient, ν Poisson's ratio, k the Boltzmann constant, T the absolute temperature, N the density of atoms, Z*·e the effective charges of lattice atoms, and ρ the electrical resistivity. In addition, j
m
, f, and τp are peak current density, frequency, and duration of electropulsing, respectively.
The first term of Eq. (2) is the flux of atom resulting from the thermal effect. Under CA at 495 °C, only this part plays a role on the dislocation climbing. The climbing velocity of dislocation is limited due to the low SFE of Ni9W and the low annealing temperature. Thus, no nuclei were found even after 2 h at 495 °C (the recrystallization begins at 630 °C under CA for 2 h). However, for EPT at the same temperature, the second term induced by athermal effect arises, accompanying with the first term. Previous studies Reference Xu19,Reference Jiang20 show that the atomic flux caused by athermal effect is several orders of magnitude larger than that caused by thermal effect. It then significantly increases the climbing velocity of dislocation. Thus, the nuclei can be formed in a few seconds under EPT, as shown in Fig. 4(a).
B. Evolution of recrystallization texture
After full recrystallization of CA, the orientations are predominantly cube texture. The ratio of noncube nucleation rate to the cube-oriented nucleation rate, i.e., α = I (noncube)/I (cube), is 6.35. It indicates that the cube nuclei do not have any quantity advantage. However, the average size statistics suggest that the average size of cube grains is always larger than that of noncube grains. These experimental results are in good agreement with the observation of Li Reference Li, Liu, Godfrey, Juul Jensen and Liu16 in pure nickel and Bhattacharjee et al. Reference Bhattacharjee, Ray and Tsuji21 in Ni5W alloy, which is explained by the prior nucleation and the higher growth rate of cube orientation. Reference Doherty22 In the recrystallization process, particularly at later stages of recrystallization, the size advantage of cube grains allows the cube grains to consume the noncube grains due to the reduction of grain boundary energy. It thus leads to a high cube recrystallization texture.
A key observation in the present study is that the fraction of cube texture under EPT is greatly decreased after full recrystallization compared with that of CA. The evolution of average grain size shows that the cube grains under EPT have a similar size advantage with CA sample. It indicates that the effects of EPT are insignificant on the nucleation priority and the higher growth rate of cube orientation. On the other hand, the nucleation rate result shows that EPT significantly changes the composition of nuclei orientations. Under EPT, the ratio of noncube nucleation rate
 $I_{{\rm{(noncube)}}}^{{\rm{EPT}}}$
to the cube-oriented nucleation rate
 $I_{{\rm{(cube)}}}^{{\rm{EPT}}}$
, i.e.,
 ${\alpha ^{{\rm{EPT}}}} = I_{{\rm{(noncube)}}}^{{\rm{EPT}}}/I_{{\rm{(cube)}}}^{{\rm{EPT}}}$
is 15.13. It means that the noncube nucleation is signally improved by EPT. Thus, the reduced cube grain number leads to a slow increase in cube texture fraction, although the cube grains will consume the noncube grains during the recrystallization.
C. Dependence of nucleation on orientation induced by EPT
Two factors lead to the difference of α between CA and EPT calculated by the nucleation rate shown in Fig. 7. One is the annealing temperature, which is different in CA and EPT. Previous research Reference Subramanya Sarma, Eickemeyer, Schultz and Holzapfel15 shows that lower annealing temperature reduces the value of α in NiW alloys. However, α is actually increased under EPT at relative lower temperature (495 °C). It implies that the other factor, i.e., electropulsing, will greatly increase the value of α.
During the nucleation process of i orientation under EPT, the total change of Gibbs free energy can be described by Eq. (3): Reference Jiang, Guan, Tang, Shek and Zhang23,Reference Hu, Shek, Zhu, Tang and Qing24
 $$\Delta {G_{(i)}}^{{\rm{EPT}}} = \Delta G_{(i)}^{\rm{0}} + \Delta G_{(i)}^{\rm{e}}\quad ,$$
where
 $\Delta G_{(i)}^{\rm{0}}$
is the free energy change for the nucleation of i orientation in a current-free system and
 $\Delta G_{(i)}^{\rm{e}}$
is the free energy change for nucleation of i orientation caused by electric current.
 $\Delta G_{(i)}^{\rm{e}}$
, which can be written as:
Reference Zhou, Zhang, Wang, He and Guo25–Reference Dolinsky and Elperin28
 $$\Delta G_{(i)}^{\rm{e}} = {{\rm{\mu }}_0}g{\rm{\xi }}\left( {{{\rm{\sigma }}_{{r_{(i)}}}},{{\rm{\sigma }}_{{d_{(i)}}}}} \right){j^2}\Delta V\quad ,$$
 $${\rm{\xi }}\left( {{{\rm{\sigma }}_{{r_{(i)}}}},{{\rm{\sigma }}_{{d_{(i)}}}}} \right) = {{\left( {{{\rm{\sigma }}_{{d_{(i)}}}} - {{\rm{\sigma }}_{{r_{(i)}}}}} \right)} \mathord{\left/ {\vphantom {{\left( {{{\rm{\sigma }}_{{d_{(i)}}}} - {{\rm{\sigma }}_{{r_{(i)}}}}} \right)} {\left( {{{\rm{\sigma }}_{{r_{(i)}}}} + 2{{\rm{\sigma }}_{{d_{(i)}}}}} \right)}}} \right. \kern-\nulldelimiterspace} {\left( {{{\rm{\sigma }}_{{r_{(i)}}}} + 2{{\rm{\sigma }}_{{d_{(i)}}}}} \right)}}\quad ,$$
where μ0 is the magnetic susceptibility in vacuum, g is a positive geometric factor for coarse grained materials, j is the current density, ΔV is the volume of a nucleus, and
 ${\rm{\xi }}\left( {{{\rm{\sigma }}_{{r_{(i)}}}},{{\rm{\sigma }}_{{d_{(i)}}}}} \right)$
is a factor resulting from the difference between the electrical conductivity of the new recrystallization nucleus
 ${{\rm{\sigma }}_{{r_{(i)}}}}$
and the electrical conductivity of nucleation site
 ${{\rm{\sigma }}_{{d_{(i)}}}}$
of i orientation. Because
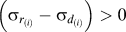 $\left( {{{\rm{\sigma }}_{{r_{(i)}}}} - {{\rm{\sigma }}_{{d_{(i)}}}}} \right) > 0$
, the value of
 ${\rm{\xi }}\left( {{{\rm{\sigma }}_{{r_{(i)}}}},{{\rm{\sigma }}_{{d_{(i)}}}}} \right)$
is decreased with increasing
 $\left( {{{\rm{\sigma }}_{{r_{(i)}}}} - {{\rm{\sigma }}_{{d_{(i)}}}}} \right)$
.
Previous researches
Reference Bhattacharjee, Ray and Tsuji21,Reference Duggan, Hatherly, Hutchinson and Wakefield29
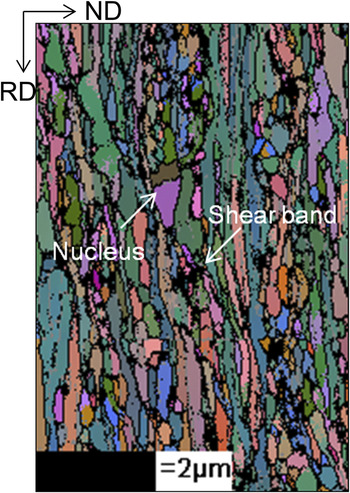
show that the cube nuclei originate from the cube band existing in the deformed structure, while the noncube nuclei originate from the shear bands with high deformation. The noncube nucleation in shear band is further confirmed at the very early stage of recrystallization in EPT Ni9W sample, as shown in Fig. 8. Many studies also found
Reference Bhattacharjee, Ray and Tsuji21,Reference Doherty, Hughes, Humphreys, Jonas, Jensen, Kassner, King, McNelley, McQueen and Rollett30,Reference Ridha and Hutchinson31
that the cube bands have lower stored energy due to the special dislocation arrangement for cube orientation. Thus, the electrical conductivity of cube band is higher compared with that of shear band. It means that
 $\left( {{{\rm{\sigma }}_{{r_{{\rm{(cube)}}}}}} - {{\rm{\sigma }}_{{d_{{\rm{(cube)}}}}}}} \right) \lt \left( {{{\rm{\sigma }}_{{r_{{\rm{(noncube)}}}}}} - {{\rm{\sigma }}_{{d_{{\rm{(noncube)}}}}}}} \right)$
. According to Eqs. (4) and (5), we can deduce that
 ${\rm{\xi }}\left( {{{\rm{\sigma }}_{{r_{{\rm{(cube)}}}}}},{{\rm{\sigma }}_{{d_{{\rm{(cube)}}}}}}} \right) > {\rm{\xi }}\left( {{{\rm{\sigma }}_{{r_{{\rm{(noncube)}}}}}},{{\rm{\sigma }}_{{d_{{\rm{(noncube)}}}}}}} \right)$
and
 $\Delta G_{{\rm{(cube)}}}^{\rm{e}} > \Delta G_{{\rm{(noncube)}}}^{\rm{e}}$
.
Nucleation of noncube orientation in shear band in EPT sample.

According to classical nucleation theory, the nucleation rate of i orientation under EPT can be written as: Reference Zhou, Zhang, Wang, He and Guo25
 $$I_{(i)}^{{\rm{EPT}}} = I_{(i)}^{\rm{0}} \cdot \left( {{D \over {{{\rm{\lambda }}^2}}}} \right) \cdot \exp \left( { - {{\Delta G_{(i)}^0 + \Delta G_{(i)}^{\rm{e}}} \over {R \cdot T}}} \right)\quad ,$$
where
 $I_{(i)}^0$
is a constant related to recrystallization, λ is the jump distance, and D is the diffusivity.
Because the nucleation rate of i orientation for a current-free system can be expressed as:
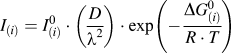 ${I_{(i)}} = I_{(i)}^0 \cdot \left( {{D \over {{{\rm{\lambda }}^2}}}} \right) \cdot \exp \left( { - {{\Delta G_{(i)}^0} \over {R \cdot T}}} \right)$
, Eq. (6) can be rewritten as:
 $$I_{(i)}^{{\rm{EPT}}} = {I_{(i)}} \cdot \exp \left( { - {{\Delta G_{(i)}^{\rm{e}}} \over {R \cdot T}}} \right)\quad .$$
Thus, the ratio of noncube nucleation rate to the cube-oriented nucleation rate under EPT, i.e.,
 ${{\rm{\alpha }}^{{\rm{EPT}}}} = I_{{\rm{(noncube)}}}^{{\rm{EPT}}}/I_{{\rm{(cube)}}}^{{\rm{EPT}}}$
, can be written as:
 $${{\rm{\alpha }}^{{\rm{EPT}}}} = {\rm{\alpha }} \cdot \exp \left( {{{\Delta G_{{\rm{(cube)}}}^{\rm{e}} - \Delta G_{{\rm{(noncube)}}}^{\rm{e}}} \over {R \cdot T}}} \right)\quad ,$$
where
 ${\rm{\alpha }} = {I_{{\rm{(noncube)}}}}/{I_{{\rm{(cube)}}}}$
is the ratio of noncube nucleation rate to the cube-oriented nucleation rate in a current-free system. Because
 $\Delta G_{{\rm{(cube)}}}^{\rm{e}} > \Delta G_{{\rm{(noncube)}}}^{\rm{e}}$
,
 $${{\rm{\alpha }}^{{\rm{EPT}}}} > {\rm{\alpha }}\quad {\rm{.}}$$
Equation (9) shows that EPT can increase the proportion of noncube nuclei and reduce the fraction of cube nuclei, compared with CA at the same temperature.
V. CONCLUSIONS
The effects of EPT on recrystallization and texture of the Ni9W alloy were investigated. EPT greatly accelerates the recrystallization behavior of the cold-rolled Ni9W alloy strip. Recrystallization process can be finished at a relatively low temperature within a short time, due to the substantial increase in the atomic flux resulting from the athermal effect.
EPT greatly increases the proportion of noncube orientation nuclei but it has little effect on the size advantage of cube-oriented nuclei. The reduced proportion of cube-oriented nuclei under EPT leads to a reduction of cube texture in the Ni9W alloy after full recrystallization.
ACKNOWLEDGMENT
The research was supported by the Natural Science Foundation of China (NSFC) under Grant Nos. 50671052 and 50971077.