


Introduction
Polynyas around the Antarctic coast are thought to be sites of Antarctic Bottom Water (AABW) production during winter (Reference Smith, Muench and PeaseSmith and others, 1990; Reference FosterFoster, 1995). Gold and windy atmospheric conditions encourage rapid ice formation, while persistent winds continually remove the ice cover. Previous estimates of ice-production rates in polynyas have largely been based on satellite remote-sensing data combined with meteorological data from numerical models (e.g. Reference Cavalieri, Martin and JacobsCavalieri and Martin, 1985). As the importance of these coastal polynyas to the global ocean circulation has been recognized, there have been an increasing number of experiments aimed at measuring the rate of ice production and the associated water-mass modification. Here, we report on recent measurements in the Mertz Glacier polynya (MGP) collected during August 1999. The MGP forms along the coast of the Antarctic continent at approximately 145° E, 67° S, to the west of Mertz Glacier Tongue (Reference Massom, Hill, Lytle, Worby, Paget and AllisonMassom and others, 2001). The ice which forms in the MGP is swept north and westward out of the polynya, while the glacier tongue blocks ice entering the region from the east.
Reference Cavalieri, Martin and JacobsCavalieri and Martin (1985) used passive microwave data and atmospheric model analysis combined with bulk-transfer calculations to estimate the total ice formation in the MGP as 8.8−11.1 m a-1. For an ice-growth season of about 100 days, this is an average rate of 8.8−11.1 cm d-1, although their study shows a large variation in ice-growth rate throughout the winter. They found a peak in the ice- formation rate during the first week in September which results from both an increase in the open-water area and an increase in the wind speed during that period. Reference Massom, Harris, Michael and PotterMassom and others (1998), by applying a threshold of 75% ice concentration to passive microwave data, estimated an average polynya area during June-October of 23 300 km2. From 1987 to 1994 this varied from 19150 to 30175 km2. Here we report on a series of measurements collected as newly forming frazil ice consolidated and drifted out of the polynya. We tracked the newly forming ice using drifting buoys and revisited them periodically to collect data on ice and snow characteristics. We use direct measurements of ice thickness to estimate regional ice-growth rates. Observations of ridging, ice-crystal structure and oxygen isotope values are used to determine the relative importance of thermodynamic and dynamic processes for increasing ice thickness.
From a RADARSAT synthetic aperture radar (SAR) image on 4 August 1999, we estimate that the polynya area was 16 800 km2. This has been calculated based on changes in the backscatter values from bright, with evidence of frazil streaks, to a lower backscatter where the ice has started to consolidate (Fig. 1). Although the size of the polynya varied throughout the experiment, this was a typical size for the polynya at its maximum extent during August 1999. We observed frazil ice and grease streamers forming near the upwind end of the polynya, the frazil being thicker in the middle of the long streams of grease ice and thinning towards the edges. The ice drifted generally north/ northwest, often forming small pancakes or thin sheets of nilas, before consolidating into a solid sheet of ice. Unconsolidated frazil ice was often observed beneath consolidated ice while travelling through the ice, with any new cracks or openings created as the ship broke through the ice rapidly filling with frazil.
Radarsatsar image collected on 4 august 1999. the initial deployment locations of the buoys are indicated with diamonds. locations of each of the buoy revisits are indicated with the station name in capital letters. the ice-observations transects used for estimating ice-growth rates are shown drawn between the revisit locations. array 1 is shown as a solid line, array 2 as a dashed line, and array 3 as a dotted line. sar image © RADARSAT international, 1999.

Data
Air temperature, air pressure, wind speed and wind direction were measured continually from the ship during the voyage and from an automatic weather station deployed on Eder Island to the west of the polynya (Fig. 2). On the ship, winds were measured 32 m above sea level, while air temperature and humidity were measured at 20 m. For most of the experiment, air temperatures ranged from about −15° to −23°C, although they dropped as low as −28°C for a short period. The exception to these lower temperatures was a warm spell from day 223 to day 226 (11−14 August) when temperatures reached as high as 0°C. This warm period was associated with a low-pressure system bringing a brief period of northeasterly winds. Apart from this, winds were generally south/ southeasterly, with speeds frequently reaching 20 m s -1 .
Meteorological data collected during the experiment. the solid line is data collected on the ship; the dotted line is data collected from an automatic weather station located on eder island at 66°57.5’ s, 143°56.5’ e.

During the experiment, 15 buoys in three different arrays were deployed in open water or newly forming frazil ice along Mertz Glacier Tongue or near the southeast boundary of the polynya in Buchanan Bay. The arrays were deployed approximately 1 week apart, and sea-ice and oceanographic observations were collected in the polynya between and after the deployments (Reference Bindoff, Williams and AllisonBindoff and others, 2001). The buoys are small and lightweight and are designed to drift with the frazil ice before becoming frozen into the newly consolidating ice. The buoys recorded a global positioning system (GPS) position hourly and these positions were relayed to the ship via the ARGOS system. Three of the buoys failed shortly after deployment, so for this study we use data from the remaining 12 buoys (3 arrays of 4 buoys each). The buoys drifted generally north/northwest after deployment.
After deployment, we revisited each of the buoy locations 1−3 times for a total of 22 revisits. During each of the revisits we collected ice samples. At two revisits, the frazil ice was unconsolidated and it was only possible to collect a sample of unconsolidated ice. For the remaining 20 sites, 10 cm diameter cores were collected. We avoided sampling near ridged areas, to increase the chance of collecting a sample of undeformed ice. The cores were sectioned in the ship’s cold room for crystal structure, salinity and oxygen isotope (δ18O) analyses.
The ice samples collected during the revisits were classified based on their crystal textures; all the cores had granular ice on the top, derived from the consolidation of the initial frazil formation. They have been divided into four categories (Table 1): unconsolidated frazil or slush (SL, two cores), granular only (GRN, six cores), granular on the top with columnar ice on the bottom (COL, ten cores), and rafted ice (RAF, four cores). These structural designations were chosen to distinguish between different stages in the ice growth. Initial frazil formation occurred in the open water, and this unconsolidated ice would increase in thickness as it drifted downwind. In some cases, pancake ice would start to form, allowing some consolidation of the ice cover. This accumulation of frazil crystals and/ or pancake ice would continue to consolidate to form a layer of granular ice. Although we do not attempt to estimate ice thickness prior to the consolidation of this initial frazil formation, we did collect samples of the frazil ice for oxygen isotope analysis.
Core length and structure for each of the revisits

In some cases, although the ice was consolidated and it was possible to walk on the surface, any holes drilled through the ice quickly filled with frazil crystals. Although we collected ice cores at this stage in the ice formation, estimating the average thickness of the frazil is difficult because of the mechanics of trying to sample ice which has not consolidated. Consequently, cores with only granular ice (GRN) may not have sampled all the frazil ice in the water column, and may give a low estimate for the cumulative ice growth. After the frazil ice has consolidated, continued thermodynamic ice formation will produce columnar ice at the base of the ice. A core of structural type COL should represent the total ice growth since initial frazil formation. Therefore, we assume that if columnar ice is present at the base of the ice core, there is no unconsolidated frazil in the water column and we have collected a representative thickness of ice. Although additional frazil formation occurred as new leads opened within the consolidated pack ice, this ice quickly consolidated. A thin sheet of nilas rapidly formed on newly formed leads, and the open-water concentration was typically <5%. Consequently, there was little opportunity for any thick frazil accumulation and we assume that any frazil formed in leads quickly freezes to form nilas. This assumption is confirmed by the lack of observed frazil in newly forming openings in the ice after the consolidation of the initial frazil accumulation.
Any rafting which occurs after columnar ice has formed will be apparent in the crystal structure and is identified as type RAF. Rafting prior to the columnar-ice formation may be more difficult to identify; however, we believe this to be the case with one of the cores (MM). Although this core was all granular ice, it was thicker than most of the ice surrounding it, and close inspection of the crystal structure indicates a possible rafted layer. Therefore, it has been included in the group of rafted cores for the analysis.
Based on the core length, ice-growth rates were calculated from the time the buoys were originally deployed until the time of the revisit. The ice-growth rate from cores of type GRN was 3.8 cm d-1, with a range of 1.7−6.4 cm d-1. The average for ice cores with columnar ice at the base (COL) was slightly higher at 4.0 cm d-1, with a range of 3.0−5.7 cm d-1.
Rafted ice cores (RAF) averaged 6.8 cm d-1 and showed the widest variation, ranging from 3.1 to 11.7 cm d-1.
The oxygen isotope ratio (518O) as a function of depth was measured for each of the samples. Following Reference Jeffries, Shaw, Morris, Veazey and KrouseJeffries and others (1994) and Reference Worby, Massom, Allison, Lytle, Heil and JeffnesWorby and others (1998), we use a δ18O value of < 0 to indicate the presence of snow within the sample. Fourteen of the ice cores had up to 10 cm of ice with a negative 51 80 (Table 1). The two sites which were sampled for slush only both had negative δ18O values, indicating some snow incorporation in the early formation of the granular ice. The six remaining ice cores had no snow ice. Five of these cores with no snow incorporation were collected on the first revisits where the air temperature was low and ice consolidation occurred rapidly.
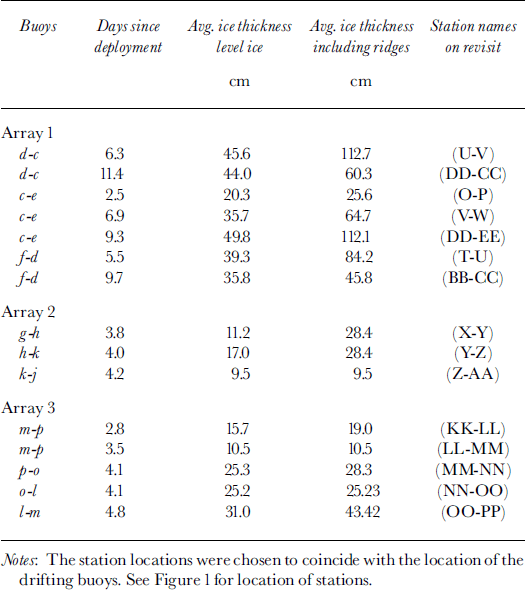
While travelling between each of the buoys, we collected detailed, standardized ice observations from the ship, based on the method developed by Reference Allison and WorbyAllison and Worby (1994). These observations recorded ice and snow thickness, ridging statistics and ice concentration every 30 mm. There are a total of 15 "legs". Using these data, we have calculated the average ice thickness between buoy locations, for both the level ice only, and including ridging (Table 2). The level-ice observations include the effect of rafted ice but not ridged ice. Ice-growth rates calculated from the ice observations averaged 5 cm d-1 for the level ice only and 8 cm d-1 for all ice (including the ridges). The estimates provide an area-averaged value for ice thickness, including any open-water areas. Legs O-P and LL-MM each had average ice concentrations of 86%, the remaining legs had ice concentrations of >96%, and eight of the legs had an ice concentration of 100%. Ignoring the open-water areas, the average ice growth rate would increase by <0.2 cm d-1.
Ice thickness calculated from ship-based ice observations along a track between two stations and strain rates between buoys from deployment to revisit times
Discussion and Conclusion
We have used a novel approach to estimating ice-production rates within the polynya. These growth-rate estimates are based on direct measurements of ice thickness and do not rely on any heat-flux estimates or parameterization which is often used to estimate ice growth and hence salt flux. A comparison of ice-growth rates calculated from unrafted cores and from the ice observations is shown in Figure 3. Overall, there is good agreement between results using the two measurement techniques. For both methods, the ice-formation rate decreases when air temperatures were warmer (around day 225), and increases again during the persistently colder weather (around day 234). The estimated ice-growth rates are based on measurements of incremental ice thickness as a given group of ice floes drifts, and are both a spatial and temporal average. The average growth rates calculated from the COL cores (4.0 cm d-1) and from rafted cores (RAF) (6.8 cm d-1) span the average growth rate calculated from the level-ice observation data (5.0 cm d-1). While ice cores provide only a single ice- thickness measurement, they have the advantage of also providing information on the crystal structure so that the influence of rafting can be removed from the ice-growth rate. Because we know the level-ice observations include some rafting, we estimate the 4.0 cm d-1 from the core samples to be the average thermodynamic ice-growth rate during the experiment.
Comparison of ice-growth rates from core samples (open triangles) and level-ice ship observations (solid diamonds). the lines indicate the range of dates from when the buoy was deployed in open water to the time the data on ice thickness were collected. symbols are located at the midpoint of this time period.

This estimate of 4 cm d-1 does not include the contributions due to deformation which we estimate from the ice observations. Including the ridged and rafted component of the pack increases the ice-formation rate to 8 cm d-1. However, the contribution from deformation through ridging (increasing the ice thickness) and divergence (decreasing the average thickness) varies widely (Table 2). This deformation varies spatially in different zones of the newly forming ice, and temporally as storms pass through the region. The increased ice-formation rate when ridging is included is indicative of the importance of deformation for increasing the ice thickness, even in the early stages of ice growth. Ice deformation results partially from the constricted outlet of the polynya, and the degree of deformation may vary depending on the characteristics of the pack ice to the north or the formation of fast ice to the west (for a full discussion see Reference Massom, Hill, Lytle, Worby, Paget and AllisonMassom and others, 2001). Consequently, the relative amount of deformation may change depending on these external factors.
Reference Roberts, Allison and LytleRoberts and others (2001) calculate ice-formation rates of 12 and 25 cm d-1 for different wind conditions over the 20 km of open water near the coast. Their estimates are higher because (a) our estimates include the growth rate as the ice consolidates, which is expected to be slower than ice growth in open water, and (b) they use higher wind speeds near the continent which increase the total turbulent heat flux.
Evidence of snow incorporation into the upper granular layer of ice was found in 16 of the 22 ice samples, or 13% of the total ice thickness sampled. Of the 42 days in the ice, snowfall was recorded on 23 days, and drifting snow on 13 days. In addition, observations from helicopters flying near the coast regularly noted considerable snow blowing off the coast into the open water. Four of the six cores with no snow (C-F) were from the first revisits of array 1. This ice had quickly consolidated under cold conditions, with little or no snowfall recorded. Therefore, it is possible for ice to form with no snow incorporation when the initial consolidation occurs rapidly under conditions with no falling or drifting snow.
As expected, ice formation generated by strong winds and low air temperatures initially occurred as frazil and grease ice. In some cases, the consolidation of these frazil crystals occurred over a period of several days, before forming a continuous ice sheet with a granular ice structure. Ice samples at stations S and FF were 3.1 and 4.5 days old, respectively, and no consolidated ice had formed. Although this frazil had grown initially under cold conditions, a warmer period had delayed the consolidation of the ice. Even during the colder periods, this frazil would take several days to fully consolidate, as evidenced by the frequent loose frazil observed in newly open areas within the pack. Although we observed some small pancakes forming under the influence of the wind waves, this was not a dominant mechanism for ice formation. The few pancakes that were observed had formed under the influence of waves generated locally, rather than the longer-period ocean swell as observed by Reference Wadhams, Lange and AckleyWadhams and others (1987). In the MGP, these short-period waves were rapidly damped out by the thick accumulation of frazil or the smaller pancakes, and the top few centimeters of ice rapidly consolidated. This generally occurred within 100 km of the polynya edge. Continued ice growth or consolidation of the frazil occurred at a much slower rate than the initial frazil-ice formation.
The average ice-growth rates reported here are for the first few days of ice formation. They are averages from the time of initial frazil formation through ice consolidation, and are also a sort of spatial integration as ice drifts north/ northwest through the polynya. The final location of the consolidated ice is outside the area of the polynya as implied from the SAR image (Fig. 1). Consequently, the ice-growth rate of 8 cm d-1 can be used in conjunction with the estimates of the polynya area from satellite imagery such as SAR or passive microwave, as reported in Reference Massom, Harris, Michael and PotterMassom and others (1998), to estimate total ice production and hence salt flux to the ocean. Higher ice-formation rates (12 and 25 cmd-1) such as those reported in Reference Roberts, Allison and LytleRoberts and others (2001) are applicable over a smaller area of open water. Note that this is a measured ice thickness, and the average salinity of the ice (about 10 psu) also needs to be taken into account when salt fluxes are calculated.
Our estimates of ice-production rates are similar to, although slightly lower than, those of Reference Cavalieri, Martin and JacobsCavalieri and Martin (1985) who use bulk heat-transfer equations. Although this study covers only one month in 1999, it is indicative of the ice-formation processes found in the MGP during winter. We find that about half of the ice thickness results from dynamic processes including both rafting and ridging, while the other half is thermodynamic in origin. Consequently, any model estimates need to consider both processes in estimating ice-growth. Air temperatures in mid-winter can reach 0°C, reducing the ice-formation rates. This reduces or delays the consolidation of any frazil ice, impacting the timing and location of salt rejection into the upper ocean, as the ice may drift farther before complete consolidation occurs. The timing and frequency of these warm storms could have a large influence on the annual ice-growth rate and hence the ocean salt flux. Although it is difficult to assess the relative importance of snow in the overall ice formation with these data, it is clear that snow is frequently incorporated into the ice, probably as blowing snow or snowfall during the initial frazil formation and before the ice is consolidated.
Acknowledgements
Numerous people helped collect the data during the polynya voyage. In particular, K. Golden, K. Hill, D. Kamian, C. McKinley M. Rapley and S. Wuttke helped collect the data used in this study. Thanks also to the captain and crew of the RSV aurora australis. RADARSAT images were provided by the Alaska SAR facility.



