Introduction
Major depressive disorder (MDD) is a serious mental illness with persistent depression and anhedonia as the main symptoms, which is a major burden for public health worldwide. Possible mechanisms related to MDD include neurotransmitter abnormalities, hypothalamic-pituitary-adrenal axis dysfunction, inflammation, and neural network dysfunction.Reference Dean and Keshavan 1 However, the pathogenesis has not been clarified. Significantly, due to the lack of objective laboratory-based diagnostic methods, the misdiagnosis rate is inevitable in major depression.Reference Mitchell, Vaze and Rao 2 Therefore, accurate and efficient diagnosis methods will considerably improve the current status of diagnosis and treatment of MDD.
Our team has been devoted to finding peripheral biomarkers for depression diagnosed over the past decade,Reference Zheng, Chen and Xie 3 -Reference Zhang, Liu and Xie 9 and several candidate plasma neurotransmitter metabolites have been reported, such as dopamine and gamma-aminobutyric acid, which were thought to be involved in the pathogenesis of depression.Reference Pan, Xia and Xie 10 In an integrated meta-analysis study, we systematically revealed that there are significant changes in lipid metabolism in the peripheral system of MDD patients, and that related metabolites can be regarded as diagnostic biomarkers for the disorder.Reference Pu, Liu and Xie 11 The discovery of biomarkers constantly facilitates diagnostic methods, while it provides underlying molecular evidence for the relative hypothesis of MDD.
Brain is an organ containing abundant lipid composition followed by adipose tissue.Reference Watkins, Hamilton and Katz 12 Lipid expression disturbance was verified associated with psychological disorder.Reference Gohar, Dieset and Melle 13 , Reference Wagner, Musenbichler and Lenz 14 Depression is a complex systemic disease accompanied by a variety of metabolic abnormalities, including dyslipidemia.Reference Rethorst, Bernstein and Trivedi 15 Our previous study also found that three proteins related to lipid metabolism were shown to be significantly altered in poststroke depression in proteomics research.Reference Zhan, Yang and Xie 16 Besides, variation of lipid metabolism appeared in the chronic restraint stress depression mice, and changed after treatment with acupuncture.Reference Jung, Lee and Park 17 Phospholipids (PLs) are crucial parts of cellular membranes, disturbance of which could induce cell injury, and even apoptosis. Alteration of phosphatidylcholine (PC) was involved in MDD patients’ plasma.Reference Huang, Balasubramanian and Hankinson 18 Plasma PCs and sphingomyelins were all found to change in depression patients.Reference Demirkan, Isaacs and Duijn 19
Although there is a significant change in lipid metabolism in MDD, especially PLs, most of the study only focused on the measurement of plasma metabolites, how the product disturbance affects depression is unknown, and the influence of altered lipid metabolites in the brain is not clear.
Given that lipid metabolites involved in the pathophysiology and etiology of MDD,Reference Messamore, Almeida, Jandacek and McNamara 20 this research intends to capture the potential lipid metabolites in plasma for MDD diagnostic approach. We evaluated the altered plasma metabolite profile in the metabolism of lipid, including PL, polyunsaturated fatty acids (PUFAs), and bile acid metabolism, to provide a useful diagnostic biomarker and possible therapeutic target for MDD. Moreover, we explored the changed metabolic product in the brain of depression model mice, which further validates the role of lipid metabolites on brain injuries in depression.
Methods
Ethics statement
The process of this research was reviewed and approved by the Ethical Committee of Chongqing Medical University. All clinical subjects and recruiters signed a written informed consent form at the beginning of the study.
Participants
A total of 42 drug-naïve MDD patients were recruited from the psychiatric center of the First Affiliated Hospital of Chongqing Medical University. All diagnoses were conducted by two experienced psychiatrists according to the Structured Psychiatric Interview using DSM-IV-TR criteria, and the depression severity was assessed by the 17-item version of the observer-rated Hamilton. Only MDD patients without anti-depressive drug treatment were recruited. MDD subjects with any pre-existing mental and physical disease were excluded. Specimens with hemolysis or hyperlipemia were excluded. Forty-nine healthy individuals from the medical examination center of First Affiliated Hospital at Chongqing Medical University were recruited. Healthy individuals without any mental and physical diseases were recruited, but specimens with hemolysis or hyperlipemia were excluded.
Blood sample of participants collection
Blood samples were collected into anticoagulant tubes and centrifuged at 3000 rpm for 15 min at 4 °C to obtain plasma. All plasma specimens were transferred into liquid nitrogen and then stored at −80 °C.
Animals
This study was approved by the Institutional Review Board of Chongqing Medical University. Male adult C57BL/6 mice (weight: 21-25 g; 8-10 weeks) were obtained from the Laboratory Animal Center of Chongqing Medical University (Chongqing, China). The mice were housed in light- and temperature-controlled conditions (12 hours light/dark cycle and lights on at 7:00 am, 21-25 °C, 55 ± 5% relative humidity) with access to water and food ad libitum.
cLPS depression model
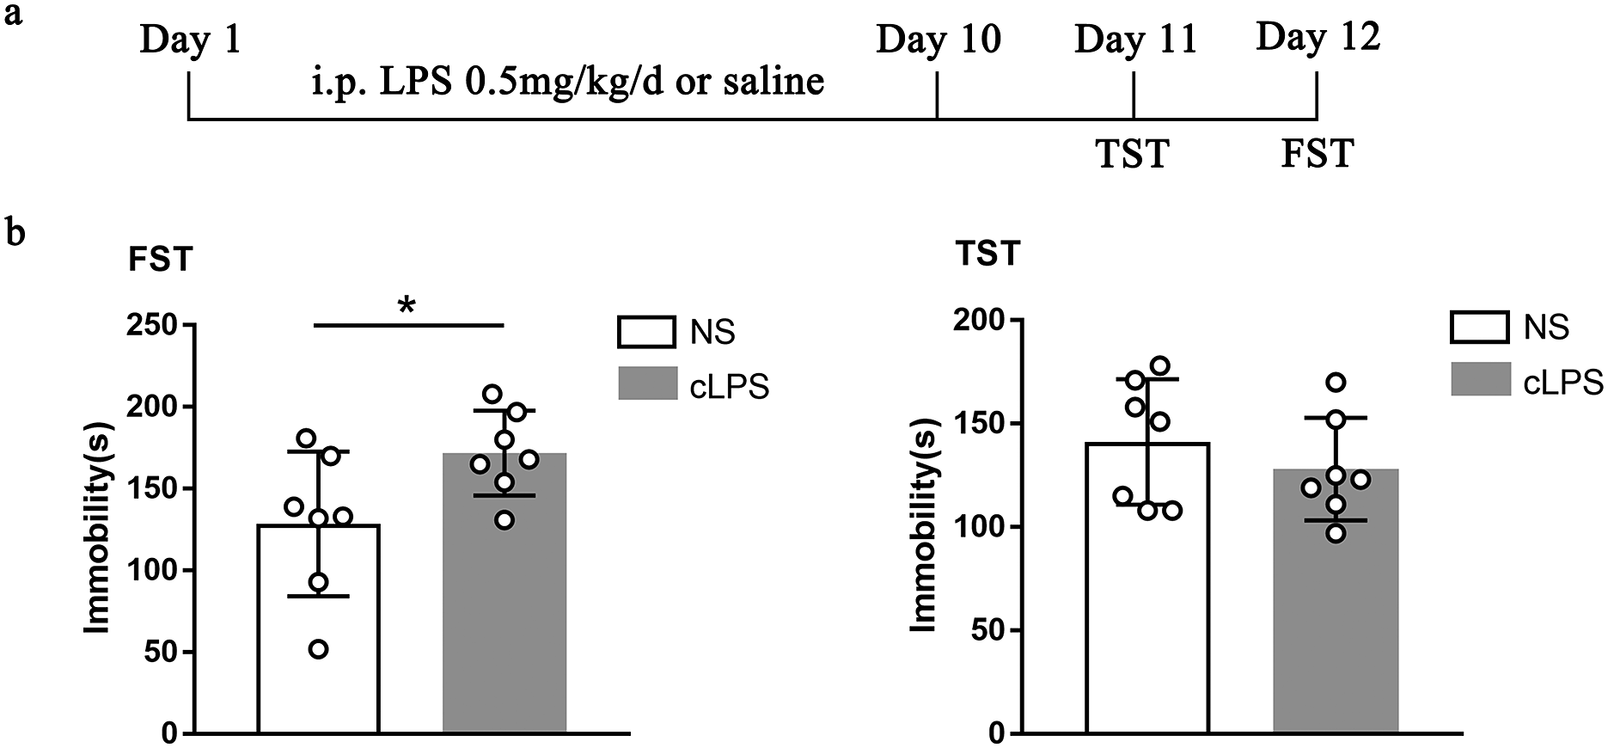
A total of 14 adult male C57BL/6 mice were randomly divided into two groups: cLPS (n = 7) and control (n = 7). The mice in cLPS group were intraperitoneally injected with LPS (0.5 mg/kg) for 10 days, and the control mice were injected with saline for 10 days.
Behavior test
All depressive-like behavior tests were performed in quiet environments and analyzed with Ethovision software (Noldus, Wageningen, the Netherlands). The tailed test (TST) was tested on the 11th day, and forced swim test (FST) was tested on the 12th day, which was used to assess the desperation of mice. The details of the behavior test were introduced in the previous research.Reference He, Li and Xie 21
Serum and hippocampus sample collection
The mice were sacrificed by rapid cervical dislocation after anesthesia. The blood samples were collected and centrifuged at 3000 rpm for 15 min at 4°C to obtain serum. The hippocampus of mice was quickly separated on ice and stored at −80 °C until use.
Liquid chromatography-mass spectrometry
Each 40 μL of plasma specimen was mixed with 10 μL of internal standard (1 μg/mL LPC 17:0 and 50 μg/mL glycocholic acid (GCA)-C13) and 150 μL methanol-acetonitrile mixed solution (v/v = 1:1). The composition of the resulting specimen was centrifuged (14 000g, 4 °C for 10 min) for the subsequent trials.
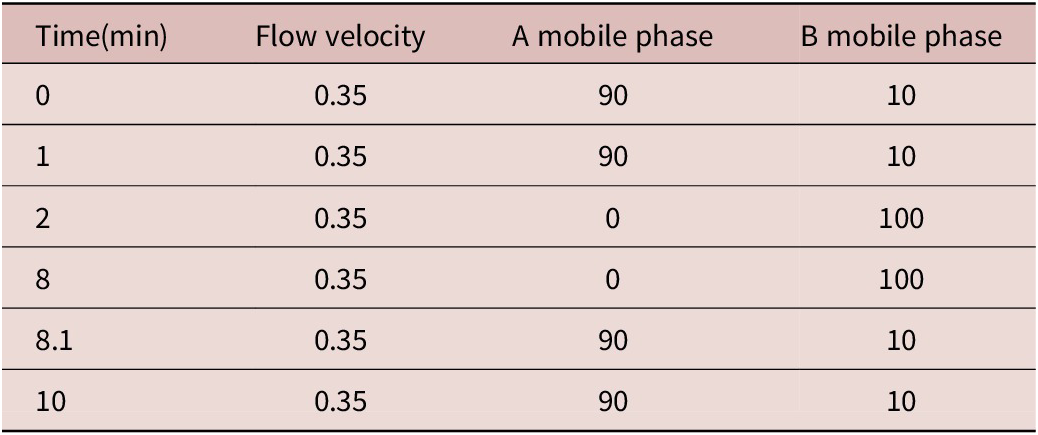
The PC metabolites were separated using a Waters AccQ-Tag Ultra column (2.1 mm × 100 mm, 1.7 μm). The column temperature was maintained at 45 °C, and the sample volume was 3 μL. The composition of A mobile phase included water, 0.1% formic acid, and 2 mM ammonium formate, and B mobile phase included methyl alcohol. Table 1 presents the test parameters of PC metabolites by ultra-performance liquid chromatography (UPLC).
The Test Parameters of PC Metabolites by UPLC

Note. A mobile phase: water, 0.1% formic acid and 2 mM ammonium formate. B mobile phase: methyl alcohol.
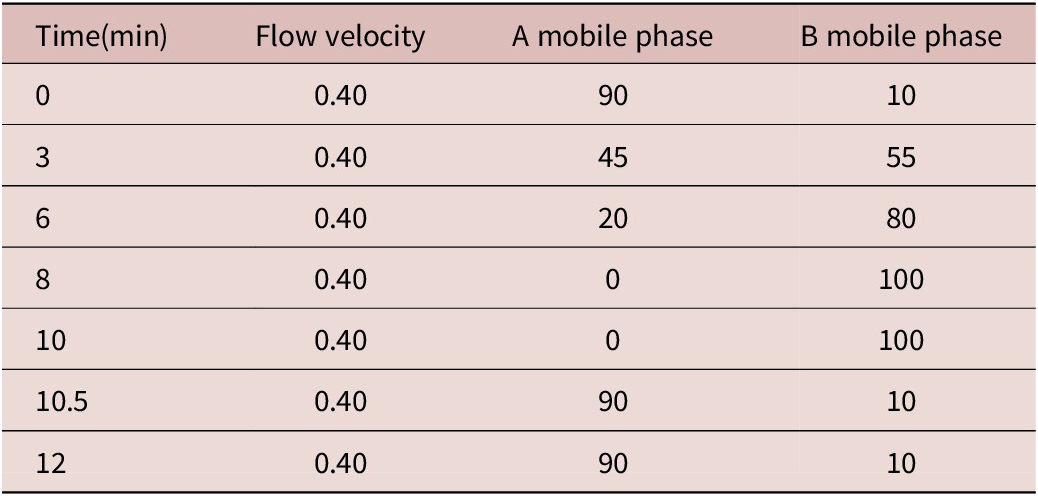
The LPC, bile acids, and PUFA metabolites were separated using a Waters BEH C18 column (2.1 mm × 100 mm, 1.7 μm). The column temperature was kept at 45 °C, and the sample volume was 3 μL. The composition of A mobile phase included water and 0.1% formic acid, and B mobile phase included acetonitrile and 0.1% formic acid. Table 2 shows the detection parameters of LPC, bile acids, and PUFA metabolites by UPLC.
The Test Parameters of LPC, Bile Acid, and PUFA Metabolites by UPLC

Note. A mobile phase: water and 0.1% formic acid. B mobile phase: acetonitrile and 0.1% formic acid.
The parameters of mass spectrum system included IonSpray voltage, (±)4500 V; source temperature, 550 °C; curtain gas, 20; CAD gas, 8; nebulizer gas (GS1), 50; auxiliary gas (GS2), 50; EP, 10; and CXP, 10. The electrospray ion source is positive and negative dual-ion source mode.
Data collected from liquid chromatography-mass spectrometry (LC-MS/MS) were analyzed using MassLynx V4.2 software (Waters, Milford, MA, USA) on the default parameters for automatic identification, integration of the MRM transition, and manual inspection. Linear regression standard curve was drawn by the mass spectrum peak area of analyte taken as the vertical coordinate and the concentration of analyte as the horizontal coordinate. Sample concentration calculation: the mass spectrum peak area of the sample analyte was substituted into the linear equation to calculate the concentration result.
ELISA
The concentration of oxidation of 1-palmitoyl-2-arachidonoyl-sn-glycero-3-phosphocholine (OxPAPC), IL-8, IL-6, and caspase-3 in serum of control mice (n = 6) and cLPS mice (n = 5) were detected by an OxPAPC enzyme-linked immunosorbent assay kit (Kalang, Shanghai), an IL-6 enzyme-linked immunosorbent assay kit (Kalang, Shanghai), and a caspase-3 enzyme-linked immunosorbent assay kit (Kalang, Shanghai).
The hippocampus samples were homogenized using a tissue lyser in ice-cold phosphate buffered solution (PBS) supplemented with protease and phosphatase inhibitor (Beyotime). Proteins were obtained after centrifugation at 15000 rpm for 15 min. Protein concentration was tested using the Enhanced BCA Protein Assay Kit (Beyotime, P0010). The concentration of OxPAPC, IL-8, IL-6, and caspase-3 in hippocampus of control mice (n = 7) and cLPS mice (n = 7) were detected by enzyme-linked immunosorbent assay kits (Kalang, Shanghai). Samples were analyzed following the manufacturer’s instructions. The relative expression of OxPAPC in hippocampus is presented as the ratio of OxPAPC concentration to total protein concentration, so as the relative expressions of IL-8, IL-6 and caspase-3.
Statistical analysis
The statistical analyses were carried out with SPSS 24.0 (IBM, Chicago, USA) and GraphPad Prim 7, and all results were expressed as the mean ± SEM. Data of the classified variables (sex) were measured using Chi-square test. Age was compared using nonparametric test, and concentrations of metabolites, OxPAPC, IL-6, and caspase-3 were compared using independent-sample t-test or nonparametric test. The heatmap of the metabolites was obtained using Heml 1.0. The correlations between metabolites and age and different metabolites were validated by Pearson’s correlation analysis. The diagnostic value of single changed metabolites was examined with the use of receiver operating characteristic (ROC) curve, and the combination of related metabolites was validated by logistic regression analysis coupled with ROC curve.
Results
Clinical characteristics of subjects
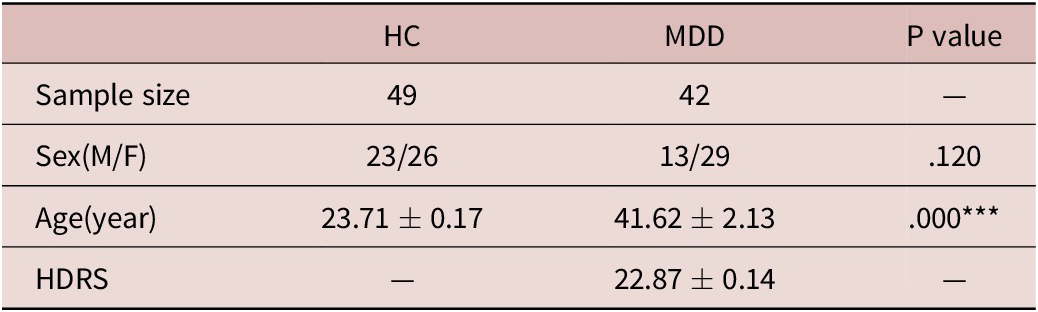
A total of 42 MDD patients and 49 healthy controls (HCs) were recruited in the analyses. The sociodemographic and clinical characteristics of participants are presented in Table 3. Pearson’s correlation analysis showed there was no correlation between these metabolites and age in MDD patients (Table 4), which demonstrated that the difference in age did not affect these metabolite levels of plasma in MDD subjects.
Demographic Characters of Participants

Note. Values expressed as the mean ± SEM.
Abbreviations: F, female; HC, healthy controls; HDRS, Hamilton depression rating scale; M, male; MDD, major depressive disorder.
*** P < .001.
Correlation between Age and Metabolites

Abbreviations: GCA, glycocholic acid; GCDA, glycoursodeoxycholic acid; GCDCA, chenodeoxycholic acid glycine conjugate; MDD, major depressive disorder; TCA, taurocholic acid; EPA, eicosapentaenoic acid; AA, arachidonic aid; DHA, docosahexaenoic acid; DCA, desoxycholic acid; CDCA, chenodeoxycholic acid.
Metabolites alterations of plasma in HC and MDD subjects
To find the changed metabolites in MDD, we tested the plasma concentrations of PUFAs, PCs, LPCs, and bile acid metabolites in HC subjects and MDD patients using LC-MS. The expression of PCs (1,2-dipalmitoyl-sn-glycero-3-phosphocholine (16:0-16:0 PC, DPPC), 1-palmitoyl-2-arachidonoyl-sn-glycero-3-phosphocholine (16:0-20:4 PC, PAPC), 1-palmitoyl-2-stearoyl-sn-glycero--phosphocholine (16:0-18:0 PC)) and bile acid metabolites (GCA, taurocholic acid [TCA], glycoursodeoxycholic acid [GCDA], and chenodeoxycholic acid glycine conjugate [GCDCA]) were significantly increased, and LPC (1-heptadecanoyl-2-hydroxy-sn-glycero-3-phosphocholine [(LPC 20:0]) was decreased in 42 MDD patients (Figure 1a). The expressions of these metabolites were presented in heatmap (Figure 1b after being normalized by Z-scores). These results provide the possible candidates for diagnosing MDD but need further assessment.
Concentrations of metabolites in HC subjects and MDD patients’ plasma. (a) The levels of PCs, LPCs PUFAs, and some bile acid in the plasma of HC in comparison with MDD subjects (*P < .05, **P < .01, ***P < .001.) (b) The heatmap of PUFAs, PCs, LPCs, and bile acid metabolites in 49 HC and 42 MDD subjects.

Evaluation of changed metabolites’ diagnostic values for MDD
The aim of this study was to evaluate the potential plasma metabolite for diagnosing MDD. According to the alterations of 16:0-16:0 PC, 16:0-20:4 PC, 16:0-18:0 PC, LPC 20:0, GCA, TCA, GCDA, and GCDCA in MDD patients, the diagnostic ability of these metabolites was assessed by ROC curve. The ROC curve and area under the curve (AUC) were a kind of index to assess the disease recognition ability of diagnostic method. Basically, the AUC between 0.5 and 1.0 explains the diagnostic function, while the diagnostic value is better as the AUC is close to 1.0. As shown in Figure 2a-c, the AUC of 16:0-20:4 PC was 0.9519, 16:0-16:0 PC was 0.7653, 16:0-18:0 PC was 0.7682, LPC 20:0 was 0.613, TCA was 0.7238, GCA was 0.6914, GCDA was 0.6535, and GCDCA was 0.6565. As the effective diagnostic function, namely the value of AUC was higher than 0.7, 16:0-20:4 PC (AUC = 0.9519) showed the greatest efficacy for MDD recognized.
ROC curves of changed metabolites in MDD subjects. The diagnostic values of (a) 16:0-16:0 PC, 16:0-18:0 PC, 16:0-20:4 PC (b) LPC 20:0, (c) TCA, GCA, GCDA, and GCDCA were validated by the ROC curve.

To investigate the association of changed metabolites, the correlation coefficients between every two among these metabolites in HC and MDD subjects were validated by Pearson’s coefficient analysis (Figure 3a). The three PCs metabolites, 16:0-16:0 PC, 16:0-20:4 PC, and 16:0-18:0 PC, showed a good association, and so the four bile acids did. To find better biomarkers for diagnosing MDD, the assessments of combined related metabolites were tested by logistic regression and ROC curve analysis. The combination of TCA, GCA, GCDA, and GCDCA had the AUC of 0.7527, and 16:0-16:0 PC, 16:0-20:4 PC, and 16:0-18:0 PC showed the greatest diagnostic value with the AUC of 0.9602 (Figure 3b), which demonstrated the optimal diagnostic method for MDD.
System analysis of lipid metabolites in HC and MDD subjects. (a) The correlations between changed lipid metabolites. The correlation was expressed by color-cored scale, the red color indicated a positive correlation, blue color indicated negative correlation, and the cross showed uncorrelation. (b) The ROC curves of the combination of related PCs and bile acid metabolites.

OxPAPC, IL-8, and caspase-3 were increased in cLPS depression mice
The results of plasma metabolites in MDD patients indicated the great diagnostic value of PCs for depression, especially 16:0-20:4 PC. To further study the role of PCs in depression, OxPAPC, the product of PAPC after free radical-induced oxidation, was detected in cLPS depression mice. Mice injected with LPS for 10 d showed the longer immobility in FST (Figure 4a,b), which illustrates the depressive-like behaviors of mice. The OxPAPC level in serum and hippocampus of cLPS mice were both increased compared to control mice (Figure 5a). The inflammation and apoptosis-related molecules, IL-8 and caspase-3, were increased in hippocampus of depression mice, but not in serum (Figure 5b,c). The result still further demonstrates that PCs metabolites participate in the process of depression by affecting apoptosis.
The depressive-like behaviors in cLPS depression mice. (a) The schedule of cLPS injection and behavior tests. (b) The immobility of FST and TST in cLPS and control mice. cLPS, chronic LPS; NS, normal saline (*P < .05).

OxPAPC, IL-8, and caspase-3 increased in hippocampus of cLPS group mice. (a) OxPAPC of LPS-injected mice in hippocampus and serum was increased. (b) IL-8 and (c) caspase-3 expressed higher in hippocampus of cLPS group mice. (d) IL-6 expressions in hippocampus and serum between cLPS group and control group mice. cLPS, chronic LPS; NS, normal saline (*P < .05).

Discussion
In our study, PCs metabolism disturbance was validated participation in the process of depression. PCs and bile acid metabolites significantly changed in anti-depressive drug-naïve MDD patients compared to HC detected by LC-MS. The 16:0-20:4 PC found the greatest diagnostic marker for MDD with a high AUC of 0.9519 by ROC curve evaluation, and the combination of three PCs showed the optimal diagnostic value with a higher AUC of 0.9602. These clinical findings illustrate that 16:0-20:4 PC may be a great biomarker for depression. Besides, the cLPS depression mice showed higher OxPAPC levels in serum and hippocampus in comparison with control mice, which further supports the role of PCs in depression.
Our team previous study found that fatty acid metabolism was associated with MDD in young patients. In addition, the increases of some PCs, such as PC (10:0/14:1), PC (12:0/22:5), and PC (20:5/24:4), were obviously up-regulated in the children and adolescent drug-naïve patients.Reference Zhou, Liu and Xie 8 Liu et al.Reference Liu, Li and Xu 6 found that LPC, LPE, PC, PE, PI, and TG remarkably increased in MDD and showed positive relationships with depression severity. These previous results also suggested that PCs were intimately associated with depression. Our results not only found the alterations of 16:0-16:0 PC, 16:0-20:4 PC, 16:0-18:0 PC, LPC 20:0, GCA, TCA, GCDA, and GCDCA in MDD patients, but also validated the high diagnostic value of 16:0-20:4 PC for depression.
The important role of 16:0-20:4 PC, also known as PAPC, in diagnosing MDD was stand out in our research. PAPC is a kind of PUFAs-containing PC on the surface of low density lipoprotein (LDL). PLs with PUFAs are a special kind of lipids, which play a part in normal growth and development.Reference Marquardt, Heberle and Katsaras 22 -Reference Lu, Guo and Yin 24 PUFAs in the sn-2 position of PLs are the major target for oxidation, resulting in the generation of various fragmented and non-fragmented products. These products have the ability of regulating intracellular signal transduction, inducing cell apoptosis, stimulating ROS producing, and prompting or inhibiting inflammation. As PLs are enriched in all kinds of tissues, the disorder of oxidized PLs participates in the pathogenesis of various organ injuries.Reference Philippova, Resink, Erne and Bochkov 25 Brain is an organ with density lipid expression and intense oxygen consumption, so oxidative stress and lipid peroxidation account for much progression of various neurological disorders. Multiple sclerosis (MS) is an autoimmune neurodegenerative disease with demyelinated plaques and axonal degeneration, and the oxidized 1-palmitoyl-2-(5′-oxo) valerylsn-glycero-3-PC was gathering in MS patients’ brains.Reference Qin, Goswami, Balabanov and Dawson 26 Besides, the highest levels of OxPAPC in the cerebrospinal fluid were detected in children with lymphoblastic leukemia receiving intense methotrexate treatment, and some of these patients showed neurocognitive deficiencies, anxiety, and depression symptoms.Reference Miketova, Kaemingk and Moore 27 These findings revealed the disturbance of oxidized PCs played a major role in some neurological disorders.
Exploring human diseases based on animal models is a common research method, which can widely relieve limitations of clinical research and assist us in understanding the etiology and pathogenesis of diseases. The genetic, epigenetic, and environmentally induced animal models of depression have been developed. These depression animal models mostly reproduce depressive symptoms in MDD patients, and help us study the pathogenesis and therapeutic target of depression.Reference Becker, Pinhasov and Ornoy 28 , Reference Leskanicova, Babincak and Kiskova 29 In our research, we found PAPC changed significantly in MDD patients, which showed its great diagnostic value for depression. To further figure out whether PAPC participates in depression in brain, we detected related oxidative product of PAPC—OxPAPC and some inflammation cytokines in the brain of depression animal models. Based on cLPS depression model, our study found that OxPAPC levels were increased in hippocampus and serum of cLPS group depression mice, accompanied by higher IL-8 and caspase-3 expressions in hippocampus. Free radical-induced oxidation of PAPC generates a product mixture, including 1-palmitoyl-2-glutaroyl-sn-glycero-3-phosphocholine (PGPC) and 1-palmitoyl-2-(5-oxovaleroyl)-sn-glycero-3-phosphocholine (POVPC),Reference Watson, Leitinger and Berliner 30 1-palmitoyl-2-(5-hydroxy-8-oxooct-6-enoyl)-sn-glycero-3-phosphocholine (HOOA-PC),Reference Subbanagounder, Deng, Borromeo, Dooley, Berliner and Salomon 31 which had the ability to activate endothelial cells to bind monocytes, and the oxidized PLs POVPC and PGPC could induce the growth inhibition, viability, and the features of cell death of vascular smooth muscle cell (VSMC).Reference Salomon 32 , Reference Fruhwirth, Moumtzi, Loidl, Ingolic and Hermetter 33 Oskolkova found that OxPAPC at the low concentration inhibited the LPS-induced increase in E-selectin mRNA in endothelial cells and speculated that low levels of OxPLs in circulation served anti-LPS function, whereas pro-inflammatory effects of OxPLs were more likely to develop locally at sites of tissue deposition of OxPLs. OxPAPC also induced endothelial cells glycolysis and proliferation mediated by nuclear factor erythroid 2-related factor 2 (NRF2).Reference Kuosmanen, Kansanen and Levonen 34 Besides, OxPAPC increased the expression of interleukin and tumor necrosis factor α.Reference Tseng, Lu and Tintut 35 According to the changes of IL-8 and caspase-3 levels that appeared in hippocampus in LPS-injected mice, we speculated the rises of IL-8 and caspase-3 were associated with the increase of OxPAPC. It was suggested that PCs may participate in the process of depression by OxPAPC regulating the brain inflammation and apoptosis.
Conclusion
In this research, 16:0-16:0 PC, 16:0-20:4 PC, 16:0-18:0 PC, LPC 20:0, GCA, TCA, GCDA, and GCDCA disturbances were showed in drug-naïve MDD patients in comparison with healthy people, which demonstrated the association of PCs and bile acid with depression. In addition, 16:0-20:4 PC and the combination of PC metabolites were validated to be the potential biomarkers for diagnosing MDD with the great AUC values. Furthermore, this study found that OxPAPC expression was increased in cLPS mice hippocampus and serum, coupled with the change of IL-8 and caspase-3, which validated the importance of PCs in MDD and hinted the PC metabolites participation in the process of depression. However, the larger plasma sample size of MDD and HC subjects should be detected to reinforce the association of PCs and bile acid with depression, and the mechanism of PCs affecting the progress of depression was unknown, which needs further studying. In sum, the change of PC metabolites in MDD patients’ plasma and cLPS depression mice hippocampus and the ROC analysis identify the potential biomarker assisted for diagnosing MDD.
Acknowledgment
We are thankful to all participants. Peng Xie, Yue Wang, Ke Cheng and Xiangyu Chen were responsible for the study concept and design, data analysis and manuscript drafting. Yue Wang, Xiangyu Chen, Zhi Chen, Heming Yu, Yong He and Yu Tian were responsible for performing the experiments.
Financial support
This study was supported by the National Key R&D Program of China (Peng Xie, Grant No. 2017YFA0505700), the Non-Profit Central Research Institute Fund of the Chinese Academy of Medical Sciences (Peng Xie, Grant No. 2019PT320002), the Natural Science Foundation Project of China (Grant No. 81820108015), the Natural Science Foundation of Chongqing, China (Ke Cheng, cstc2020jcyj-msxmX0213), the China Postdoctoral Science Foundation (Yue Wang, 2022MD713715), and the Chongqing Postdoctoral Science Foundation (Yue Wang, 2022NSCQ-BHX1294).
Disclosures
The authors do not have any conflicts of interest to declare.